COVID-19: Why is the medical system in metropolises so vulnerable?

By Zhou Muzhi, president of Cloud River Urban Research Institute

Editor’s note: How come the metropolises around the world with concentrated medical resources are so vulnerable to the COVID-19 outbreak? What is the future of globalization and international metropolises? As the Cloud River Urban Research Institute releases the 2019 ranking on health care radiation in Chinese cities, Zhou Muzhi, professor of Tokyo Keizai University and president of Cloud River Urban Research Institute, gives his perspective on the health care system in major cities in the coronavirus crisis.

2019 ranking on health care radiation in Chinese cities

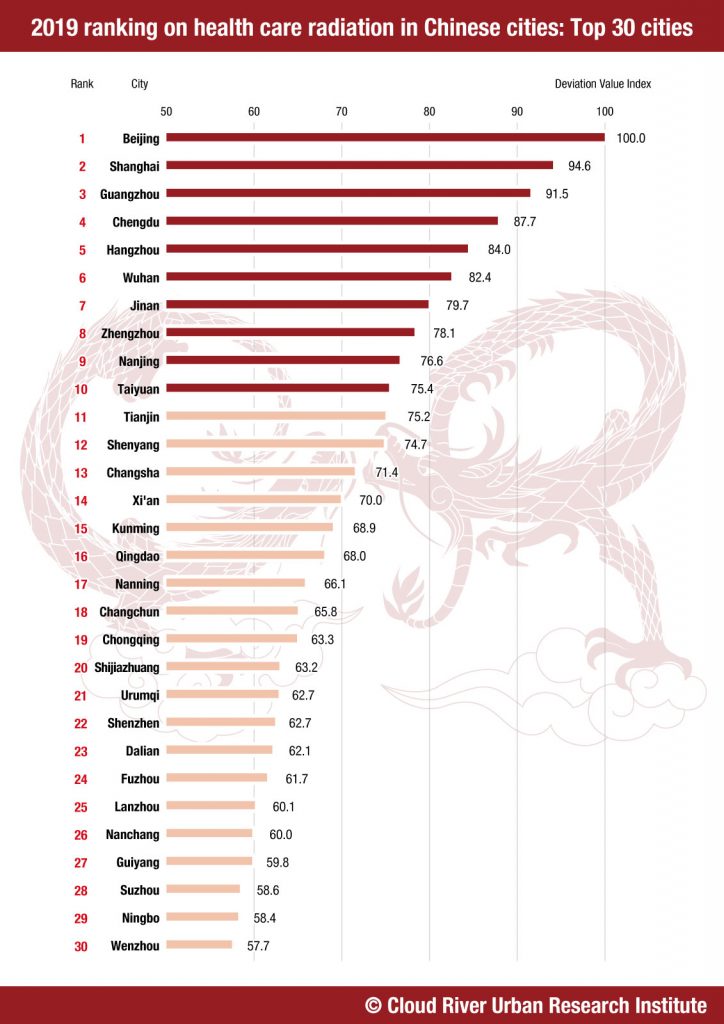
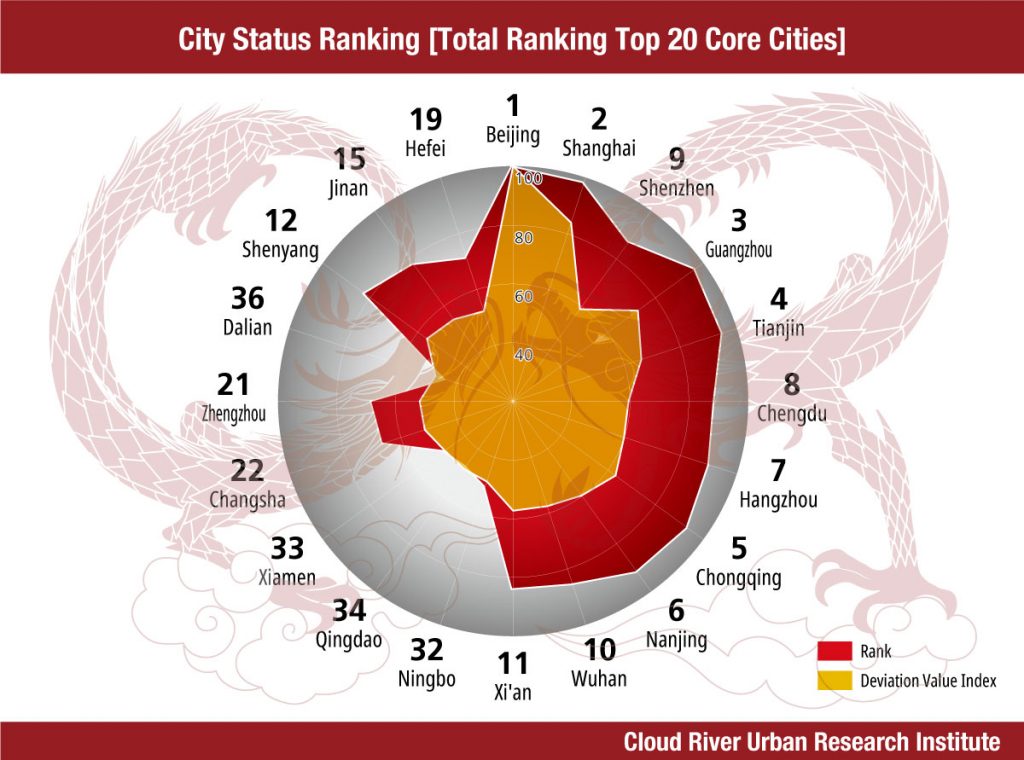
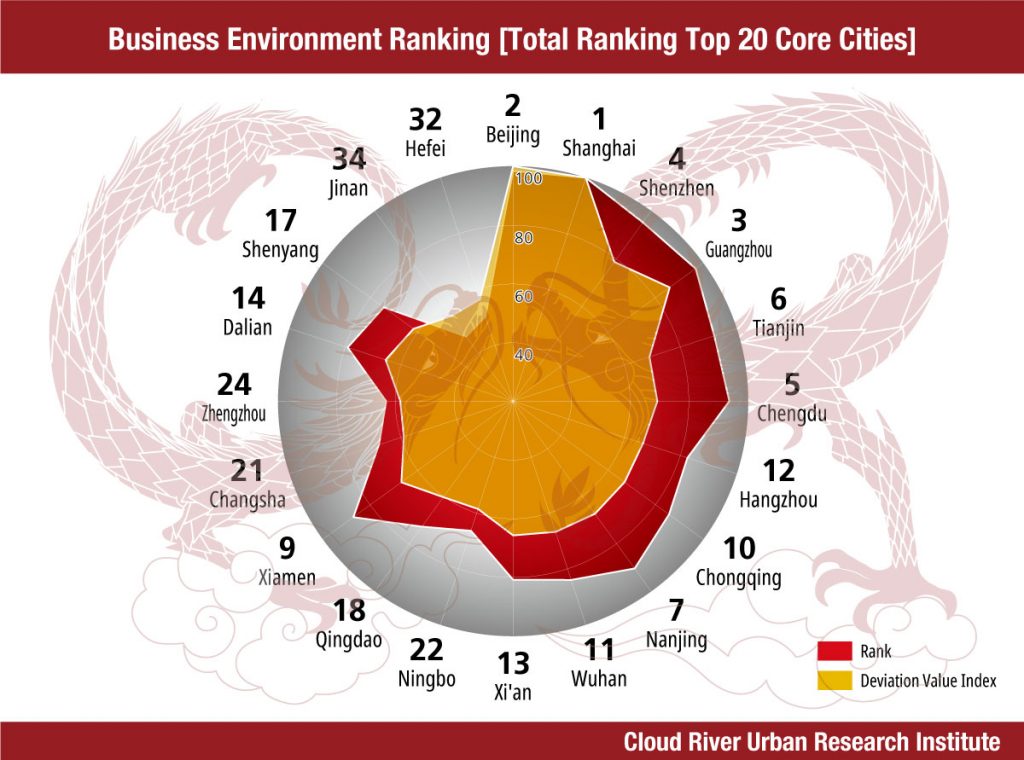
Medical care radiation of Chinese cities in 2019

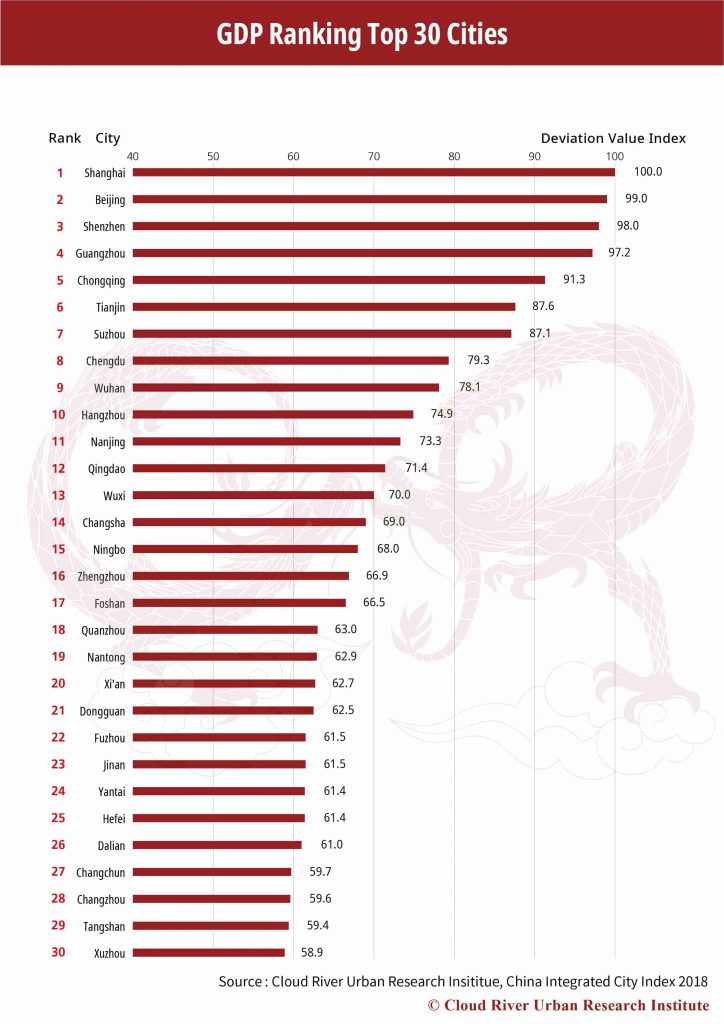
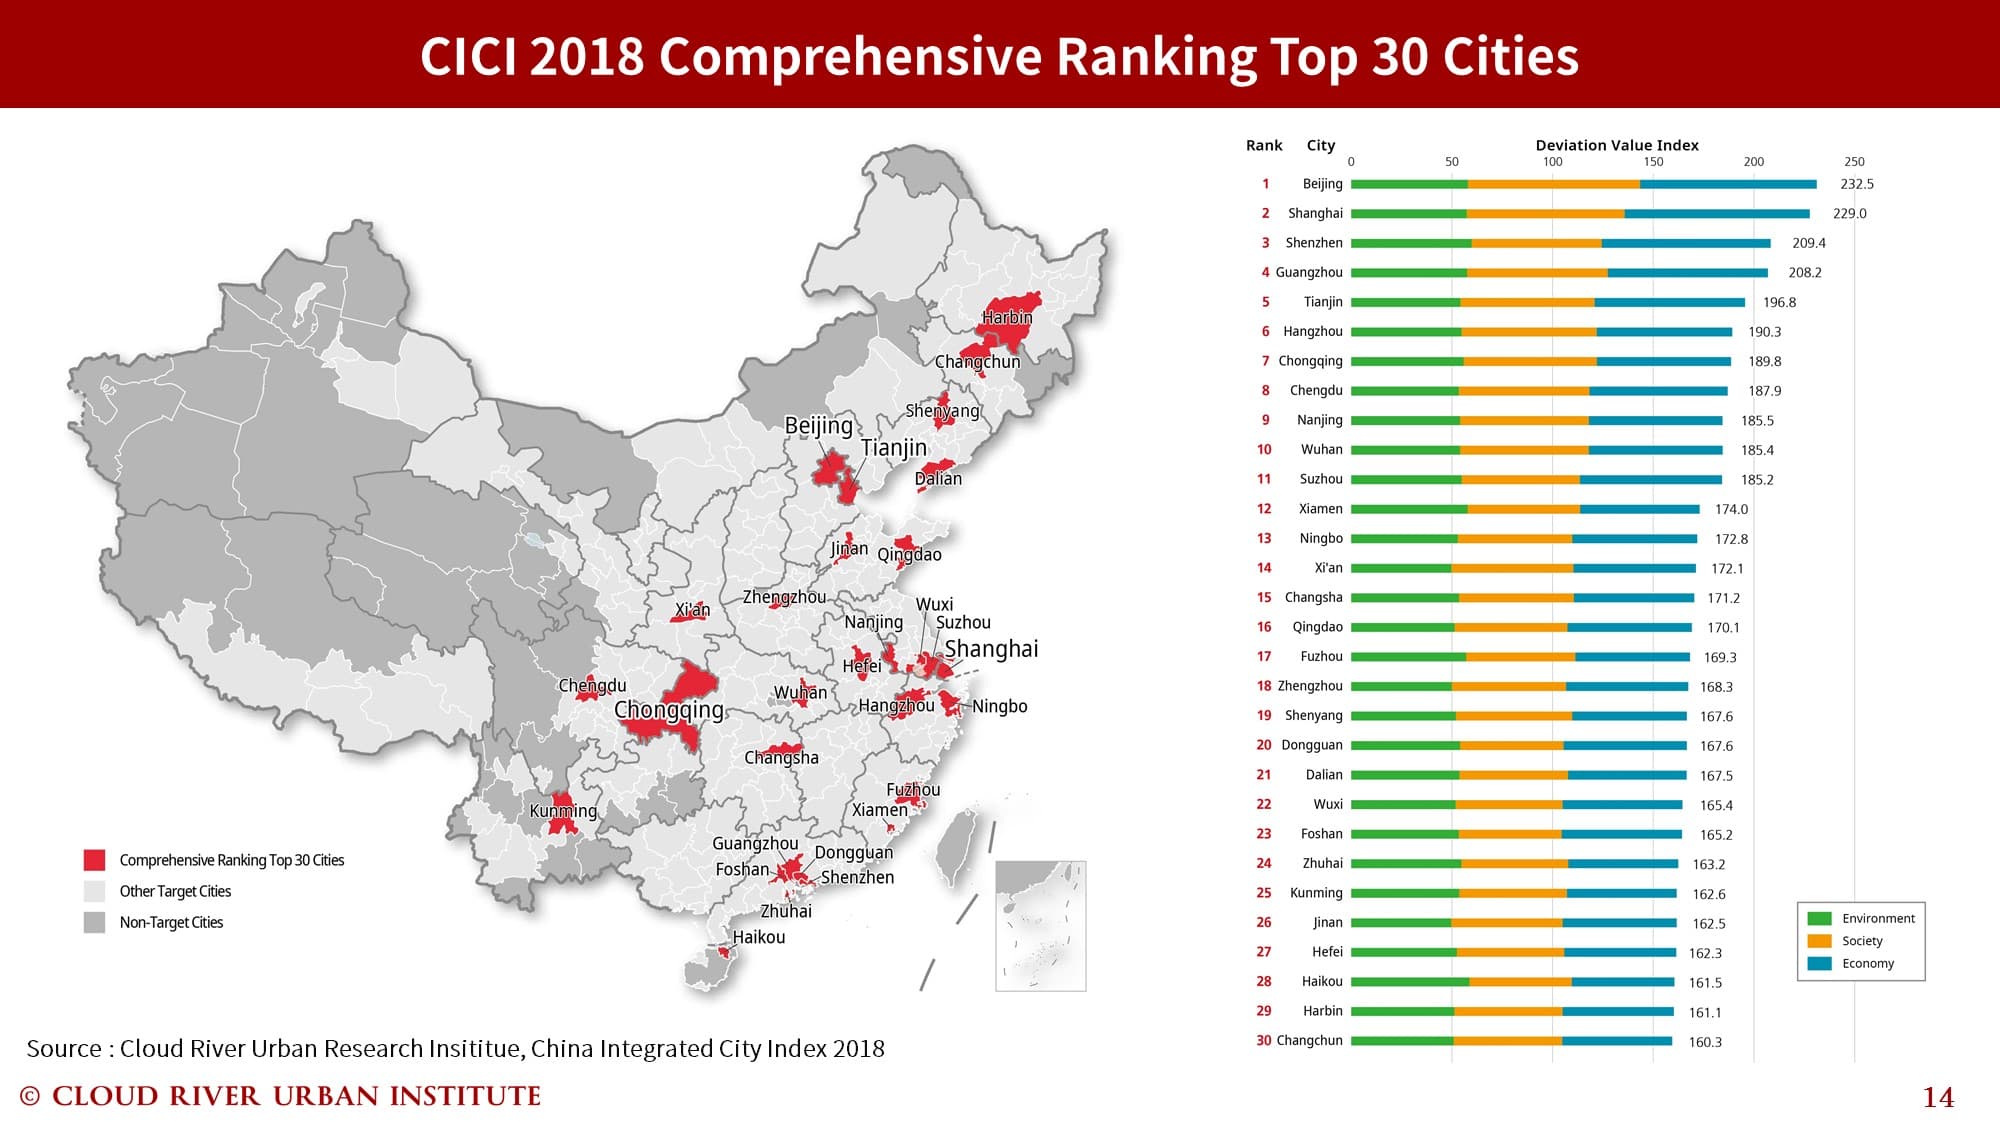
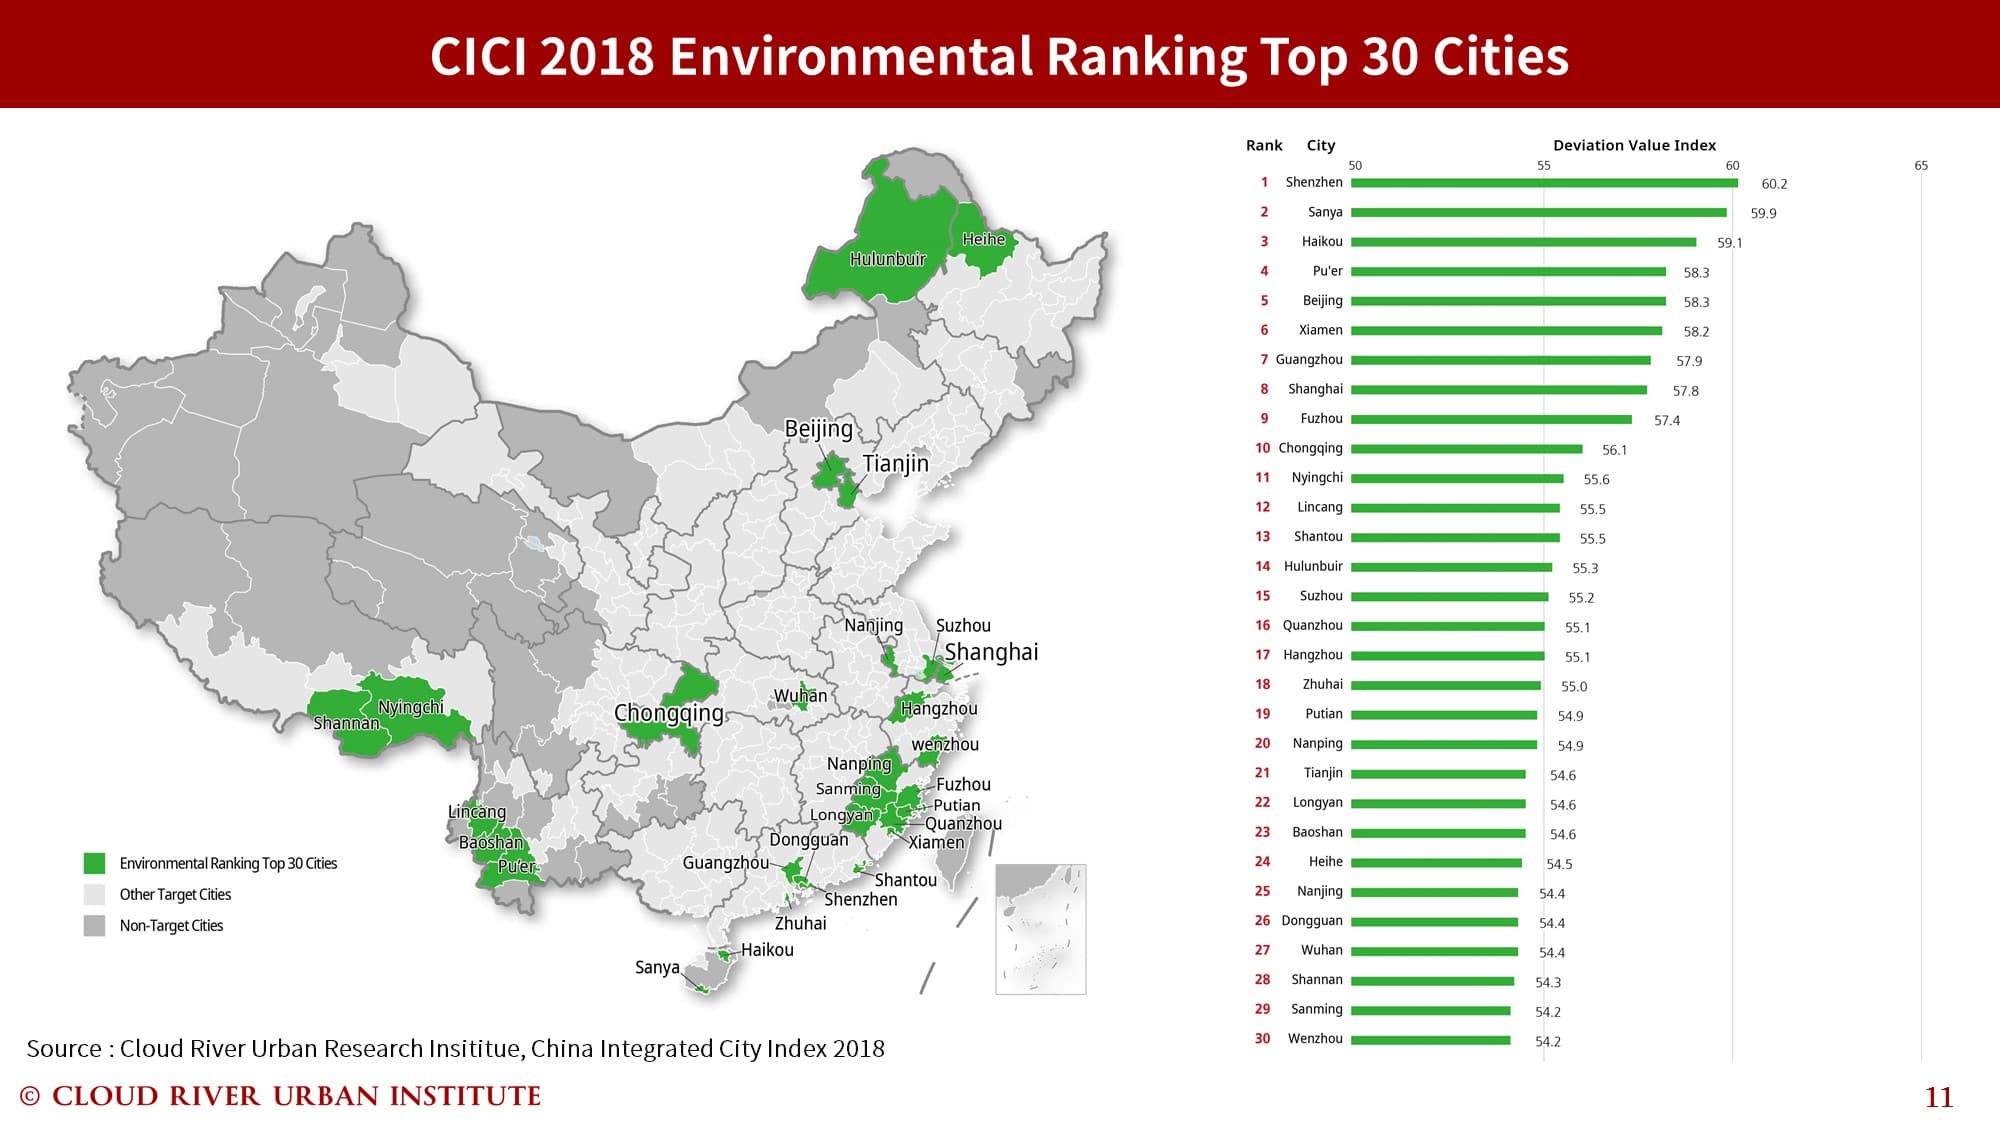
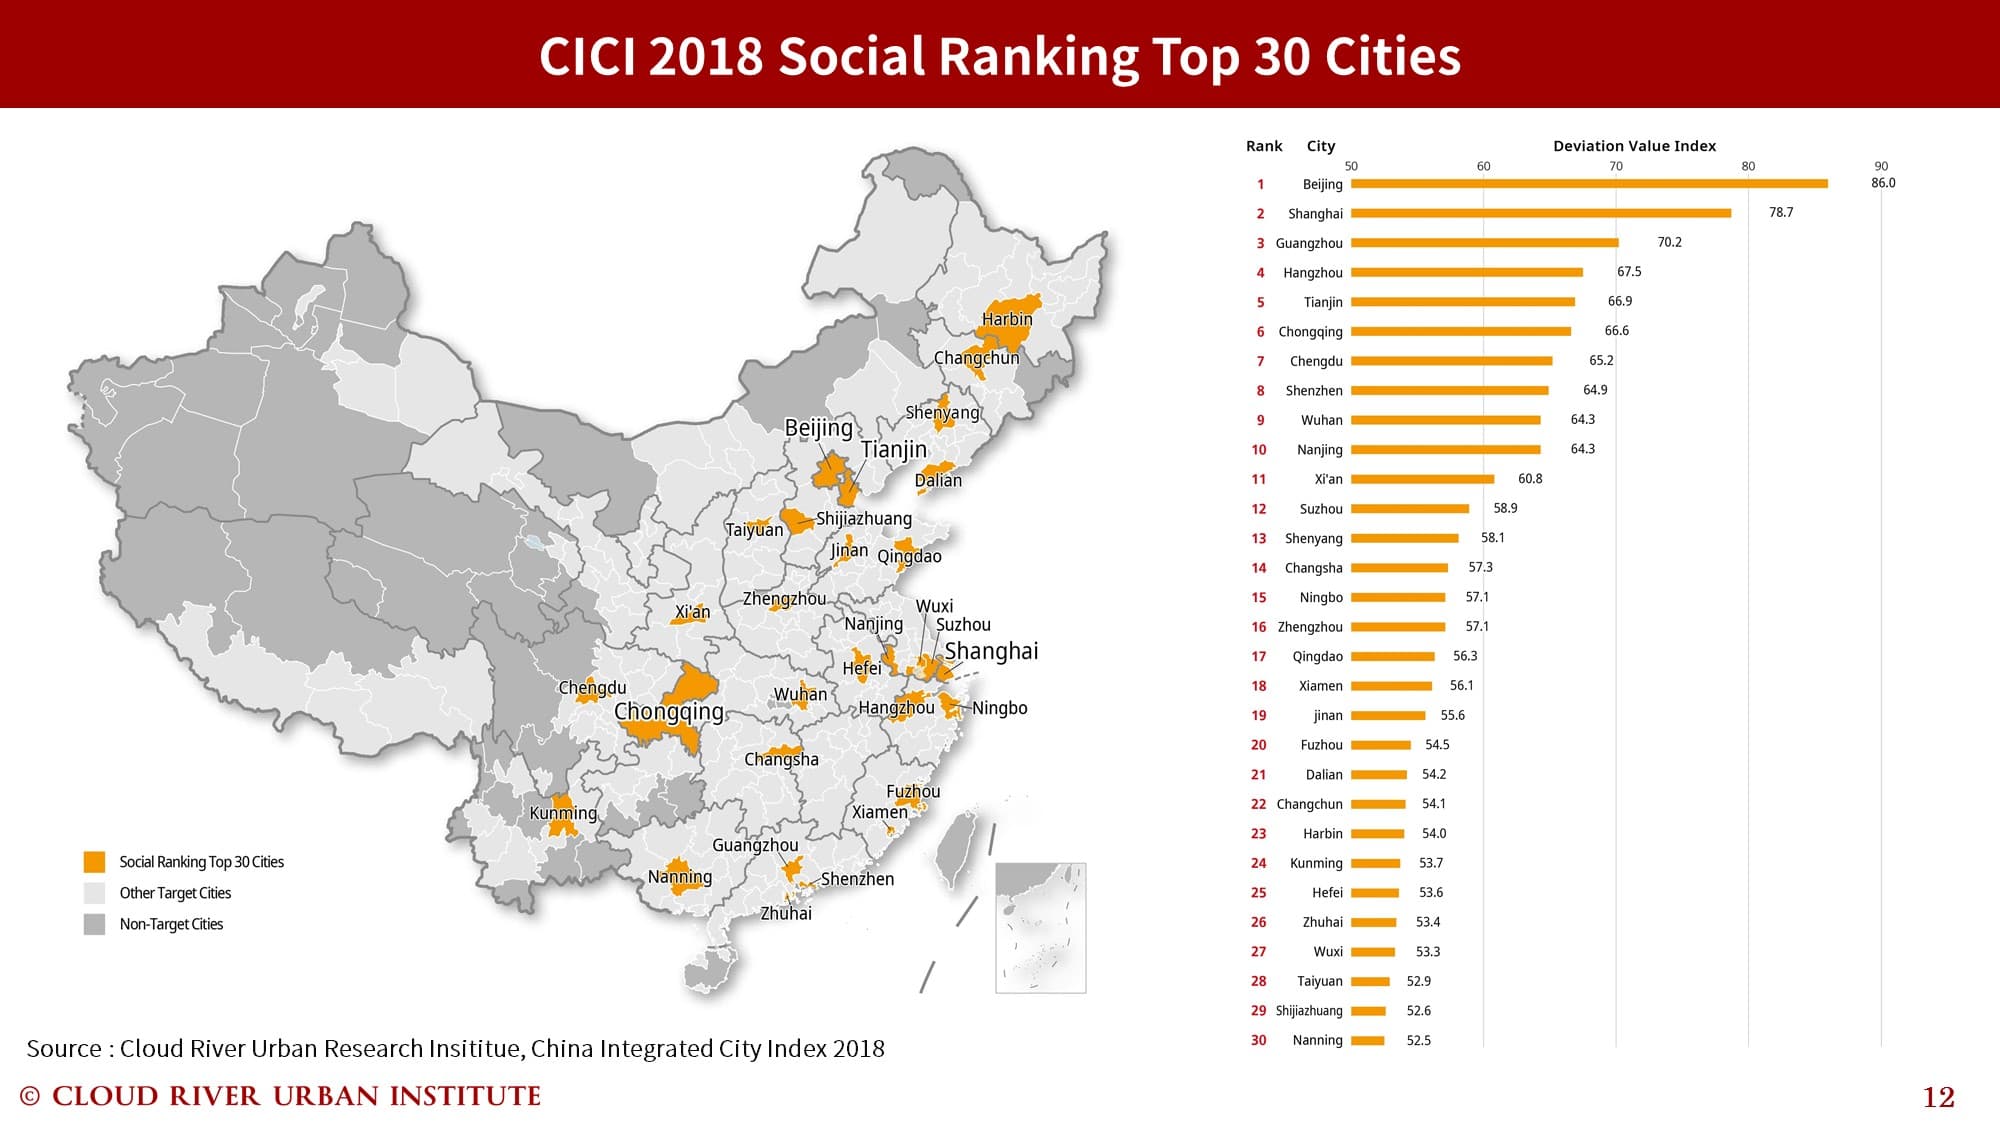
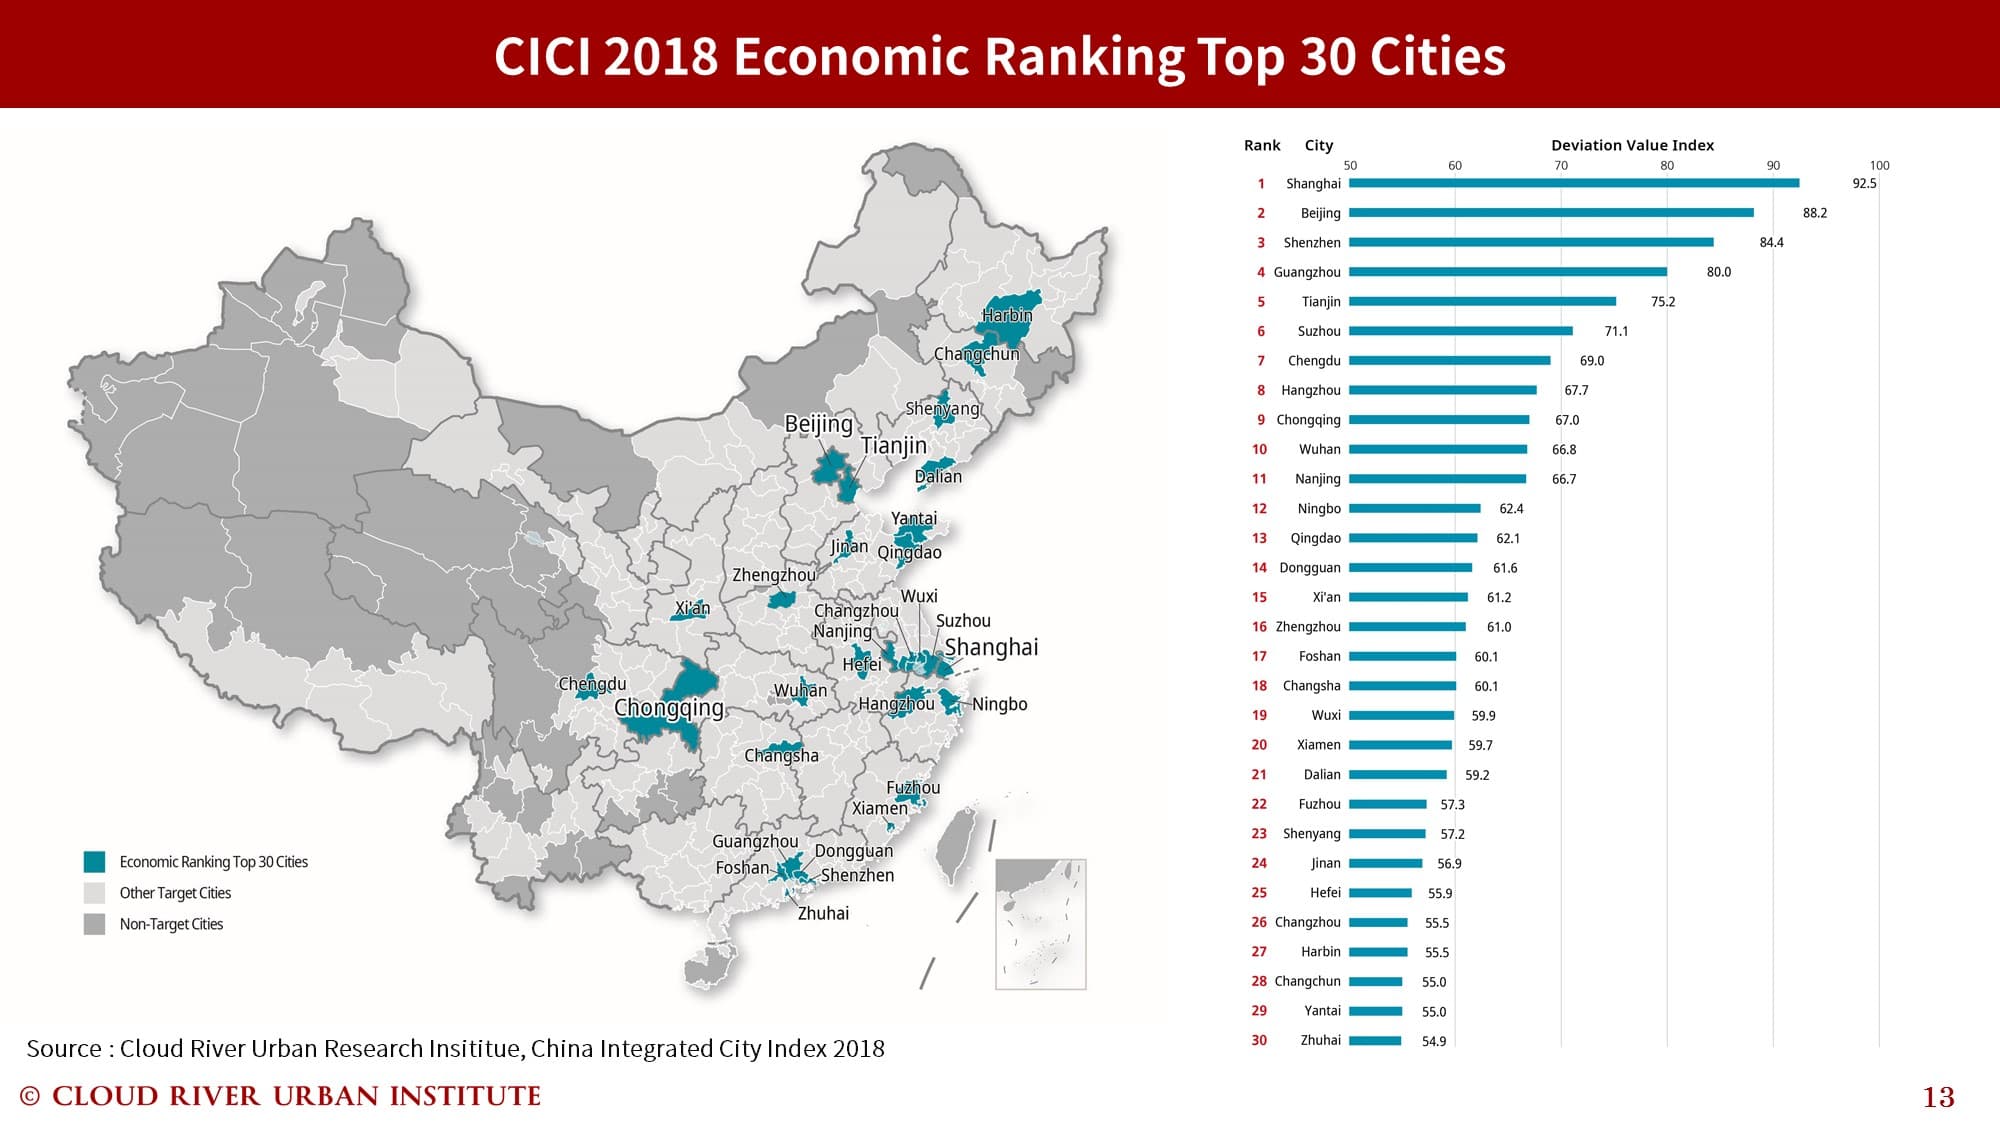
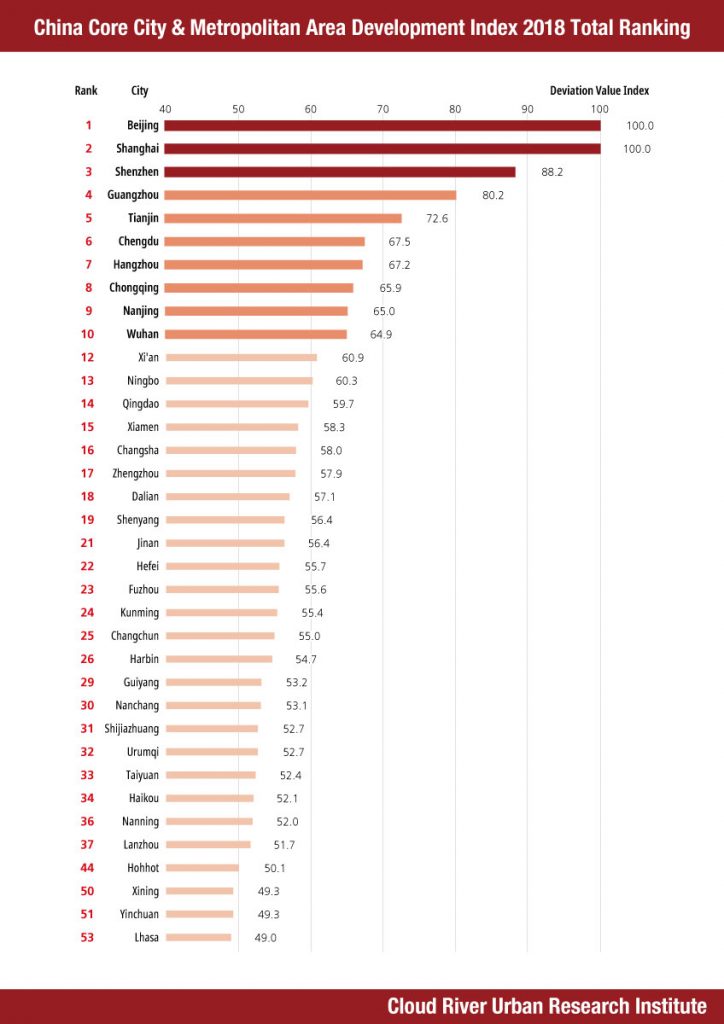
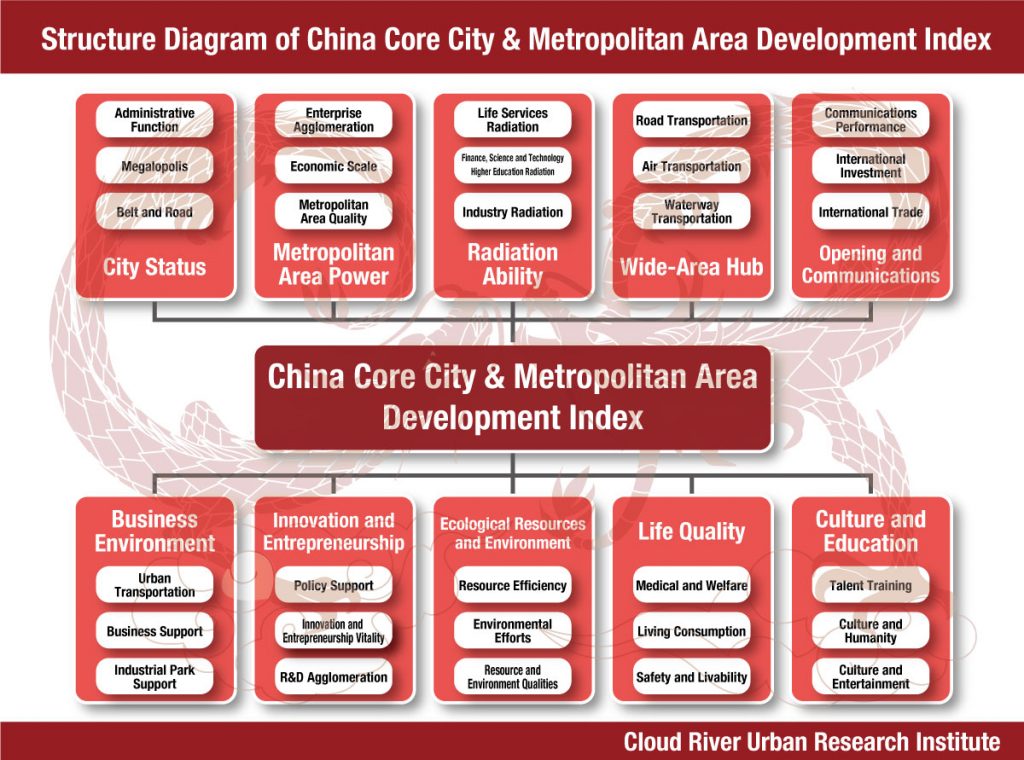
As part of the China Integrated City Index, the Cloud River Urban Research Institute has released the 2019 ranking on health care radiation based on a research of 297 cities above prefecture-level across China. The top 10 are Beijing, Shanghai, Guangzhou, Chengdu, Hangzhou, Wuhan, Jinan, Zhengzhou, Nanjing and Taiyuan. The following top 20 are Tianjin, Shenyang, Changsha, Xi’an, Kunming, Qingdao, Nanning, Changchun, Chongqing, and Shijiazhuang. And the following top 30 are Urumqi, Shenzhen, Dalian, Fuzhou, Lanzhou, Nanchang, Guiyang, Suzhou, Ningbo and Wenzhou.

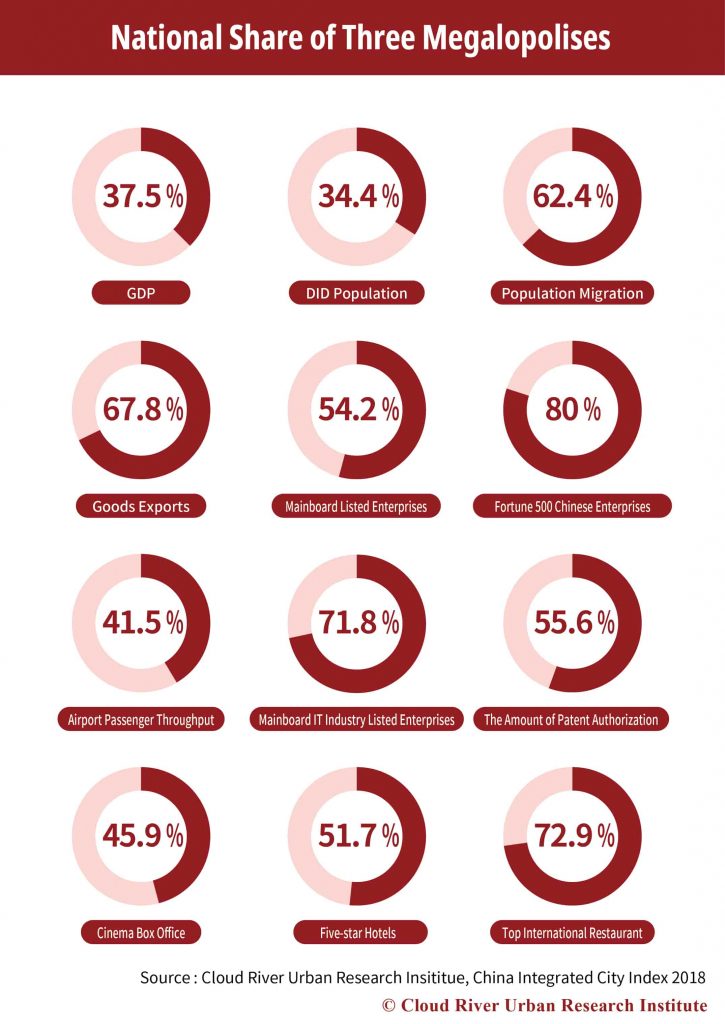
Evaluating a city’s medical care radiation mainly focuses on the number of physicians and the 3A-grade hospitals. The top 30 cities account for 15% of the certified physicians, 30% of hospital beds and 45% of 3A-grade hospitals in the country. China’s medical resources, especially the best hospitals, are mainly concentrated in cities higher in the ranking, which serve local residents as well as people from all around China.

One would doubt why cities like Wuhan, with one of the top medical resources, can be so vulnerable to the COVID-19 outbreak and even overwhelmed by the influx of patients?How cities should do to prepare for future epidemics?

A test for the health care system

Wuhan was the first to confront the COVID-19 outbreak. The city climbed one place to the sixth in the 2019 medical care radiation ranking, as it boasts 37 3A-grade hospitals, nearly 40,000 physicians, 54,000 nurses and 95,000 beds. It is hard to expect that a city with such strong health care capacity could be overwhelmed by the coronavirus epidemic.

Other metropolises like New York and Tokyo are equally vulnerable to the pandemic. It seems that the novel coronavirus is testing the medical capability of all global cities.

There are three reasons for the breakdown of the medical care system.

First, overloaded hospitals.

One feature of the COVID-19 epidemic is the exponential growth of infections. Especially during the early stage of the outbreak, the surge in infections and social panic have driven a lot of people, whether they were infected or not, to seek testing and treatment in hospitals. This has caused disorder, leaving those who are critically ill unable to receive efficient and quality care. It is also a reason for its high fatality rate. Moreover, the overcrowded emergency rooms, with confirmed cases, suspected patients as well as their families, can also lead to many hospital-acquired infections (HAI).

Italy, one of the hardest-hit countries in the pandemic, has a relatively high density of physicians, counting 4 per 1,000 people, but the country still suffers a breakdown in its health care system. In the Lombardy region, the number of infections has quickly risen from 1,000 on March 2, to over 10,000 on March 14, and to over 40,000 by the end of March. As many patients with critical conditions could not be treated in time, the fatality rate in Italy is as high as 13%. By April 15, there had been 16,000 confirmed coronavirus cases in Italy, and the death toll was 21,000.

The density of physicians in the U.S., Japan and China was only 2.6, 2.4 and 2 per 1,000 people respectively, much lower than that in Italy.

Wuhan has 4.9 physicians per 1,000 people, while the number in the New York state is 4.6 per 1,000, both higher than their national average. However, the medical care system in both places was still overstretched by the outbreak. By April 16, 83.5% of the COVID-19 deaths in China had happened in Wuhan.

Japan’s capital Tokyo has 3.3 physicians per 1,000 people, lower than the level in Wuhan and the New York State. Therefore, the Japanese government has been trying to avoid overcrowded emergency rooms as a key part of its response to COVID-19. The government advises the residents not to go to the hospital and even strictly limits testing to reduce hospitalization. Japan’s measures are so far effective to reduce the number of hospital-acquired infections and lower the fatality rate as the medical resources are mostly given to those with critical conditions. By April 15, Japans’ fatality rate had been around 2%. By April 10, deaths per 100,000 in Japan had been only 0.07, compared to 33.06 in Spain, 30.25 in Italy, 18.25 in France and 5.04 in the U.S. So far, it is fair to say that Japan has avoided collapse in the medical care system through controlling hospital visits.

However, due to the limit on testing, asymptomatic and mild cases could not be quickly identified, isolated and treated, which brings an underlying problem and casts a shadow to Japan’s COVID-19 response. After the announcement of the state of emergency, Japan adjusted its strategy and started to expand testing.

Second, a drop in the number of medical staff.

A drop in the number of medical staff caused by infections also features in the pandemic outbreaks.

In the early stage of the outbreaks, the countries lacked knowledge of the coronavirus transmission, and medical staff faced a huge risk of infection due to the shortage of protective resources such as masks, protective clothing, and negative pressure wards. Those factors made testing, sampling, intubation, and other medical practices that are inherently at risk of exposure even more dangerous. As a result, the countries have seen a significant decrease in the number of medical staff caused by infections, which exacerbated the shortage of medical staff amid the outbreaks and the scramble for medical resources.

According to the information released by the World Health Organization, data reported by 52 countries showed that 22,073 medical workers had been diagnosed with COVID-19 as of April 8. The situation turned out to be even worse. As of April 15, Spain and Italy alone saw 26,672 and 15,000 medical workers infected respectively.

Apart from the risks during the treatment, the extensive isolation and infection resulted from a dinner party of trainee doctors from Keio University Hospital dealt another major blow to the already scarce medical workforce in Tokyo.

The super-transmissible coronavirus has severely threatened the safety of medical staff and weakened medical capabilities, resulting in the collapse of the medical system.

Therefore, it is critical to protect the safety of medical workers during the fight against COVID-19.

Third, a serious shortage of hospital beds.

Since the outbreaks, the countries have experienced a shortage of medical supplies such as face masks, protective clothing, disinfectant, test kits, ventilators, extracorporeal membrane oxygenation machines, and especially, hospital beds. COVID-19 patients are required to be treated under quarantine to curb the spread of the super-transmissible coronavirus, and severe cases should be treated in intensive care units (ICUs), but general hospitals have been in serious shortage of beds.

There are up to 13.1 hospital beds per 1,000 people in Japan, the highest in the world. For Tokyo, a city with a total of 128,000 hospital beds, the figure is 9.3. Even so, it already saw a severe shortage of hospital beds.

In contrast to Tokyo, for every 1,000 people, Italy has a high number of doctors but only 3.2 beds, the U.S. has only 2.8 beds, and New York has only 2.6, even lower than the national average. Obviously, inadequate hospital beds have become a bottleneck that restricts medical institutions from receiving patients and hinders timely treatment.

The figure of China is 4.3, a quarter of that of Japan but higher than that of the U.S. and Italy. Wuhan, in particular, has 95,000 beds, or 8.6 beds per 1,000 people, almost as high as that of Tokyo, but it still suffered from a serious shortage of hospital beds in the early stage of the outbreak.

In fact, the problem is that not all hospital beds are qualified for receiving COVID-19 patients for isolation, and the scramble for medical resources has made the bed shortage even more prominent.

Wuhan rush-built the Huoshenshan Hospital and the Leishenshan Hospital for severe cases under national support. The two hospitals with high isolation levels are equipped with specialized treatment equipment, and 1,000 beds and 1,600 beds, respectively. The city also converted stadiums into 16 temporary treatment centers, and quickly provided 13,000 beds with antibacterial and epidemic prevention levels up to those of first-class hospitals in China. The move channeled mild cases, helped to concentrate high-end medical resources on severe cases, and alleviated the pressure.

The experience of Wuhan—building Huoshenshan, Leishenshan and temporary treatment centers to address bed shortage—is worthy of reference and learning for the world.

Japan now requires some confirmed patients to stay at home for quarantine due to insufficient beds, which is actually an extremely dangerous practice. First, it puts the family members of the patients at risk and may lead to infections in clusters within the families. Second, patients cannot get effective and professional treatment, and without timely update on health conditions, they may not be able to receive swift referral for treatment when the conditions deteriorate.

Therefore, Tokyo is now transforming hotels and convention and exhibition facilities into isolation wards for patients with mild symptoms, in an effort to channel mild cases and relieve the pressure on hospitals. A more serious problem in Tokyo is the shortage of ICUs. Japan has merely five ICU beds per 100,000 people, and there is a huge gap compared with the 35 in the U.S., 30 in Germany, 12 in France, 12 in Italy, and 10 in Spain. Tokyo has only 764 ICU beds, or only 5.5 per 100,000 people. To provide enough beds for severe cases is a key for Tokyo to avoid a potential collapse of the medical system.

The countries have adopted a variety of measures to address bed shortage in affected areas, with the U.S. even sending naval hospital ships to assist. In late March, U.S. President Donald Trump sent USNS Mercy and USNS Comfort hospital ships to Los Angeles and New York, respectively, offering them mobile hospitals on the sea with 1,000 high-class beds each. Though the beds are not necessarily suitable for COVID-19 patients, the hospital ships can alleviate the pressure on general hospitals in beds and leave them more space for treating COVID-19 patients by accepting a large number of patients with common diseases.

The emergency importation of a “hospital” has also become a new option. Struggling with a desperate shortage of beds amid the outbreak, South Korea imported an entire “Huoshenshan Hospital in slabs” from the Broad Group in China. The prefabricated stainless-steel slabs made up negative pressure isolation wards in South Korea. Equipped with fresh air systems and ozone technologies, the wards have the highest level of protection against cross infection. The first phase of the project took only two days locally before the wards were put into use.

From global failure to global fight

Infectious diseases used to be the biggest killer of human beings. For example, the outbreak of Black Death in Sicily in 1347 caused 25 million deaths in Europe over 20 years. The outbreak of Spanish Flu in 1918 killed 25 million to 40 million people worldwide.

With the development and popularization of antibacterial drugs and vaccines over the past hundred years, most of the infectious diseases that once did extreme harm to human health and life, such as smallpox, polio, measles, rubella, mumps, tetanus, pertussis, and diphtheria, are now eliminated or brought under control. The number of deaths from infectious diseases such as pneumonia, gastroenteritis, hepatitis, tuberculosis, and influenza has decreased dramatically in developed countries since the 1950s, and chronic diseases such as cancer, cardiovascular and cerebrovascular diseases, hypertension, and diabetes have become the main causes of death.

The success in the prevention and treatment of infectious diseases has helped to increase the average life expectancy of human beings, but the changes in the main causes of death have prompted the focus of medical systems around the world, particularly in developed countries, to shift from infectious diseases to chronic ones. As a result, countries are now investing too little in the prevention and treatment of infectious diseases, and existing medical resources are mainly concentrated on dealing with chronic diseases.

From the perspective of existing medical resources, neither the medical personnel in terms of professional background, nor the equipment, nor even the entire medical system can respond to the outbreaks in a timely and effective manner. Therefore, even metropolises with rich medical resources, such as Wuhan, New York, and Tokyo, were caught off guard and paid a heavy price in their confront with COVID-19.

Bill Gates warned the world as early as 2015 that too little investment in infectious diseases caused by viruses would lead to global failure. The scourge of COVID-19 unfortunately confirmed his prediction.

(1)Domestic and international aid

To address the shortage of medical workers and massive job cuts in Wuhan, China relies on its strong mobilization ability to send many medical workers across the country to aid Wuhan. The total number of medical workers sent to Wuhan reached 42,000, which largely alleviated Wuhan’s medical stress.

A country’s ability to aid epidemic-hit area is critical to the fight against COVID-19, but not every country has the ability. As evidenced in New York and Tokyo, even developed countries boasting rich medical resources cannot swiftly mobilize enough medical workers to aid the area hit by the epidemic.

What is more worrying is those developing countries suffering from the shortage of medical resources. Not to mention Africa, India and Indonesia in Asia, for example, have only 0.8 physicians and 0.3 physicians per 1,000 people, respectively, with 0.5 beds and 1 bed per 1,000 people, respectively. In those countries with scarce medical resources and poor national rescue capacity, hospitals will be overstretched during the outbreak, which may lead to a severe disaster. Therefore, how to organize the global rescue force is imminent. The problem is that most of the developed countries themselves are now busy responding to the pandemic,paying little heed to others. China’s medical assistance to other countries is particularly valuable at this moment.

(2)Explosive scientific progress

Measures taken by countries, such as declaring a nationwide emergency state, closing borders, city lockdown, home quarantine, and social distancing, are aimed to substantially reduce or avoid personnel exchanges, and block the spread of the virus. Although those measures have taken effect, they cannot completely wipe out the virus. Therefore, even if the pandemic is contained temporarily, the victory we have won is very fragile, and the virus may come back any time.

To secure the victory, we have to rely on the development of science and technology. Since the outbreak, the U.S. has upgraded six generations of COVID-19 test kits in 12 days, as test time has been shortened from two days to one day, then to six hours, then to 3.5 hours, then to 1.5 hours, and then to five minutes, with an accuracy rate above 95%. Cheap, rapid and accurate testing methods will make large-scale screening possible.

Convenient and simple COVID-19 antibody tests have been available in the U.S., so the U.S. government is mulling over the implementation of COVID-19 antibody tests for its entire population. At the same time, the development of wonder drugs and vaccines for COVID-19 is gearing up around the world.

The pandemic is stimulating the explosive progress of related science and technology. Only when we master the three magic weapons — detection, wonder drugs and vaccines, can we truly control and defeat the coronavirus.

Crisis is also a turning point. Each global war and crisis in modern times brought opportunities and an explosive technological revolution. World War II, for instance, promoted the development of the aviation industry, and opened the door of the nuclear industry. World War II not only gave birth to the development of the aerospace technology, but also laid the foundation for the internet technology.

The urgency of the pandemic will not only accelerate technological progress, but also expand the technological path, making unnoticed technological paths stand out. For example, Traditional Chinese Medicine is gaining global attention because of its role in the fight against COVID-19, which may possibly provide a valuable opportunity for TCM to go global.

Ozone is also a technology path that has been ignored due to prejudice. I called for attention to the disinfection efficacy of ozone in an article published on Feb. 18 and advocated the use of ozone in containing COVID-19. Experiments conducted in Japan have proved that the possibility of virus transmission through droplets in a closed environment is 18.7 times higher than that in an unclosed environment. Therefore, an important strategy of the Japanese government to deal with COVID-19 is to call on its people to avoid the confined environment, crowding and close contact. If a breakthrough can be made in the research and development of ozone sensors to control the concentration of ozone as cheaply and freely as we can control the temperature, we are hopeful to solve the problem of virus infection in indoor space and liberate people from the fear of communication by using ozone to sterilize and kill viruses in the presence of people.

The global fight against the pandemic is bound to trigger a huge leap in science and technology and push for industrial upgrade.

(3)Globalization will not end

Since the COVID-19 outbreak, all countries have been cutting off international personnel exchanges and putting cities on lockdown, and thus the globalization comes to a halt immediately. There will be no shortage of worries about the future of globalization, doubts about large-city-oriented urbanization, and even negative voices.

Indeed, with the further development of globalization, international personnel exchanges have expanded rapidly, and international trips sharply increased from 400 million 30 years ago to 1.4 billion in 2018.

Under the background of globalization, urbanization is unfolding worldwide. From 1980 to 2019, 117 cities saw their net population increase more than 2.5 million. During this period, the total net population increase of these cities was up to 630 million. It is particularly noteworthy that the number of megacities with a population of more than 10 million increased from five in 1980 to 33. Moreover, most of these megacities are the centers of international exchanges, and the metropolises that lead the world’s political and economic development. Their total population is 570 million, accounting for 15.7% of the world’s total population.

The highly dense aviation network and frequent personnel exchanges lead to the spread of COVID-19 around the world, leading to the pandemic. Many international metropolises with a large population and intensive international exchanges have become areas hard hit by the outbreak.

However, it must be clearly understood that the real reason for the global spread of the novel coronavirus is not the speed and density of international personnel exchanges, but the long-term negligence of human beings for the threat of infectious diseases.

In fact, the process of globalization has been accompanied by the threat of the spread of infectious diseases from the very beginning. From the age of great navigation to today, human beings have been playing games with infectious diseases, during which they have paid heavy costs. However, because of the big victory against infectious diseases after the Second World War, the developed countries and world organizations have tended to neglect the threat of infectious diseases for a long time.

The Global Risks Report 2020 released by the World Economic Forum, ranked 10 risks that may occur in the future 10 years, excluding the risk caused by infectious diseases. In a separate ranking, infectious diseases took the last place in the 10 risks that would affect the world most in the future 10 years.

Unfortunately, contrary to the prediction of the World Economy Forum, in the beginning of 2020, the COVID-19 pandemic dealt a big blow to the human society as a whole in an unprecedented way.

At the same time, we are happy to see that the outbreak has pushed the world to pay attention to and invest in virus-infectious diseases, which will definitely lead to an explosive technological revolution and social revolution, and will eventually overcome the threat of viral infectious diseases to human beings, and move toward the global victory.

COVID-19 will not put an end to globalization and metropolitanization, but give birth to better globalization and healthier cosmopolitans after the crisis.

Zhou Muzhi is a professor of Tokyo Keizai University and president of Cloud River Urban Research Institute.

Opinion articles reflect the views of their authors only, not necessarily those of China.org.cn.


english.scio.gov.cn丨Updated: April 21, 2020

Ozone: a powerful weapon to combat COVID-19 outbreak

Editor’s note: In the following article, Zhou Muzhi, professor of Tokyo Keizai University and president of Cloud River Urban Research Institute, expounds his views on three questions: Will the epidemic disappear suddenly? Who is behind the “God’s Hand”? What is able to prevent cross infection of the novel coronavirus?

Passengers get off an airplane at Qingdao Liuting International Airport in Qingdao, east China’s Shandong Province, Feb. 25, 2020. [Photo/Xinhua]


1. The earth’s protective shield

Since the recent outbreak of the novel coronavirus disease (COVID-19), I have been discussing with Zhang Yue, president of BROAD Group, on how to use ozone for sanitation purpose. Zhang is among one of the first advocates for ozone’s application, but has failed to draw much attention. I also notice people’s caution against or even ignorance of the ozone use from my discussion with atmospheric scientists as well as based on related research studies. Therefore, it is necessary to take a closer look at the ozone gas in order to reduce misunderstanding and even possibly promote ozone use in combating the current coronavirus outbreak.

The troposphere is the lowest layer of our atmosphere, which starts from ground level all the way extending upward to about 10 kilometers. The temperature generally decreases with the altitude. The next layer up is called the stratosphere, which extends from the top of the troposphere to about 50 kilometers above the ground, with the temperature increasening all the way up. The “infamous” ozone layer is found within the stratosphere, with a concentration of 10 to 20 ppm (parts per million). By absorbing the high-energy ultraviolet (UV) light from the Sun, the ozone layer acts as a shield for some UV damage to the cellular DNA, thus protecting the life on earth.

The time when the ozone layer reaches the current concentration almost coincides with the time when life on earth evolves from the ocean to the land. In other words, the higher level in ozone concentration may play an important role in the colonization of life on land, as a thin ozone layer could only allow for life to exist in the ocean. To put it simply, life or organisms, which formerly only existed in the ocean to shield from the harmful UV radiation, were able to migrate on shore thanks to a higher level of ozone concentration.

It is fair to say that no life can be found on the earth without the protection of the ozone layer.

The use of man-made chemicals in industrial development such as chlorofluorocarbons (CFCs) and other volatile organic compounds (VOC) is now causing extensive ozone dissociation that could weaken the human’s immune system and increase the risk of skin cancer and cataract. Thus, more attention has been given to the ozone depletion, as some even see it as a major global environmental concern no less than global warming and call for stronger protection for its proper functioning.

Ozone is a gas made up of three oxygen atoms (O3). It is created primarily by ultraviolet radiation. When high-energy ultraviolet rays strike ordinary oxygen molecules (O2), they split the molecule into two single oxygen atoms, known as atomic oxygen. A freed oxygen atom then combines with another oxygen molecule to form a molecule of ozone. As an allotrope of oxygen, the pale blue gas has a distinctively pungent smell. The word ozone comes from the Greek word OZEIN, meaning “to smell.”

High levels of ozone concentration can filter harmless UV radiation, thus acting as a shield to protect the life on the earth.

2. Angel in the sky, devil on the ground?

Ozone not only exists in the stratosphere but is also present at ground level. As oxygen molecules decrease and oxygen atoms increase with higher altitude, the high concentration of the ozone layer is found in the stratosphere while its lower concentration rests at the ground or higher above the atmosphere. That is to say, its concentration peaks at around 10 kilometers above the ground level and then drops in even higher altitude.

In the troposphere near the earth’s surface, the natural concentration of ozone is about 0.02 to 0.06 ppm, which is harmless to the human being. As the concentration level grows, it can cause discomforts to human body and may even be harmful to eyes and the respiratory system. The FDA’s maximum allowed ozone concentration in the air for residential areas is 0.05 ppm ozone by volume; the Japan Society for Occupational Health (JSOH) recommends the Occupational Exposure Limits (OELs) for ozone concentration is 0.1 ppm; while the China National Health Commission has set the safe ozone threshold as 0.1 ppm.

What really made ozone “notoriously famous” is the photochemical smog, which refers to a mixture of pollutants, including primary pollutants like nitrogen oxides (NOx) and volatile organic compounds (VOC), together with secondary pollutants ozone produced in the chemical reaction of UV ray. Although NOx and VOC are the primary source of photochemical smog, the share of ozone in the smog could reach as high as 90%. So people usually equate photochemical smog pollution with ozone pollution.

Photochemical smog not only stimulates mucosa tissues like eyes and respiratory system, it could also cause sore eyes, headaches, coughing and asthma. It could also inhibit plant growth that leads to crop failure, and even cause more hazards like acid rain and visibility reduction.

Since the industrial revolution, mass emission of NOx has led to an increase of ozone in the troposphere by 300% in the past 100 years. The rapid industrialization and urbanization in East Asia, led by China, has seen growing photochemical smog pollutants like Nox, which also accelerated increase of ozone concentration in the troposphere.

Although the concentration in the troposphere is merely a tenth of that in stratosphere, ozone is still the third largest contributor to global warming among all greenhouse gases, following carbon dioxide and methane.

All the factors above has led to a common belief that ozone is a harmful pollutant in the troposphere, and some even compare it “angel in the sky, devil on the ground.” Several developed countries including Japan has made the observation and prevention of ozone cross-border pollution in the troposphere an important research topic.

However, it should be justified that the ozone in photochemical smog is at an unnaturally high concentration due to man-made pollution, much higher than the normal concentration of ozone in the troposphere. Moreover, unlike pure ozone in nature, photochemical smog consists of a large amount of hazardous pollutants like NOx and VOC. Concentration of ozone in nature varies by season and geography, but generally does not reach levels that can harm the human health. For example, one way ozone is naturally produced is through electrical excitation of oxygen molecules in lightening. Due to ozone’s purification effect, the air is usually more refreshing after thunder and lightning. Another example would be the refreshing air in the coastlines and forest because of high ozone concentration.

Therefore, naturally produced ozone is anything but hazardous. We must recognize the difference between the naturally produced ozone and ozone in the photochemical smog, and should not blame it as a cause for environmental pollution.

Because of insufficient research and studies at this front, we often fail to recognize ozone as a protective shield in the troposphere.

Though harmless to big living creatures, ozone could pose serious threats to microorganisms. As a strong oxidizing agent, ozone has always been inhibiting microbe reproductions, while also acting as a balancing power to ecological equilibrium. Unfortunately, little attention has been given to its role in sanitation.

One reason is that low concentration of ozone was not believed to have sanitation values. According to a Japanese study, however, low concentration of ozone is still able to kill bacteria, viruses and molds, if given enough exposure. It is fair to say that ozone has balanced and inhibited the overgrowth and reproduction of microbes on earth.

Furthermore, naturally produced ozone can also decompose hazardous organics, stimulate the human’s immune system, etc. Some researches even believe that it plays a vital role in reflecting to seasonal changes and controlling body function cycles. All in all, without ozone in the troposphere, the earth would be in a entirely different state, unfit for humanity to survive.

In fact, ozone is beneficial for human and nature in both troposphere and stratosphere. It is the man-made pollution that “demonized” ozone by breaking the natural balance on earth.

3. ‘Hand of God’ conjecture: Ozone dispels epidemic?

SARS raged from the winter of 2002 to the spring of 2003, causing extreme panic in society. However, it suddenly disappeared around May and June, leaving various speculations behind. Coincidentally, most of the airborne viruses, such as the influenza virus, erupt in the autumn and the winter and disappear in the spring and the summer. It seems that there is an invisible “hand of God” driving away the epidemic and saving people.

Most researchers looked for correlations between viruses and temperature/humidity. Taking influenza virus as an example, it is generally believed that the virus can maintain its activity for a long time under the condition of low temperature and humidity, and that its activity will be inhibited as the temperature and humidity increase. However, experiments have shown that everyday temperature changes actually do not affect the virus much, but increasing humidity can effectively increase its death rate.

A hypothesis gradually emerged from the discussion with Zhang Yue: perhaps ozone with germicidal and disinfectant ability is the real “hand of God”?

The ozone concentration changes significantly with the seasons: low in autumn and winter and high in spring and summer. According to observations of the ozone layer by Japan Meteorological Agency, the total amount of ozone for Sapporo, Tsukuba, Kagoshima and Naha – Japanese localities from north to south, generally reaches a peak in February to May, but the peak in the farther north comes earlier and that in the farther south comes later.

The ozone concentration varies from region to region as well. The above observations also show a higher peak concentration in the northern regions and a lower peak concentration in the southern regions. Studies have observed that the total amount of ozone in the earth’s atmosphere changes significantly with latitude: lowest in equatorial regions and highest in northern regions near latitude 60°.

Theoretically, the stronger the ultraviolet rays, the faster the oxygen molecules disassociate. The equatorial regions, where the sun shines the most, are the most prone to producing ozone. However, many factors and complex mechanisms act on ozone concentration. The stronger the ultraviolet rays, the easier it is to either produce ozone or break it down. The rate of ozone disassociation is also related to temperature: the higher the temperature, the faster the disassociation. Earth-scale atmospheric circulation is also one of the factors that cannot be ignored, because it can transport the ozone generated locally to other regions.

The largest source of tropospheric ozone is the ozone layer in the stratosphere. The oxygen produced by plants through photosynthesis and the NOx and VOC emitted out of industrial activities also affect the concentration of tropospheric ozone.

In short, the ozone concentration, which depends on the magical disassociation and polymerization of oxygen molecules and oxygen atoms, shows a pattern of low in autumn and winter and high in spring and summer. Moreover, the higher the temperature, the faster ozone molecules break down. Humidity also matters, and the germicidal ability of ozone would decrease sharply in the dry state. Therefore, here comes the bold conjecture: when the seasons change and the weather turns warmer, the ozone concentration and air humidity would rise, and the “hand of God” would begin to dispel epidemics.

The more rigorous rationale should be that assisted by temperature and humidity, the main force – ozone drives away epidemics as its concentration rises with the seasons. Of course, ultraviolet rays, another killer of microbes, also kills outdoor bacteria and viruses.

If the conjecture is true and ozone is the “hand of God”, then the epidemic caused by novel coronavirus, like SARS and flu, should vanish as ozone levels rise over the seasons, which can be a prospect offering a ray of hope for those suffering from the outbreak.

Certainly, the bold conjecture requires careful verification, and suggestions from different perspectives are more than welcome.

4. Using ozone to kill novel coronavirus

For more than 100 years, ozone, considered a killer of virus in the nature, has been widely used by people for disinfection, sterilization, deodorization, disintoxication, storage, and bleaching thanks to its strong oxidablity.

And because of this, ozone should be adopted as a weapon in the global fight against COVID-19. It has three following attributes.

Full coverage. Ozone created by ozone generators or electrostatic air purifiers can reach every corner of the environment, which can overcome the problem that ultraviolet sterilization can only go straight up and down, leaving some places unsterilized.

High detergency. Oxidizing bacteria and virus is how ozone works, with no poisonous residue. On the contrary, the chemical disinfectant we use now is not only harmful to human body, but also will cause secondary population of poisonous residue. During the current epidemic, the overuse of disinfecting water has been a serious problem that we should pay attention to.

Convenience.Ozone can be produced by simple equipment. The equipment, large or small, can be used for a single room, a large public space, or public transportation modes such as buses, high-speed railways, ships and airplanes.

The effectiveness of ozone in treating bacteria and virus is not only related to its concentration, temperatures, humidity and exposure time, but also related to the strains of bacteria.

According to results of the experiment on how ozone kills SARS virus conducted by the national P3 laboratory headed by Professor Li Zelin, ozone is effective in killing the SARS virus inoculated on green monkey kidney cells, realizing a killing rate of 99.22%. The virus found in Wuhan and SARS virus both belong to the coronavirus. Researchers found that the novel coronavirus is 80% similar to the SARS virus in their genome sequences. It is reasonable to predict that ozone is equally effective in preventing and controlling the new coronavirus.

Ozone, though highly effective for sterilization and disinfection, will cause discomfort, or irritate mucous membranes, when it reaches a certain concentration level. Therefore, it is mainly used in unmanned environment.

If ozone can be used in a human environment to kill the new coronavirus and clean air, it will be a blessing to use it in crowded hospitals, factories, public spaces, closed public transportation, and indoor homes.

Whether ozone can take effect heavily depends on our ability to control its concentration levels. The volatile gas is easy to produce, but difficult to be controlled at a certain level, because of the cost of ozone sensors. Without the real-time test of sensors, it is out of the question to control its concentration.

If ozone can be controlled under a safe level by cheap and effective measures, ozone can be more easily used by people, which will lead to its use in human environment. Therefore, how to dramatically reduce the cost of ozone sensors is the challenge to be addressed at the moment.

Amid the epidemic, it is suggested that we can reasonably heighten standards for indoor ozone levels and try using ozone for disinfection and sterilization in human environment. Fortunately, Zhang Yue has donated ozone-generating purifiers to Huoshenshan Hospital and cubic hospitals, hoping this equipment can play a role in protecting medics’ lives and saving infected patients.

The relationship between ozone and microorganism demonstrates the exquisite balance on living bodies on earth. On the one hand, without the protection of the ozone layer, bacteria and virus cannot be found on earth, and on the other hand, ozone with strong oxidablity will kill bacteria and virus. People’s knowledge of ozone is still far from enough. We should abandon the prejudice of ozone, the over vigilance of ozone, try to solve the puzzle of ozone, and fully explore the characteristics of ozone for human use. We must secure the help of ozone at the time of the new coronavirus epidemic. We must work together to make good use of ozone to defeat the epidemic.

Zhou Muzhi is a professor of Tokyo Keizai University and president of Cloud River Urban Research Institute.

China.org.cn,  February 26, 2020


‘Polarization of driving forces’ becomes a big trend for China’s urban development

The spatial structure of China’s economic growth is undergoing profound changes, with urban development showing obvious signs of “concentration” and “divergence.” Various functions are increasingly concentrated in leading cities. The more advanced the function is, the higher the concentration becomes. Meanwhile, the divergence between cities is constantly growing, meaning an increasing “polarization of driving forces.”

Cloud River Urban Research Institute, a think tank specializing in urbanization research, published 12 sets of data regarding top 30 Chinese cities in different rankings in a report titled “China Integrated City Index 2018.” The institute looked at the “polarization of driving forces” by analyzing the performance of 298 cities at the prefecture level and above based on major indicators and the concentration of functions.


1. Top 30 Cities by GDP

The 10 Chinese cities with the best performance in terms of GDP, namely Shanghai, Beijing, Shenzhen, Guangzhou, Chongqing, Tianjin, Suzhou, Chengdu, Wuhan and Hangzhou, account for 23.6% of the country’s total GDP. The top 30 cities by GDP make up 43.5% of the total. In other words, the richest 10% of the 298 cities create more than 40% of the national GDP, and China’s economic growth relies heavily on the top 30 cities.

2. Top 30 Cities by DID Population

Population density is a key indicator for the assessment of urban development. The China Integrated City Index introduced the concept of densely inhabited district (DID) to make an accurate and effective measurement of population density. The concept of DID refers to districts with a population density of more than 5,000 inhabitants per square kilometer.

The top 10 cities by DID population, namely Shanghai, Beijing, Guangzhou, Shenzhen, Tianjin, Chongqing, Chengdu, Wuhan, Dongguan and Wenzhou, account for 22.8% of the country’s total DID population. The top 30 cities make up for 43.2% of the total. In other words, more than 40% of China’s DID population is concentrated in the most populous 10% of the 298 cities.

It is more noteworthy that the GDP of the 298 cities is highly correlated with their DID population, with a correlation coefficient of 0.93, meaning a “complete correlation.” Furthermore, 26 out of the top 30 cities by GDP are also on the list of the top 30 by DID population (in different positions). All these highlight the importance of DID population. Therefore, Chinese cities need to pay close attention to DID quality and scale.

3. Top 30 Cities with Most Main Board Listed Companies

As to the number of listed companies on the main boards of the Shanghai, Shenzhen and Hong Kong stock markets, enterprises from the top 30 cities account for 69.7% of the country’s total, among which 39.6% are located in the top three cities, namely Shanghai, Beijing and Shenzhen. In other words, the top 10% of the 298 cities are home to nearly 70% of all the Chinese companies listed on the main board.

Main-board listed companies are more and more concentrated in large cities, especially core cities.

4. Top 30 Cities with Most Fortune 500 Chinese Companies

In 1989, China had only three companies listed among the Fortune Global 500. In 2018, the number of Chinese companies on the list reached 105, second only to the 126 of the U.S. In particular, three Chinese companies took spots in the top 10.

Chinese companies on the Fortune Global 500 list are located in 28 cities, while 66.7% are concentrated in Beijing, Shanghai and Shenzhen. Compared with ordinary main-board listed companies, Fortune Global 500 Chinese Companies are more concentrated in the national core cities.

An analysis of the top 30 cities with most main board listed companies and top 30 with most Fortune Global 500 Chinese companies shows that the headquarters of the most outstanding Chinese companies, which serve as the central management in the economy, are highly concentrated in core cities represented by Beijing, Shanghai and Shenzhen.

5. Top 30 Cities by Manufacturing Radiation

As to the manufacturing radiation, Shenzhen, Shanghai and Dongguan are followed by Suzhou, Foshan, Guangzhou, Ningbo, Tianjin, Hangzhou and Xiamen to round up the top 10. The 10 cities, all with easy access to large container ports, account for 48.2% of the country’s total exports of goods. The top 30 cities make up 74.9% of the total. In other words, top 10% of the 298 cities contributed to three quarters of the country’s goods exports.

6. Top 30 Cities by IT Industry Radiation

When it comes to the IT industry radiation, the cities occupying the top 10 places are Beijing, Shanghai, Shenzhen, Chengdu, Hangzhou, Nanjing, Guangzhou, Fuzhou, Jinan and Xi’an. The 10 cities account for 52.8%, 76.1%, 60% and 81% of the country’s total jobs created by IT industry, IT companies listed on the main board, small and medium-sized enterprises board and growth enterprises market board. The top 30 cities make up 68%, 94%, 78.2% and 91.2% in the above four categories. It is obvious that China’s IT industry is highly concentrated in the leading cities of the ranking.

Most Chinese cities are developing IT as a key industry. However, China’s IT industry, as a matter of fact, is highly concentrated in such cities as Beijing, Shanghai, Shenzhen, Chengdu, Hangzhou, Nanjing and Guangzhou. Compared with manufacturing, IT is far more concentrated and converged in certain cities. In this sense, the cities seeking to develop the IT industry need to carefully study and analyze the necessary requirements.

7. Top 30 Cities by Higher Education Radiation

As to the higher education radiation, Beijing, Shanghai, Wuhan are the top three cities, followed by Nanjing, Xi’an, Guangzhou, Changsha, Chengdu, Tianjin and Harbin. The 10 cities account for 69.3% of universities listed in Project 211 and Project 985, and 26.0% of all the students studying in regular universities. The top 30 cities make up 92.8% and 57.1% respectively. China’s higher education resources, especially high quality ones, are highly concentrated in the leading cities of the ranking.

8. Top 30 Cities by Science and Technology Radiation

As to the science and technology radiation, the cities ranking the top 10 are Beijing, Shanghai, Shenzhen, Chengdu, Guangzhou, Hangzhou, Xi’an, Tianjin, Suzhou and Nanjing. These 10 cities account for 36.3% and 33.2% of the country’s human resources in R&D, and patent licenses. The top 30 cities make up 59.8% and 62.6% of the total respectively. It is noticeable that China’s science and technology resources are highly concentrated in the leading cities of the ranking.

It is particularly noteworthy that the top 30 cities also boast higher R&D and commercialization efficiency than other cities.

9. Top 30 Cities by Culture, Sports and Entertainment Radiation

The top 10 cities by culture, sports and entertainment radiation are Beijing, Shanghai, Chengdu, Guangzhou, Shenzhen, Wuhan, Hangzhou, Nanjing, Xi’an and Zhengzhou, which take up 34% of national total box office, and 30.6% of movie and theater attendance, while the top 30 cities account for 57.7% and 54.6% of the national total respectively.

The number represents increasing concentration of resources and consumption in culture, sports and entertainment in top ranking cities.

10. Top 30 Cities Catering and Hotel Radiation

Shanghai, Beijing and Chengdu top the catering and hotel radiation ranking, and are followed by Guangzhou, Shenzhen, Hangzhou, Suzhou, Sanya, Xi’an and Xiamen. The top 10 in total house 35.7% and 77.1% of China’s five-star hotels and international luxury restaurants, while the top 30 altogether take 61.1% and 91.8% of the country’s total. Therefore, this also represents a high concentration of luxury restaurants and hotels in higher ranking cities.

Based on studies of the China Integrated City Index 2018, Cloud River Research Institute also found very high correlations between IT industry radiation and catering and hotel radiation, with correlation coefficient at 0.9. This may be explained by the fact that communications among high-income and broad-minded IT professionals are often found at dinner tables.

It may be no coincidence that the top seven cities by IT industry radiation, namely Beijing, Shanghai, Shenzhen, Chengdu, Hangzhou, Nanjing and Guangzhou, are also famous for their food culture, which undoubtedly could contribute to the people’s communications and exchanges.

On the contrary, there is only a 0.68 correlation coefficient between the manufacturing radiation ranking and the catering and hotel radiation ranking, showing smaller gourmet appeal to people in the manufacturing sector compared to those in the IT sector.

11. Top 30 Cities by Container Port Convenience

The top 10 cities by container port convenience, i.e. Shanghai, Shenzhen, Ningbo, Guangzhou, Qingdao, Tianjin, Xiamen, Dalian, Suzhou and Yingkou, altogether account for 82% of the country’s overall container throughput, while the top 30 take 97.8%. In other words, almost all of the country’s container throughput are handled by the top 10% in the port convenience ranking.

Drawing on research findings of 298 cities at prefecture level and above from China Integrated City Index 2018, Cloud River Research Institute also found high correlations between the city’s export volume in goods and the container port throughput, with correlation coefficient at 0.81. Moreover, 24 of the top 30 cities by manufacturing radiation are also among the top 30 cities by container port convenience. This shows that the manufacturing industry, especially those involved in exporting trade, depends heavily on the port environment. In this sense, China’s export-oriented manufacturing is expected to be increasingly concentrated in well-established port cities.

In view of the high correlations between industrial development and port environment, China needs to learn lessons from the inefficient and decentralized industrial development in the past, and explore new ways for high-quality development in the future.

12. Top 30 Cities by Airport Convenience

The top 10 cities by airport convenience, i.e. Shanghai, Beijing, Guangzhou, Shenzhen, Chengdu, Kunming, Chongqing, Hangzhou, Xi’an and Xiamen, account for a combined 49.9% of the country’s total passenger throughput and 73.5% the cargo throughput, while the top 30 cities took 81.3% and 92.9% respectively. Therefore, the big majority of China’s passenger and logistic flows is highly concentrated in the top 10% cities by airport convenience.

Again, the institute found a high correlation between a city’s IT industry radiation and airport convenience, with correlation coefficient at 0.82. Moreover, 21 cities among the top 30 cities by the IT industry radiation were also among the top 30 cities by airport convenience. This shows that the development of the IT industry hinges much on highly efficient airport facilities, and the industry is expected to further cluster into cities with more convenient airport networks.


Today, China’s GDP, DID population and various other functions are increasingly concentrated in a handful of big cities, megacities, as well as megalopolises, and the trend is getting stronger. Therefore, improving the economic and space structure of these big cities, megacities and megalopolises is key to China’s high-quality development.


english.scio.gov.cn丨Updated: January 6, 2020

China’s three major megalopolises compared

China’s rapid economic growth is the result of the combination of the world’s economic landscape shift and the huge potential unleashed by China’s reform and opening up. The Pearl River Delta, the Yangtze River Delta Megalopolis and Beijing-Tianjin-Hebei Megalopolis have become the driving force for China’s economic development, as well as China’s most international and typical megalopolises. The three megalopolises play a key role against the backdrop of the China-U.S. trade frictions and China’s economic restructure.

Cloud River Urban Research Institute, a leading think tank for city planning, draws on the 12 sets of data released by the China Integrated City Index 2018 to analyze the performance of the three megalopolises.


1. GDP

The three megalopolises carry increased weight to China’s economy, as they account for 8.6%, 19.8% and 9.0% of the national GDP, respectively, which means 37.4% combined. The three megalopolises are obviously the pillar of China’s economy.

The performance of the three major megalopolises can be measured by observing the top 30 cities among the nation’s 298 cities at prefecture level and above in terms of GDP.

The Beijing-Tianjin-Hebei Megalopolis has two cities whose GDP features in the top 30–Beijing in second place, and Tianjin in sixth.

The Pearl River Delta Megalopolis has nine cities whose GDP making the top 30, including Shanghai in first place, Suzhou in seventh, Hangzhou in 10th, Nanjing in 11th, Wuxi in 13th, Ningbo in 15h, Nantong in 19th, Hefei in 25th, Changzhou in 28th.

The Pearl River Delta Megalopolis has four cities whose GDP ranked in the top 30. They are Shenzhen in third, Guangzhou in fourth, Foshan in 17th and Dongguan in 21st.

The three megalopolises dominate the rankings with 15 in the top 30.

2. DID Population

Population density is crucial to city issues. The China City Integrated Development Index uses the index of DID (Densely Inhabited District) – districts with a population density of more than 5,000 inhabitants per square kilometer, to analyze population density.

The three megalopolises account for 34.4% of the country’s total DID population. The Beijing-Tianjin-Hebei Megalopolis accounts for 7.9% of the national DID population, the Yangtze River Delta Megalopolis 17.1%, and the Pearl River Delta Megalopolis 9.3%.

The performance of the three major megalopolises can be measured through observing the top 30 cities among the nation’s 298 cities at prefecture level and above in terms of DID population. The Beijing-Tianjin-Hebei Megalopolis has two cities ranked in the top 30–Beijing in second, and Tianjin in fifth.

The Yangtze River Delta Megalopolis has seven cities whose DID ranked in the top 30. They are Shanghai in first, Suzhou in 11th, Hangzhou 13th, Nanjing in 14th, Ningbo in 20th, Hefei in 25th, and Wuxi in 28th.

The Pearl River Delta Megalopolis has four cities whose DID population ranked in the top 30. They are Guangzhou in third, Shenzhen in fourth, Dongguan in ninth, and Foshan in 15th.

There are a total of 13 cities in the three megalopolises making the list of the top 30 cities with largest DID population. However, DID population ratios vary among the three megalopolises, with the Pearl River Delta Megalopolis at 67%, much higher than the national average of 31.9%, the Yangtze River Delta Megalopolis 46.6%, while the Beijing-Tianjin-Hebei Megalopolis only 37.8%.

3. Companies Listed on Main Boards

The three megalopolises are home to more than half of the companies listed on the main boards in Shanghai, Shenzhen and Hong Kong, with the Beijing-Tianjin-Hebei Megalopolis accounting for 15.9%, the Yangtze River Delta Megalopolis 28%, and the Pearl River Delta Megalopolis 10.3%, meaning 54.2% combined.

The three major megalopolises can be gauged by the performance of the top 30 cities among the nation’s 298 cities at prefecture level and above in terms of the number of companies listed on the main boards.

The Yangtze River Delta Megalopolis has seven cities in the top 30 cities with the most companies listed on the main boards. They are Shanghai in first place, Nanjing and Hangzhou in forth, Ningbo in ninth, Hefei in 13th, Suzhou in 21st, and Wuxi in 24th.

The Pearl River Delta Megalopolis has only two cities in the top 30, including Shenzhen in third place, Guangzhou in seventh. The megalopolis’s Dongguan and Foshan, who are well known for manufacturing, are still powered by the “factory economy.”

The three megalopolises have 11 cities making it to the list of the top 30 cities with the most companies listed on the main boards. In particular, Shanghai, Beijing and Shenzhen together are home to 31.3% of the country’s main-board-listed companies.

4. Chinese Enterprises in Fortune 500

The three megalopolises are home to 80% of the country’s Chinese enterprises entering the Fortune Global 500 list, with the Beijing-Tianjin-Hebei Megalopolis 54.3%, the Yangtze River Delta Megalopolis 14.3%, and the Pearl River Delta Megalopolis 11.4%.

The performance of the three regions can be measured by observing the top 30 cities among China’s 298 cities at prefecture level and above in terms of the number of Chinese companies on the Fortune Global 500 list.

Three cities in the Beijing-Tianjin-Hebei Megalopolis make the top 30, including Beijing coming first, and Tianjin and Shijiazhuang in 11th.

Four cities in the Yangtze River Delta Megalopolis make it into the top 30, including Shanghai in second place, Hangzhou in fourth, and Nanjing and Suzhou in seventh.

The Pearl River Delta Megalopolis has three cities in the top 30, including Shenzhen in third, Guangzhou in fourth, and Foshan in seventh.

The three regions have a total of 10 cities making the top 30. Beijing tops the list, as it has 52.4% of Fortune 500 Chinese companies.

5. Manufacturing Radiation

The three major megalopolises account for 67.8% of China’s exports in goods, with the Beijing-Tianjin-Hebei Megalopolis making up 6.2%, the Yangtze River Delta Megalopolis 32.7%, and the Pearl River Delta Megalopolis 28.8%. The three megalopolises, especially the Yangtze River Delta Megalopolis and the Pearl River Delta, serve as a powerhouse of China’s export, and are dubbed the “factory of the world.”

Radiation is the index used to measure to what extent a city’s certain function can be leveraged by others.

The China City Integrated Development Index draws on the radiation index to accurately and effectively analyze service capabilities of a city’s industries.

The performance of the three major megalopolises can be gauged through observing the top 30 cities among the nation’s 298 cities at prefecture level and above in terms of the number of Chinese companies making the Fortune Global 500 list.

Eleven cities in the Yangtze River Delta Megalopolis make it into the top 30,including Shanghai in second place, Suzhou in fourth, Ningbo in seventh, Hangzhou in ninth, Wuxi in 14th, Jiaxing in 20th, Nanjing in 21st, Jinhua in 23rd, Shaoxing in 24th, Changzhou in 26th, and Nantong in 29th.

Eight cities in the Pearl River Delta Megalopolis make it into the top 30, including Shenzhen in first place, Dongguan in third, Foshan in fifth, Guangzhou in sixth, Huizhou in 11th, Zhongshan in 13th, Zhuhai in 19th, and Jiangmen in 30th.

Twenty-one cities in the three regions make the top 30. From 2000 to 2018, China’s exports increased by tenfold to become the biggest exporter in the world. The three megalopolises have proven to be the biggest winner in the explosion of communication economy created by the global expansion of the manufacturing supplier chain.

6.  IT Industry Radiation

The three megalopolises house 71.8% of China’s IT companies listed on the main boards, and 50.7% of China’s IT workers.

The Beijing-Tianjin-Hebei Megalopolis accounts for 32.5% of the national IT companies listed on the main boards, the Yangtze River Delta Megalopolis 24.8%, and the Pearl River Delta Megalopolis 14.5%.

The Beijing-Tianjin-Hebei Megalopolis accounts for 20.9% of the nation’s IT workers, the Yangtze River Delta Megalopolis 19.5%, and the Pearl River Delta Megalopolis 10.2%.

The performance of the three megalopolises can be measured by the top 30 cities among the nation’s 298 cities at prefecture level and above in terms of the IT industry radiation.

Beijing in the Beijing-Tianjin-Hebei Megalopolis takes the first spot in the top 30 cities.

Six cities in the Yangtze River Delta Megalopolis make it into the top 30, including Shanghai in second, Hangzhou in fifth, Nanjing in sixth, Suzhou in 15th, Hefei in 21st, and Wuxi in 24th.

Three cities in the Pearl River Delta Megalopolis make the top 30, including Shenzhen in third, Guangzhou in seventh, and Zhuhai in 20th.

The three megalopolises have 10 cities in the top 30. It is noteworthy that many cities with strong manufacturing radiation fail to make it into the top 30 cities with strongest IT industry radiation.

7.  Higher Education Radiation

The three major megalopolises are home to 51.6% of the country’s top universities, and 28.2% of the students attending universities and colleges.

The Beijing-Tianjin-Hebei Megalopolis is home to 26.8% of the nation’s top universities, the Yangtze River Delta Megalopolis 20.9%, and the Pearl River Delta Megalopolis 3.9%.

The Beijing-Tianjin-Hebei Megalopolis has 8.3% of the nation’s students attending universities and colleges, the Yangtze River Delta Megalopolis 14.0% and the Pearl River Delta Megalopolis 5.9%.

The performance of the three megalopolises can be measured by observing the top 30 cities among China’s 298 cities at prefecture and above in terms of the radiaiton of higher education.

The Yangtze River Delta Megalopolis has five cities in the top 30, including Shanghai in second place, Nanjing in fourth, Hefei in 12th, Hangzhou in 14th, and Suzhou in 30th.

The Pearl River Delta Megalopolis only has Guangzhou in the top 30.

The three megalopolises have nine cities in the top 30. The Pearl River Delta Megalopolis has relatively weak radiaiton of higher education.

8. Science and Technology Radiation

The three megalopolises have 53.3% of the country’s R&D human resources, and 55.6% of the country’s patent licenses.

The Beijing-Tianjin-Hebei Megalopolis makes up 12.2% of the national R&D human resources, the Yangtze River Delta Megalopolis 28.5%, and the Pearl River Delta Megalopolis 12.7%.

The Beijing-Tianjin-Hebei Megalopolis makes up 10.3% of the national patent licenses, the Yangtze River Delta Megalopolis 30.9%, and the Pearl River Delta Megalopolis 14.4%.

The performance of the three megalopolises can be gauged by observing the top 30 cities among the nation’s 298 cities at prefecture level and above in terms of the radiation of science and technology.

The Beijing-Tianjin-Hebei Megalopolis has two cities making it into the top 30, including Beijing in first place, and Tianjin in eighth.

The Yangtze River Delta Megalopolis has 11 cities in the top 30, including Shanghai in second place, Hangzhou in sixth, Suzhou in ninth, Nanjing in 10th, Ningbo in 12th, Wuxi in 14th, Hefei in 17th, Shaoxing in 20th, Nantong in 21st, Jiaxing in 27th, and Changzhou in 30th.

The Pearl River Delta Megalopolis has five cities in the top 30, including Shenzhen in third place, Guangzhou in fifth, Foshan in 16th, Dongguan in 18th, and Zhongshan in 24th.

A total of 18 cities in the three megalopolises make the top 30.

9. Culture, Sports and Entertainment Radiation

The three megalopolises account for 45.9% of the national box office, and 43.3% of nation’s movie and theater attendance.

The Beijing-Tianjin-Hebei Megalopolis accounts for 9.6% of the national box office, the Yangtze River Delta Megalopolis 23.6%, and the Pearl River Delta Megalopolis 12.8%.

The Beijing-Tianjin-Hebei Megalopolis accounts for 8.5% of the national movie and theater attendance, the Yangtze River Delta Megalopolis 22.8%, and the Pearl River Delta Megalopolis 11.9%.

The performance of the three megalopolises can be gauged by observing the top 30 cities among the nation’s cities at prefecture level and above in terms of the radiation of culture, sports and entertainment.

The Beijing-Tianjin-Hebei Megalopolis has two cities in the top 30, including Beijing in first place, and Tianjin in 13th.

The Yangtze River Delta Megalopolis has 11 cities in the top 30, including Shanghai in second place, Hangzhou in seventh, Nanjing in eighth, Suzhou in 14th, Hefei in 17th, Ningbo in 25th, and Wuxi in 26th.

The Pearl River Delta Megalopolis has four cities in the top 30, including Guangzhou in fourth, Shenzhen in fifth, Dongguan in 20th, and Foshan in 23rd.

The three megalopolises have 13 cities in the top 30.

10.  Catering and Hotel Radiation

The three megalopolises are home to China’s 51.7% five-star hotels and 72.9% of China’s top-notch restaurants.

The Beijing-Tianjin-Hebei Megalopolis has 11.4% of the country’s five-star hotels, the Yangtze River Delta Megalopolis 29.5%, and the Pearl River Delta Megalopolis 10.9%.

The Beijing-Tianjin-Hebei Megalopolis has 20.0% of the country’s top-notch restaurants, the Yangtze River Delta Megalopolis 37.5%, and the Pearl River Delta Megalopolis 15.4%.

The performance of the three megalopolises can be gauged by observing the top 30 cities among the nation’s cities at prefecture level and above in terms of the catering and hotel radiation.

The Beijing-Tianjin-Hebei Megalopolis has two cities in the top 30, including Beijing in second place, and Tianjin in 16th.

The Yangtze River Delta Megalopolis has eight cities in the top 30, including Shanghai in first place, Hangzhou in sixth, Suzhou in seventh, Nanjing in 11th, Ningbo in 14th, Zhoushan in 18th, Wuxi in 26th, and Hefei in 29th.

The Pearl River Delta Megalopolis has four cities in the top 30, including Guangzhou in fourth, Shenzhen in fifth, Zhuhai in 20th, and Dongguan in 27th.

A total of 14 cities in the three megalopolises make the top 30.

11.  Convenience of Container Port

The three megalopolises account for 69.5% of the country’s total container throughput, with the Beijing-Tianjin-Hebei Megalopolis 8.3%, the Yangtze River Delta Megalopolis 35.2% and the Pearl River Delta Megalopolis 26%, respectively.

The performance of the three megalopolises can be gauged by observing the top 30 cities among the nation’s cities at prefecture level and above in terms of port convenience.

The Beijing-Tianjin-Hebei Megalopolis has two cities in the top 30, including Tianjin in sixth place, and Tangshan in 28th.

The Yangtze River Delta Megalopolis dominates the rankings with 11 cities in the top 30, including Shanghai in first place, Ningbo in third, Suzhou in ninth, Zhoushan in 12th, Nanjing in 15th, Nantong in 17th, Jiaxing in 20th, Wuxi in 23rd, Huzhou in 26th, Changzhou in 29th, and Shaoxing in 30th.

The Pearl River Delta Megalopolis has eight cities in the top 30, including Shenzhen in second place, Guangzhou in fourth, Dongguan in 13th, Foshan in 14th, Zhongshan in 18th, Zhuhai in 21st, Jiangmen in 25th, and Huizhou in 27th.

It turns out that the three megalopolises have 21 of the top 30 cities by container port convenience that bolster the development of the three megalopolises, especially the development of manufacturing.

12. Airport Convenience

The three megalopolises account for 41.5% of the country’s passenger throughput, and 67.8% of the country’s cargo traffic.

The Beijing-Tianjin-Hebei Megalopolis accounts for 11.9% of the country’s passenger throughput, the Yangtze River Delta Megalopolis 18.7% and the Pearl River Delta Megalopolis 10.9%.

The Beijing-Tianjin-Hebei Megalopolis accounts for 14.7% of the country’s cargo traffic, the Yangtze River Delta Megalopolis 34.6% and the Pearl River Delta Megalopolis 18.5%.

The performance of the three megalopolises can be measured by observing the top 30 cities among the nation’s 298 cities at prefecture level and above in terms of airport convenience.

The Beijing-Tianjin-Hebei Megalopolis has three cities that make it into the list of the top 30 cities with the most airport convenience–Shanghai ranked first, Hangzhou ranked eighth, and Nanjing ranked 12th.

The Pearl River Delta Megalopolis has three cities in the top 30 cities with the most airport convenience–Guangzhou ranked third, Shenzhen ranked fourth, and Zhuhai ranked 27th.

Eight cities in the three megalopoliss make it into the top 30. In particular, the international aviation hubs in Beijing, Shanghai, Guangzhou and Shenzhen make the three megalopolises the areas best served by air transport, and bolster the communication economy for megalopolises.


Cities in the three megalopolises

Ten cities in the Beijing-Tianjin-Hebei Megalopolis: Beijing, Tianjin, Shijiazhuang, Baoding, Tangshan, Qinghuangdao,

Twenty-six cities in the Yangtze River Delta: Shanghai, Nanjing, Hangzhou, Suzhou, Hefei, Wuxi, Ningbo, Changzhou, Jiaxing, Nantong, Yancheng, Yangzhou, Zhengjiang, Taizhou, Huzhou, Shaoxing, Jinhua, Zhoushan, Taizhou, Wuhu, Maanshan, Tongling, Anqing, Chuzhou, Chizhou, Xuancheng.

Nine cities in the Pearl-River Delta: Guangzhou, Shenzhen, Dongguan, Foshan, Zhuhai, Zhongshan, Jiangmen, Huizhou, Zhaoqing.


english.scio.gov.cn丨Updated: January 6, 2020

Beijing tops China Integrated City Index 2018

Beijing, Shanghai, and Shenzhen are ranked first, second, and third in the “China Integrated City Index 2018” released Thursday at a symposium in Beijing.

The index was compiled by the National Development and Reform Commission’s development planning department and Cloud River Research Institute, who jointly hosted the symposium.

The index evaluates 298 Chinese cities in terms of their society, economy, and environment, while establishing a set of quantitative standards and references for the urbanization and development of Chinese cities.

This year’s report focuses on the theme of “metropolitan area and development strategies.”

On rankings, Beijing, Shanghai, and Shenzhen are followed by Guangzhou, Tianjin, Hangzhou, Chongqing, Chengdu, Nanjing, and Wuhan to round up the top 10.

In the environment category, Shenzhen, Sanya and Haikou take the first three positions, followed by Pu’er, Beijing, Xiamen, Guangzhou, Shanghai, Fuzhou and Chongqing. 

In the society category, Beijing, Shanghai, and Guangzhou are the top three followed by Hangzhou, Tianjin, Chongqing, Chengdu, Shenzhen, Wuhan and Nanjing. 

In terms of the economy index, Shanghai, Beijing and Shenzhen are the top three cities, followed by Guangzhou, Tianjin, Suzhou, Chengdu, Hangzhou, Chongqing and Wuhan. 

“Based on indexes of all categories, we can observe a clear evidence of the concentration of functions in big cities as well as the polarization between cities,” said Zhou Muzhi, head of Cloud River Research Institute and the index expert group. 

For instance, the top 30 cities account for 42.5 percent of the nation’s total GDP, 74.9 percent of the manufacturing export, 92.8 percent of universities listed in Project 211 and Project 985, and 50.2 percent of Tier 3A hospitals. 

As to the number of listed companies on the main board, enterprises from the top 30 cities account for 69.7 percent, among which 39.6 percent are located in the top three cities. 

Meanwhile, airports in the top 30 cities have received a large number of visitors, making up 81.3 percent of the total, while container ports in the top 30 have contributed to up to 97.8 percent of the nation’s total throughput. 

A major feature of the report is the introduction of the concept of densely inhabited district (DID). The report defines a district with a population density of 5,000 or more per square kilometer as a DID, and it analyzes the relationship between the DID population and key indicators. It found that the DID population is highly correlated with the vitality and quality of urban development. 

Zhou said China has overemphasized the pressure on the urban environment and infrastructure brought by population size and density without realizing that high-density population is an important foundation of urban development. 

He said China must discard such a misconception, promote intelligent urban governance and enhance the vitality and quality of the development through improving DID quality and scale.

“The real economic development of China has only started since the beginning of the 21st century,” Zhou said. “There are two main driving forces for China’s economic development. One is international trade after it joined the WTO and the other is urbanization.”

The report analyzes key indicators of urbanization in China from 2000 to 2016, showing that during this period, China’s GDP increased by 330 percent and the urban area expanded 180 percent, whereas the population in DID only increased 20 percent. 

“It is more of the urbanization in land than urbanization in population,” Zhou said. 

During this period, the energy consumption per unit of GDP fell by 40 percent, and the carbon dioxide emissions per unit of GDP fell by 30 percent. However, the energy consumption per capita rose sharply. For example, the electricity consumption per capita increased 330 percent, leading to an increase of 210 percent in the total amount of carbon dioxide emissions and making China the world’s largest carbon dioxide emitter. 

Zhou said he believes China has an urgent need to improve the quality of economic development and urban construction. 

The report also compares two major metropolitan areas of East Asia — the Beijing metropolitan area (Beijing and its suburbs) and the Tokyo metropolitan area (Tokyo, Kanagawa, Saitama, and Chiba) in terms of population, GDP, carbon dioxide emissions, and PM2.5 levels. 

According to the report, while the Beijing metropolitan area is 1.2 times the size of the Tokyo metropolitan area, its permanent population and DID population are only about 60 percent of the Tokyo metropolitan area. 

Beijing’s GDP is only 30 percent of the Tokyo metropolitan area, and its GDP per capita is only half that of the Tokyo metropolitan area. However, Beijing’s energy consumption per unit of GDP is 7.4 times that of the Tokyo metropolitan area, and Beijing’s carbon dioxide emissions per unit of GDP are 4.7 times that of Tokyo’s. 

As a result, despite a much smaller population and GDP, Beijing’s carbon dioxide emissions are 1.2 times that of the Tokyo metropolitan area.

“Beijing needs to implement the metropolitan area development strategies, optimize the urban DID spatial structure as well as the economic structure, improve the lifestyle, and enhance the resource utilization efficiency,” Zhou said.

Zhao Qizheng, former director of the State Council Information Office and the first director of the Pudong New Area Management Committee, spoke highly of the index and said he believes the index provides new ideas, discourses, and frameworks for understanding and governing a city. 

Yang Weimin, chief expert of the index expert group, said he believes the three-dimensional view of cities reflects a well-balanced conception and provides guidance for a more comprehensive, coordinated and sustainable development of cities. 

“The report is not only an evaluation, but also a direction for progress,” Yang said.


The article was first published on China SCIO, China.org.cn on Dec 29, 2019 and reprinted by other news websites.

China Integrated City Index 2018

The index was compiled by the National Development and Reform Commission’s development planning department and Cloud River Research Institute, who jointly hosted the symposium.

The index evaluates 298 Chinese cities in terms of their society, economy, and environment, while establishing a set of quantitative standards and references for the urbanization and development of Chinese cities.

This year’s report focuses on the theme of “metropolitan area and development strategies.”

On rankings, Beijing, Shanghai, and Shenzhen are followed by Guangzhou, Tianjin, Hangzhou, Chongqing, Chengdu, Nanjing, and Wuhan to round up the top 10.

In the environment category, Shenzhen, Sanya and Haikou take the first three positions, followed by Pu’er, Beijing, Xiamen, Guangzhou, Shanghai, Fuzhou and Chongqing.

In the society category, Beijing, Shanghai, and Guangzhou are the top three followed by Hangzhou, Tianjin, Chongqing, Chengdu, Shenzhen, Wuhan and Nanjing.

In terms of the economy index, Shanghai, Beijing and Shenzhen are the top three cities, followed by Guangzhou, Tianjin, Suzhou, Chengdu, Hangzhou, Chongqing and Wuhan.


“Based on indexes of all categories, we can observe a clear evidence of the concentration of functions in big cities as well as the polarization between cities,” said Zhou Muzhi, head of Cloud River Research Institute and the index expert group.

For instance, the top 30 cities account for 42.5 percent of the nation’s total GDP, 74.9 percent of the manufacturing export, 92.8 percent of universities listed in Project 211 and Project 985, and 50.2 percent of Tier 3A hospitals.

As to the number of listed companies on the main board, enterprises from the top 30 cities account for 69.7 percent, among which 39.6 percent are located in the top three cities.

Meanwhile, airports in the top 30 cities have received a large number of visitors, making up 81.3 percent of the total, while container ports in the top 30 have contributed to up to 97.8 percent of the nation’s total throughput.

A major feature of the report is the introduction of the concept of densely inhabited district (DID). The report defines a district with a population density of 5,000 or more per square kilometer as a DID, and it analyzes the relationship between the DID population and key indicators. It found that the DID population is highly correlated with the vitality and quality of urban development.

Zhou said China has overemphasized the pressure on the urban environment and infrastructure brought by population size and density without realizing that high-density population is an important foundation of urban development.

He said China must discard such a misconception, promote intelligent urban governance and enhance the vitality and quality of the development through improving DID quality and scale.

“The real economic development of China has only started since the beginning of the 21st century,” Zhou said. “There are two main driving forces for China’s economic development. One is international trade after it joined the WTO and the other is urbanization.”

The report analyzes key indicators of urbanization in China from 2000 to 2016, showing that during this period, China’s GDP increased by 330 percent and the urban area expanded 180 percent, whereas the population in DID only increased 20 percent.

“It is more of the urbanization in land than urbanization in population,” Zhou said.

During this period, the energy consumption per unit of GDP fell by 40 percent, and the carbon dioxide emissions per unit of GDP fell by 30 percent. However, the energy consumption per capita rose sharply. For example, the electricity consumption per capita increased 330 percent, leading to an increase of 210 percent in the total amount of carbon dioxide emissions and making China the world’s largest carbon dioxide emitter.

Zhou said he believes China has an urgent need to improve the quality of economic development and urban construction.

The report also compares two major metropolitan areas of East Asia — the Beijing metropolitan area (Beijing and its suburbs) and the Tokyo metropolitan area (Tokyo, Kanagawa, Saitama, and Chiba) in terms of population, GDP, carbon dioxide emissions, and PM2.5 levels.

According to the report, while the Beijing metropolitan area is 1.2 times the size of the Tokyo metropolitan area, its permanent population and DID population are only about 60 percent of the Tokyo metropolitan area.

Beijing’s GDP is only 30 percent of the Tokyo metropolitan area, and its GDP per capita is only half that of the Tokyo metropolitan area. However, Beijing’s energy consumption per unit of GDP is 7.4 times that of the Tokyo metropolitan area, and Beijing’s carbon dioxide emissions per unit of GDP are 4.7 times that of Tokyo’s.

As a result, despite a much smaller population and GDP, Beijing’s carbon dioxide emissions are 1.2 times that of the Tokyo metropolitan area.

“Beijing needs to implement the metropolitan area development strategies, optimize the urban DID spatial structure as well as the economic structure, improve the lifestyle, and enhance the resource utilization efficiency,” Zhou said.

Zhao Qizheng, former director of the State Council Information Office and the first director of the Pudong New Area Management Committee, spoke highly of the index and said he believes the index provides new ideas, discourses, and frameworks for understanding and governing a city.

Yang Weimin, chief expert of the index expert group, said he believes the three-dimensional view of cities reflects a well-balanced conception and provides guidance for a more comprehensive, coordinated and sustainable development of cities.

“The report is not only an evaluation, but also a direction for progress,” Yang said.


Beijing, Shanghai, Shenzhen top city ranking

Beijing, Shanghai, and Shenzhen are the top three cities in a recently released comprehensive ranking of Chinese cities, the “China Core Cities & Metropolitan Area Development Index 2018.”

The index, which analyzes and evaluates 298 cities at the prefecture level and above, was compiled by Cloud River Urban Research Institute, a think tank specializing in urbanization research.


The index assesses China’s 36 core cities, including four municipalities, 22 provincial capitals, five capitals of autonomous regions, and five cities specially designated by China as core cities.


Statistics show that the 36 core cities contributed to 39.7% of the national GDP, 55.2% of national exports in goods, and 48.7% of authorized patents. The 36 cities also have 25% of China’s population, 71.6% of companies listed on the main board, 94.8% of China’s top universities, 58.1% of its five-star hotels, and 54.1% of its top hospitals.


The index comprises 10 major indexes and 30 sub-indexes based on the city’s status, metropolitan area power, wide-area hub, opening and communications, business environment, innovation and entrepreneurship, ecological resources and environment, life quality, and culture and education. The index aims to give a holistic evaluation of China’s central cities in terms of their capabilities in developing metropolitan area.


Beijing, Shanghai, and Guangzhou take the first three spots in the index measuring a city’s administrative functions, regional influence, and the standing in the Belt and Road Initiative, followed by Tianjin, Chongqing, Nanjing, Hangzhou, Chengdu, Shenzhen, and Wuhan.

According to the sub-index of administrative functions, the national capital, municipalities, and provincial capitals have fared well. In evaluating regional influence, cities located in the Yangtze River Delta, the Pearl River Delta, and the Beijing-Tianjin-Hebei region have higher scores.

Beijing, Shanghai and Shenzhen lead another major index of metropolitan areas, followed by Guangzhou, Tianjin, Chongqing, Hangzhou, Wuhan, Chengdu and Nanjing. Sub-indexes in this category include economic scale (headed by China’s four municipalities), business agglomeration (led by Beijing, Shanghai, and Shenzhen), and metropolitan area quality (with Shanghai, Shenzhen, and Beijing at the top).


Under a third major index of business environment, Shanghai, Beijing, and Guangzhou take the top three spots, followed by Shenzhen and Wuhan in the fourth and tenth positions, respectively. Shanghai, Shenzhen, and Xiamen rank at the top under the sub-index of industrial park support. Beijing, Shanghai, and Guangzhou take the first three positions under the sub-indexes of business support and urban transportation.


China.org.cn, August 19, 2019


Seminar held on high quality urban development

A seminar co-organized by China.org.cn and Cloud River Urban Research Institute was held in Beijing on June 11 to discuss high quality development of Chinese cities.


Co-organized by China Internet Information Center (China.org.cn) and Cloud River Urban Research Institute, the event was attended by government officials, economists, and opinion leaders.


Zhao Qizheng, former minister of the State Council Information Office of China.
Zhao Qizheng, former minister of the State Council Information Office of China. [Photo by Yang Jia/China.org.cn]

Yang Weimin, vice chairman of the Economic Committee of the Chinese People’s Political Consultative Conference (CPPCC) and a member of the Standing Committee of the CPPCC, said high quality urbanization rests on the balanced development of the economy, the people, resources and the environment.


Yang Weimin, vice chairman of the Economic Committee of the Chinese People's Political Consultative Conference (CPPCC).
Yang Weimin, vice chairman of the Economic Committee of the Chinese People’s Political Consultative Conference (CPPCC). [Photo by Yang Jia/China.org.cn]

He said China should further relax restrictions on its household registration (hukou) system, improve the rural collective ownership system for construction land, increase land supply for residential use, and coordinate infrastructure development, environmental protection, tourism, energy use, and big data sharing within a megalopolis or urban complex.

In February, the National Development and Reform Commission, the country’s top economic planner, published a guideline on promoting urban complex development to optimize structural balance between population and economic growth, as well as to boost investment and consumption.


Zhou Muzhi, head of the Cloud River Urban Research Institute.
Zhou Muzhi, head of the Cloud River Urban Research Institute. [Photo by Yang Jia/China.org.cn]

Zhou Muzhi, head of the Cloud River Urban Research Institute, said the guideline aims to optimize urban development in densely populated areas and promote coordinated development of a metropolitan city and its surrounding cities.

During the seminar, Zhou also unveiled a report, compiled by the Cloud River Urban Research Institute, on the development index of major Chinese cities and urban complex in 2018.

According to the report, Beijing, Shanghai, and Shenzhen are among the top three in the development index ranking and in several other rankings on key indicators like economic scale, quality development, and business concentration.


China.org.cn丨Updated: June 17, 2019


Metropolitan areas to spearhead nation’s urbanization drive

Metropolitan areas could be the next driving force of China’s urbanization. The country’s top regulator and political advisers are drawing up new blueprints that are concentrated in some second-tier cities in the central and western regions.

China will focus on developing five metropolitan areas with the cities of Taiyuan, Guiyang, Lanzhou, Kunming and Yinchuan, said Yang Weimin, vice-chairman of the Economic Committee of the Chinese People’s Political Consultative Conference National Committee and a member of the Standing Committee of the CPPCC National Committee.

Yang, who is also the former deputy head of the Office of the Central Commission for Financial and Economic Affairs, outlined the concept of “high-quality urbanization” – a balanced development of economy, people, resources and the environment.

“In China, a key factor that constrains cities’ development is resources and environment, and the essence of (the) housing problem is how to balance development between people and nature,” Yang said at a recent seminar jointly held by the China internet Information Center and the Cloud River Urban Research Institute.

He also highlighted further reforms in the housing system, especially changing the real estate tax system and building a special policy bank for housing.

The government has finished plans for 19 city clusters, each of which is composed of several metropolitan areas containing the most important elements to accelerate and rebalance urban development, Zhou Nan, deputy head of the development and planning department of the National Development and Reform Commission, told China Daily.

The old-style urbanization relied on industrialization and heavy industry to expand and produce strong growth in some regions, such as the three provinces in northeastern China, along with massive infrastructure and property investment.

Problems, however, rose during the urbanization process such as over-investment in unprofitable enterprises, a high debt burden for local governments and environmental pollution.

In addition, as China’s economy is facing slowdown risks amid increasing external headwinds, some cities which relied too much on heavy industry are shrinking when young people move out of those areas to look for new jobs.

Those issues became a bottleneck which constrained the world’s second largest economy as it transitioned into a high-income country, according to some economists.

Experts and officials are learning experiences from some successful cases for urbanization, such as the Pudong New Area in Shanghai, which grew from a wasteland into a modern international economic and financial center.

Zhao Qizheng, former minister of the State Council Information Office of China and a leading official in the building of Shanghai’s Pudong New Area, said that international-standard development plans and opening to global investment contributed to Pudong’s rapid development.

“Pudong has also boosted the development of Shanghai and the overall Yangtze River Delta area,” said Zhao.

Following those successful cases, this will be a significant year for the new-style of urbanization in China in a shift toward a high-quality development model, Meng Wei, a spokeswoman for the NDRC, said at a news conference on Monday.

Designing the city cluster and metropolitan area development plans to coordinate growth of multiple-sized cities and towns is one of the four key tasks for the transition in urbanization. Other tasks include a relaxation of restrictions on the household registration system especially for migrants from rural areas, and freeing the flow of resources including land, capital and labor force, between urban and rural areas, Meng explained.

Zhou Muzhi, head of the Cloud River Urban Research Institute, said part of the plan to bolster metropolitan areas is to improve the Densely Inhabited District – an index that indicates districts with a population density of more than 5,000 inhabitants per square kilometer.

This means raising the population density in key metropolitan areas and “the urbanization of population” should not lag far behind “the urbanization of infrastructure construction paved by steel and concrete,” he said.

A report by the institute said a stronger connection between the central large cities and the surrounding medium and small-sized cities can improve the capacity of metropolitan areas, especially in boosting the cities’ function as international exchange centers.

Senior NDRC official Zhou Nan said that well-developed metropolitan areas should be based on a mechanism which allows cities to share public services and protect the environment together.

Infrastructure systems, especially the unified transportation network, will be the priority for building the metropolitan areas. It also requires coordinated industrial development. The government could play a role in guiding population migration toward large city clusters, attracting immigrants through high-quality public services and social security, she added.


By Chen Jia | China Daily | Updated: June 20, 2019


Cities should be bigger and smarter, say experts

Chinese policymakers wish to bring more people into cities, to accelerate the second phase of the national urbanization campaign under the “2020 goal”, which will be a key driver of the economic growth in the long term, according to experts.

Different from the first phase, which progressed rapidly between 2000 and 2016, the upgraded urbanization model will focus on people, as well as the balance between the environment and the economy. Large urban clusters will also play crucial roles in accelerating the transformation, Zhou Muzhi, head of Cloud River Urban Research Institute, a leading think tank for city planning, told China Daily in an interview.

“Developing metropolitan areas will support the urbanization process, which requires cities to further open up, and shift their functions from manufacturing-oriented development to high-quality services. Some key areas include information technology and the knowledge-based economy,” he said.

On Monday, the National Development and Reform Commission, the country’s top economic regulator, issued a comprehensive plan to reduce restrictions on people accessing cities, a method to speed up the urbanization process.

It announced the removal of restrictions for people not born locally to get household registration permits in cities with populations of 1 to 3 million. Experts expected that will encourage more migration to cities. That will help China lift its urbanization rate to higher than 60.9 percent by the end of the year, a step to achieving the goal of bringing 100 million people into the nation’s cities from 2016 to 2020.

Policymakers are aware of the importance of people, which is in line with Cloud River’s study that population density is important to facilitate high-quality urban clusters, according to Zhou, who called for more attention to be paid to the positive effects of high population density.

But urban clusters need to shift their key functions, to attract skilled workers and develop modern services, he added. For example, cities need to strengthen the influence of service industries, they need to further open the market to foreign investors, build more airports, and increase the number of high-end hotels and restaurants.

“We call it the communication economy, which is different from the traditional trading economy based on manufacturing production and transactions of goods,” he said.

Yang Weimin, former deputy head of the Office of the Central Commission for Financial and Economic Affairs, said at a forum in March that the “new type of urbanization” should be sustainable, which needs to balance economic growth with the development of people. “That is the key issue of high-quality development.”

From 2000 to 2016, China’s urban area expanded by 2.8 times, while GDP rose by almost 4.3 times, according to Zhou, who is also a professor of economics at Tokyo Keizai University.

In the meantime, the index of Densely Inhabited District (DID) – districts with a population density of more than 5,000 inhabitants per square kilometer, only increased 1.2 times, much slower than the changes in the other indices, according to Zhou’s research.

“That’s a big problem,” he said. “It reflects that the ‘urbanization of population’ is lagging far behind the urbanization of infrastructure construction paved by steel and concrete.”

The concept of DID was first introduced by Cloud River Urban Research Institute in 2016. The index can reflect the trend of centralized and clustered urban development in China.

Together with the NDRC development planning department, the Cloud River Urban Research Institute has also conducted research and issued reports on the China Integrated City Index for three consecutive years since 2016.

In the report of the China Integrated City Index 2018, it showed that population density has a strong positive correlation with socioeconomic development, although it can have some negative effects on an area’s environmental quality and ecosystem.

DID population is closely related to the vitality and quality of urban development, and the key is to improve a city’s “intelligence”, or the educational level of its residents, according to the report.

To accelerate urbanization, financial measures will support the development of key urban development projects, strengthen infrastructure construction and promote investment. That will include boosting bank lending and the launch of real estate investment trusts (REITs), according to the NDRC.

The top planner is also determined to promote metropolitan area development. “We will explore and build the mechanism for promoting and coordinating metropolitan area development leading by core cities,” said a statement released on its website.


By Chen Jia | China Daily | Updated: April 10, 2019