The China Integrated City Index 2020, compiled by Cloud River Urban Research Institute, was released on Dec. 28. The Index covers 297 Chinese cities at and above the prefecture level, and analyzes and evaluates their sustainable development from three dimensions of environment, society, and the economy in an all-round way.
I. Rankings of China Integrated City Index 2020
The China Integrated City Index covers 297 Chinese cities at and above the prefecture level, and comprehensively evaluates their development from three dimensions of environment, society, and economy. Each of the three dimensions comprises three major items, and each major item comprises three sub-items, altogether forming a 3×3×3 structure. Each sub-item is supported by multiple indexes, and these indexes are composed of 882 sets of data, of which statistical data account for 31%, satellite remote sensing data for 35%, and internet big data for 34%. In this sense, the China Integrated City Index is an advanced multimodal index system that can use data resources in different fields to gauge and judge cities in a sound way.
The China Integrated City Index 2020 released by Cloud River Urban Research Institute evaluates the COVID-19 response and economic recovery of Chinese cities.
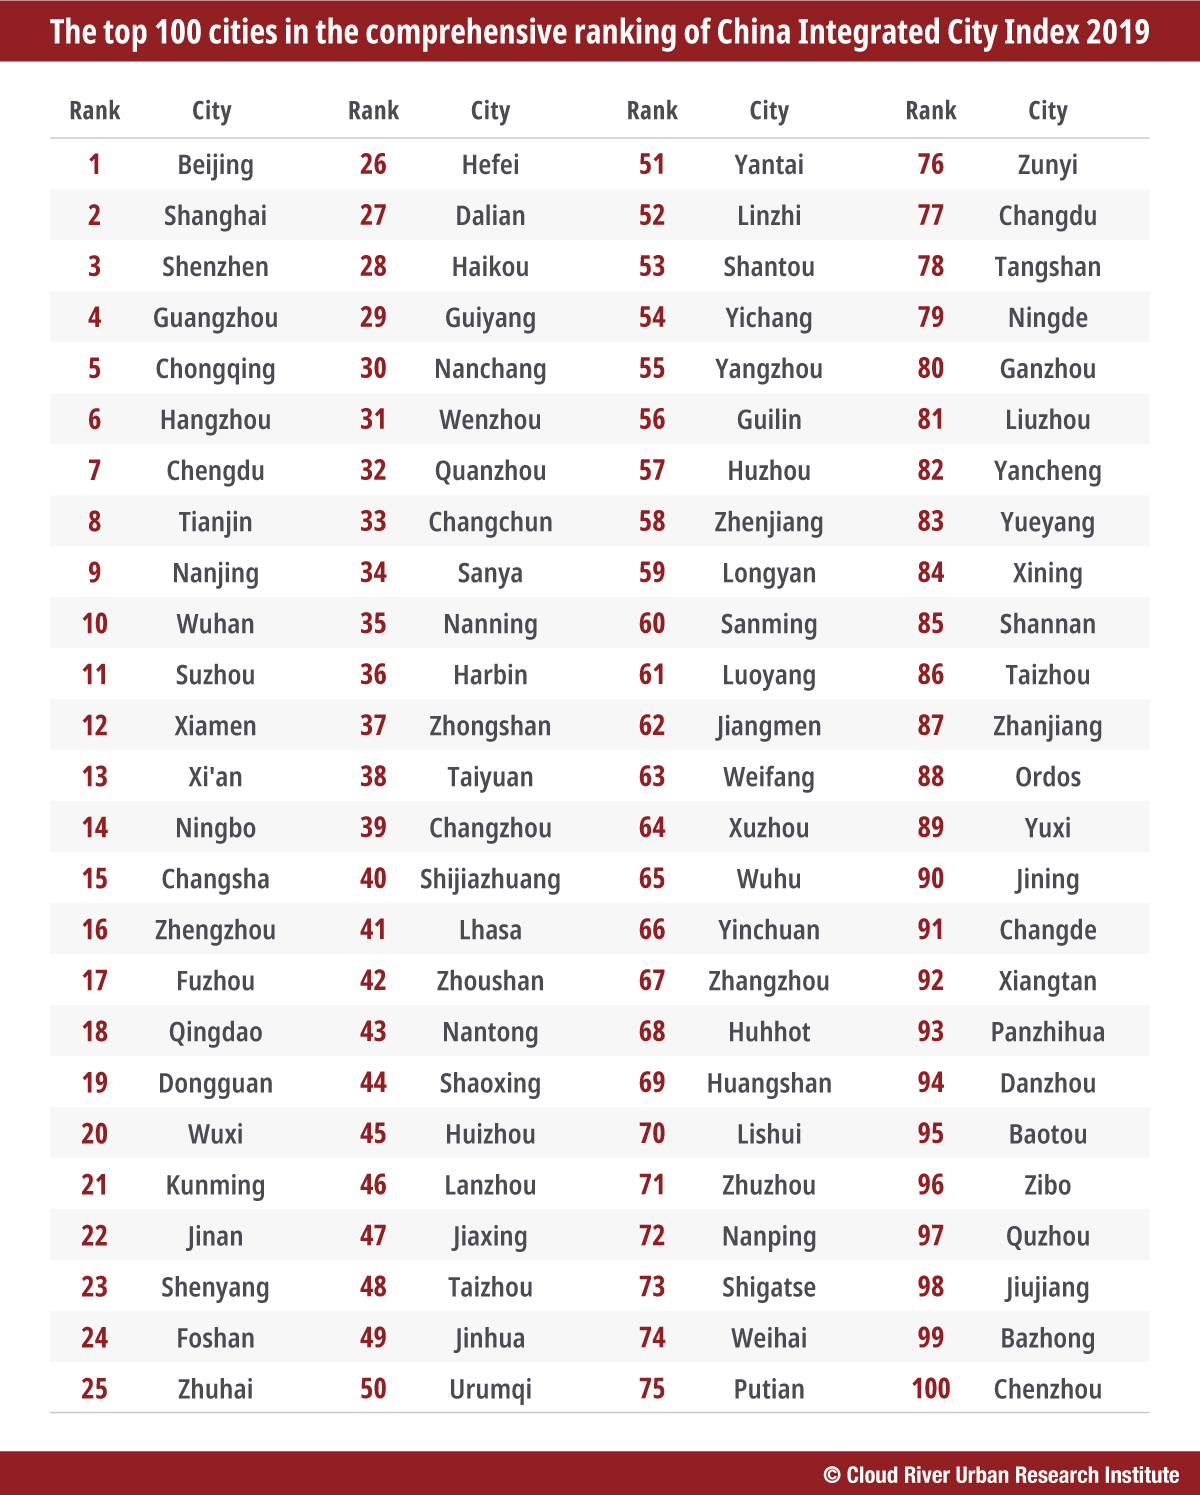
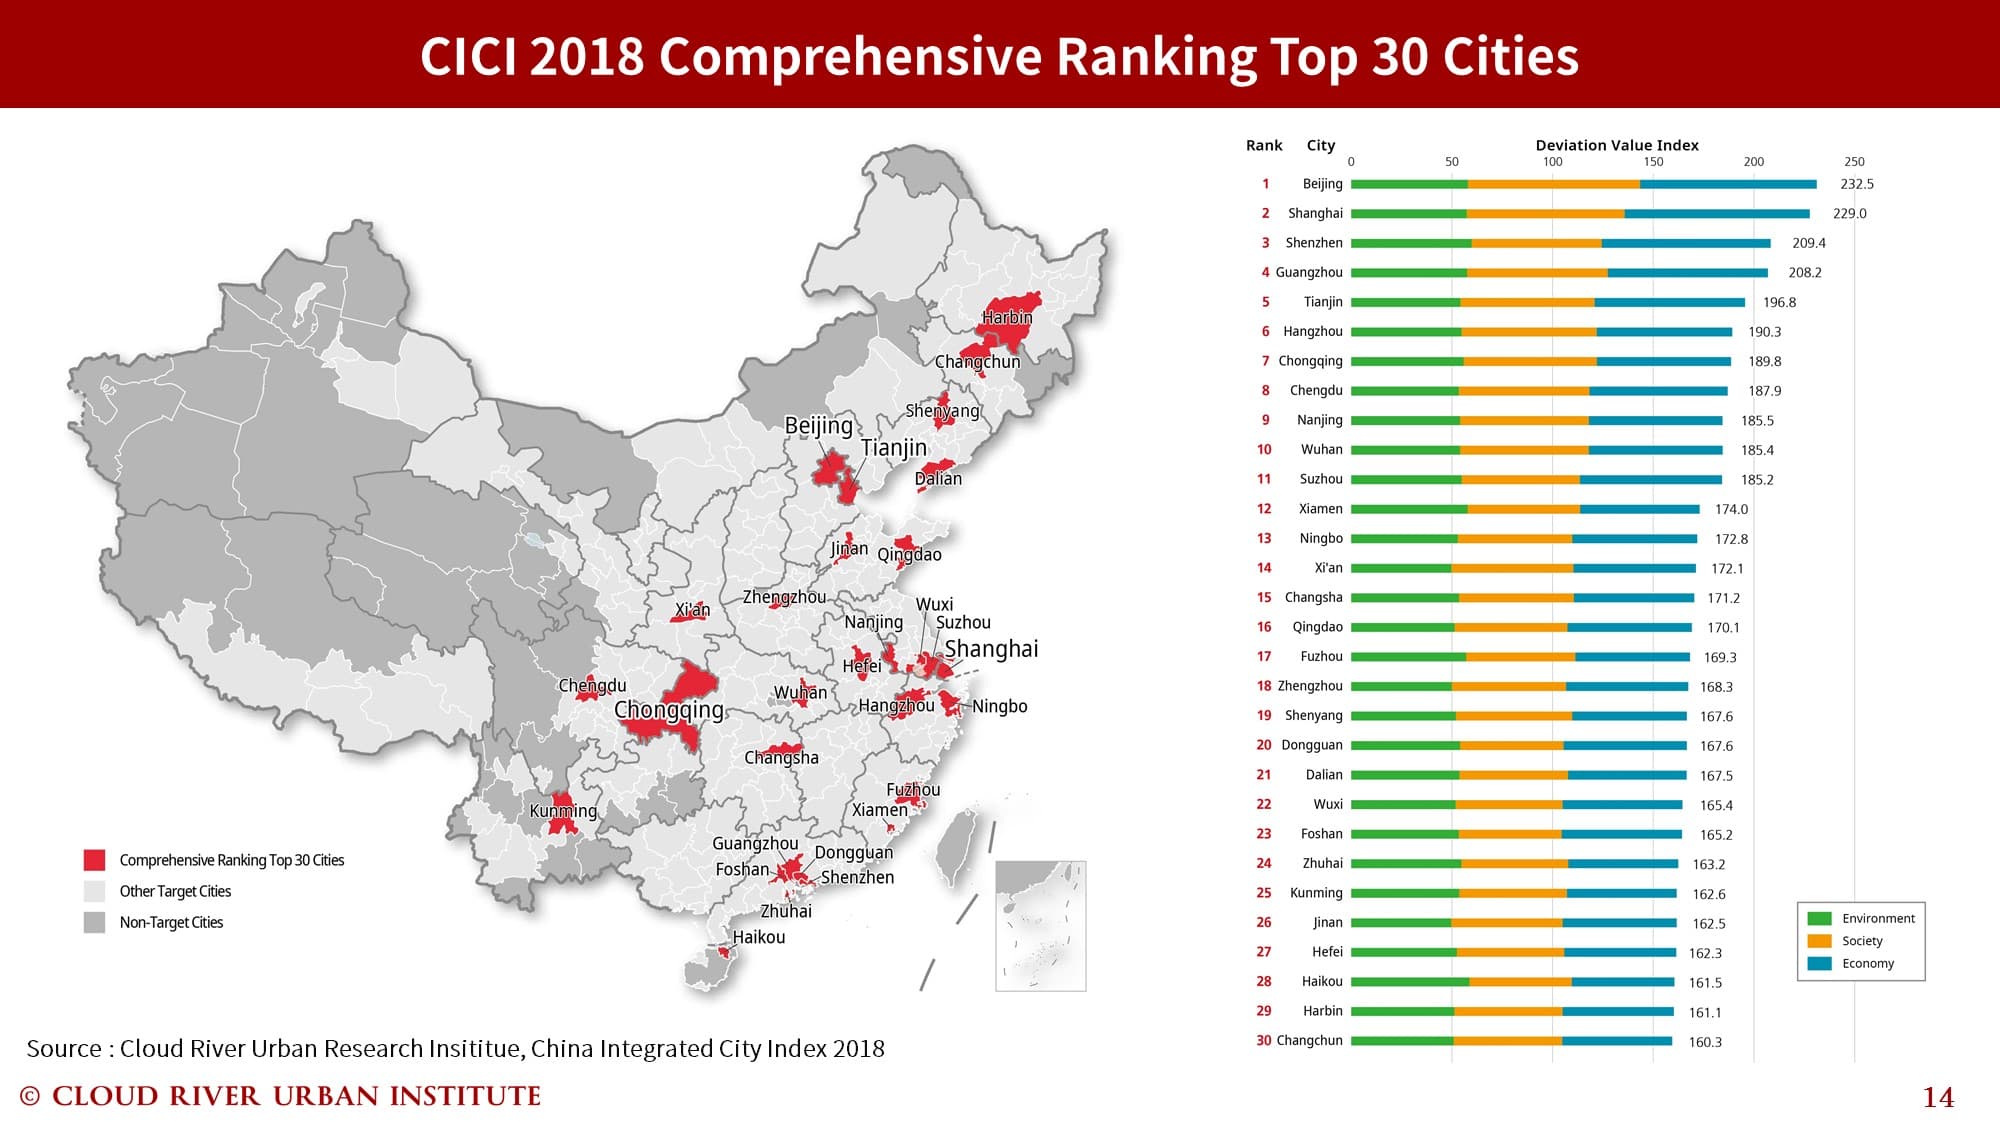
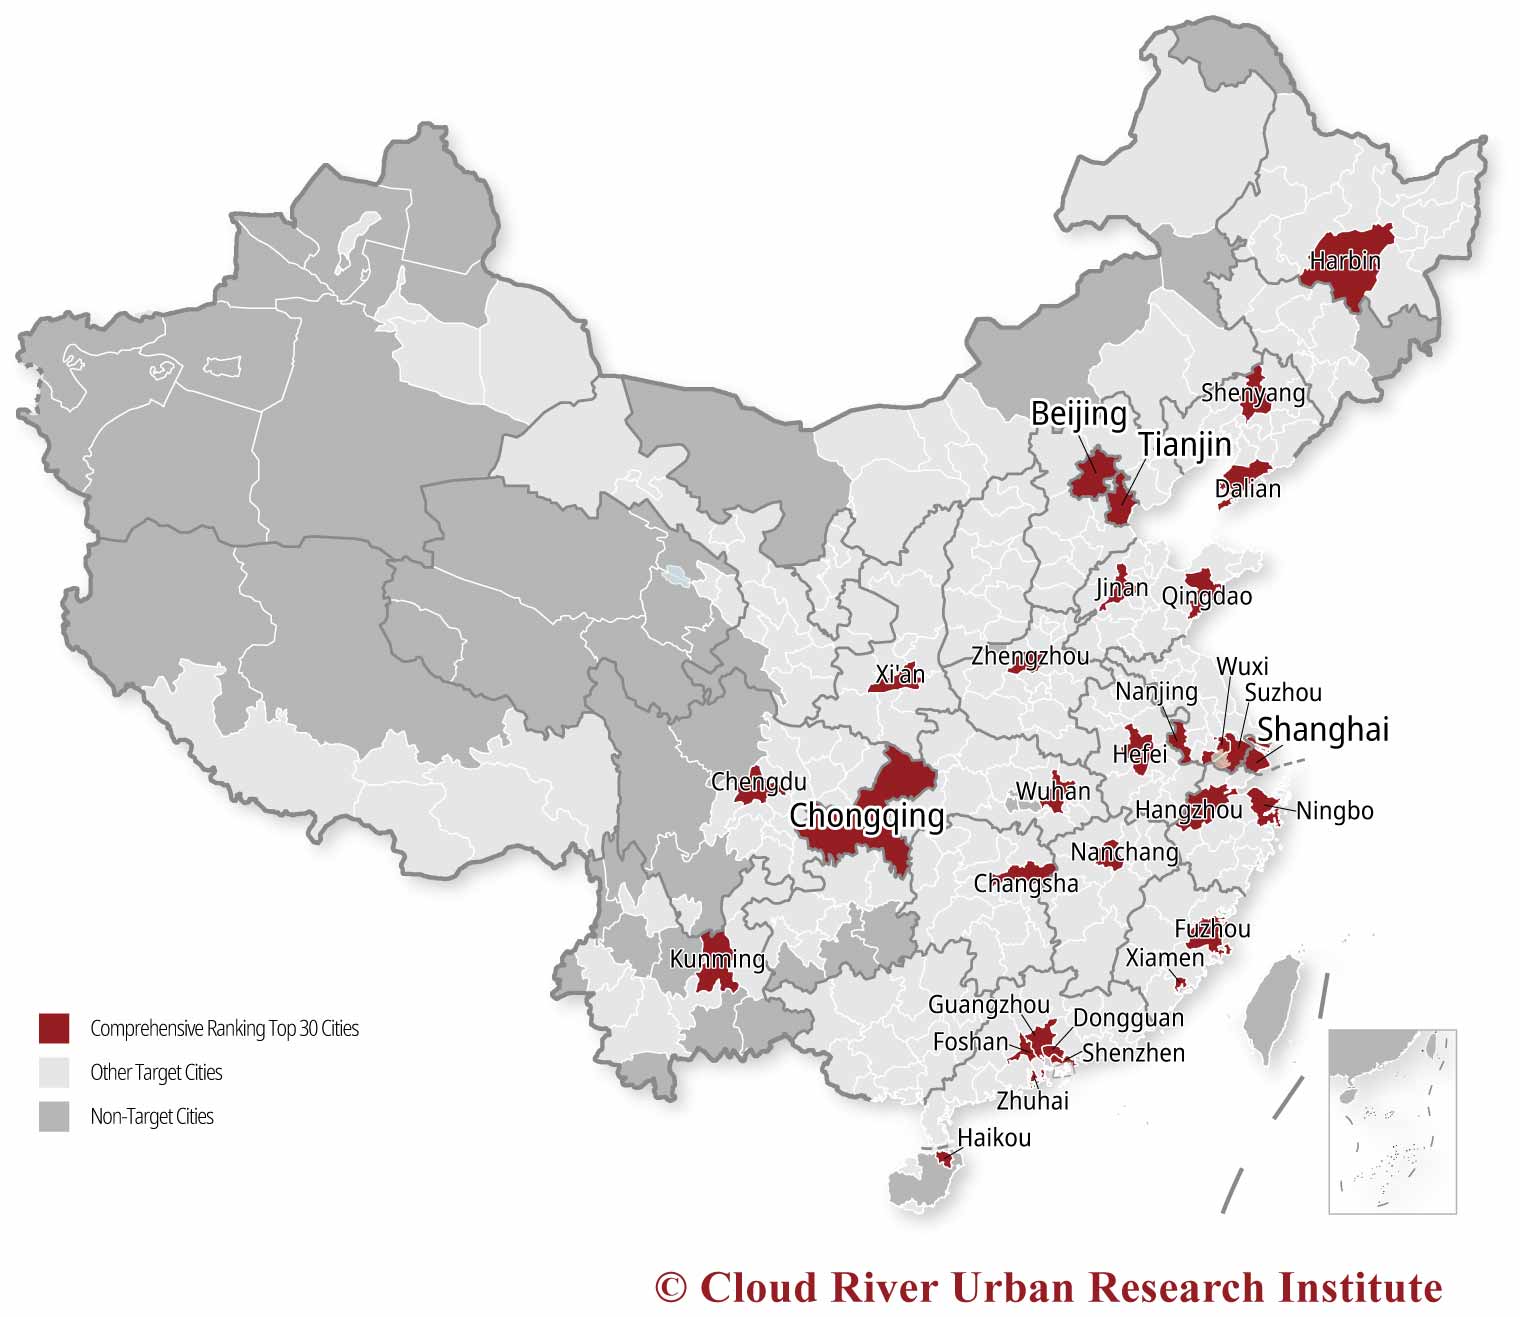
1. Comprehensive ranking
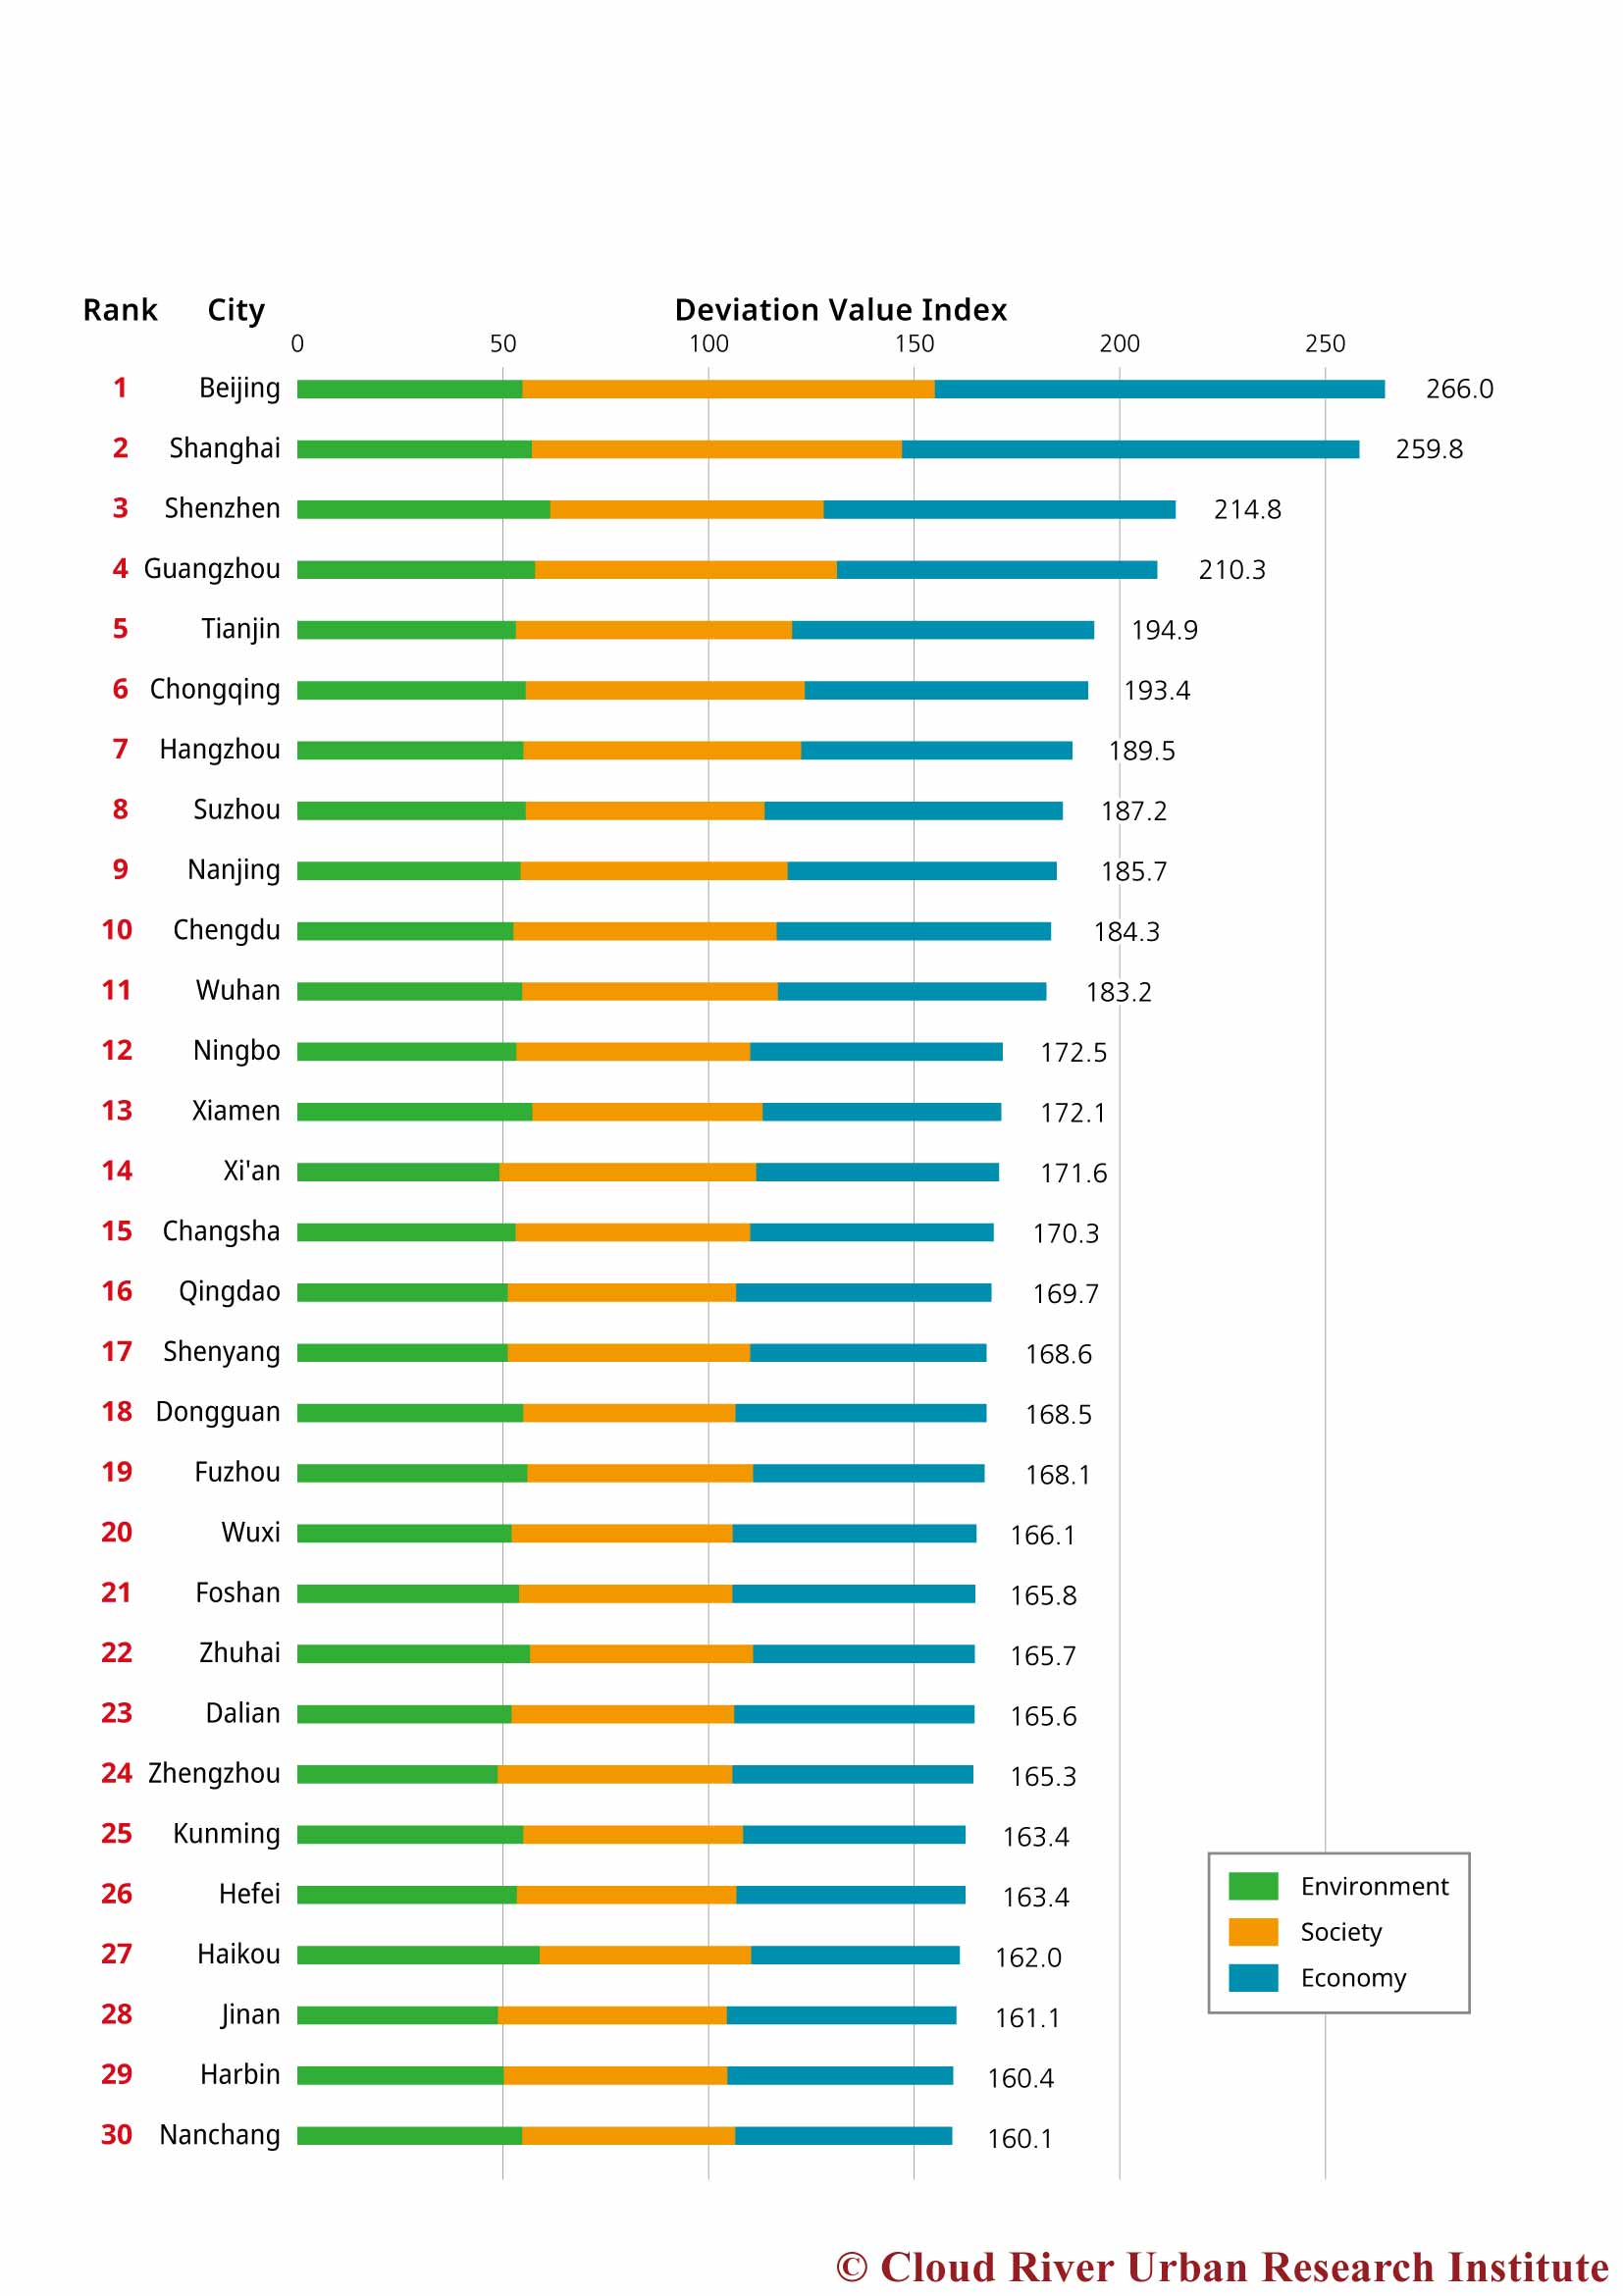
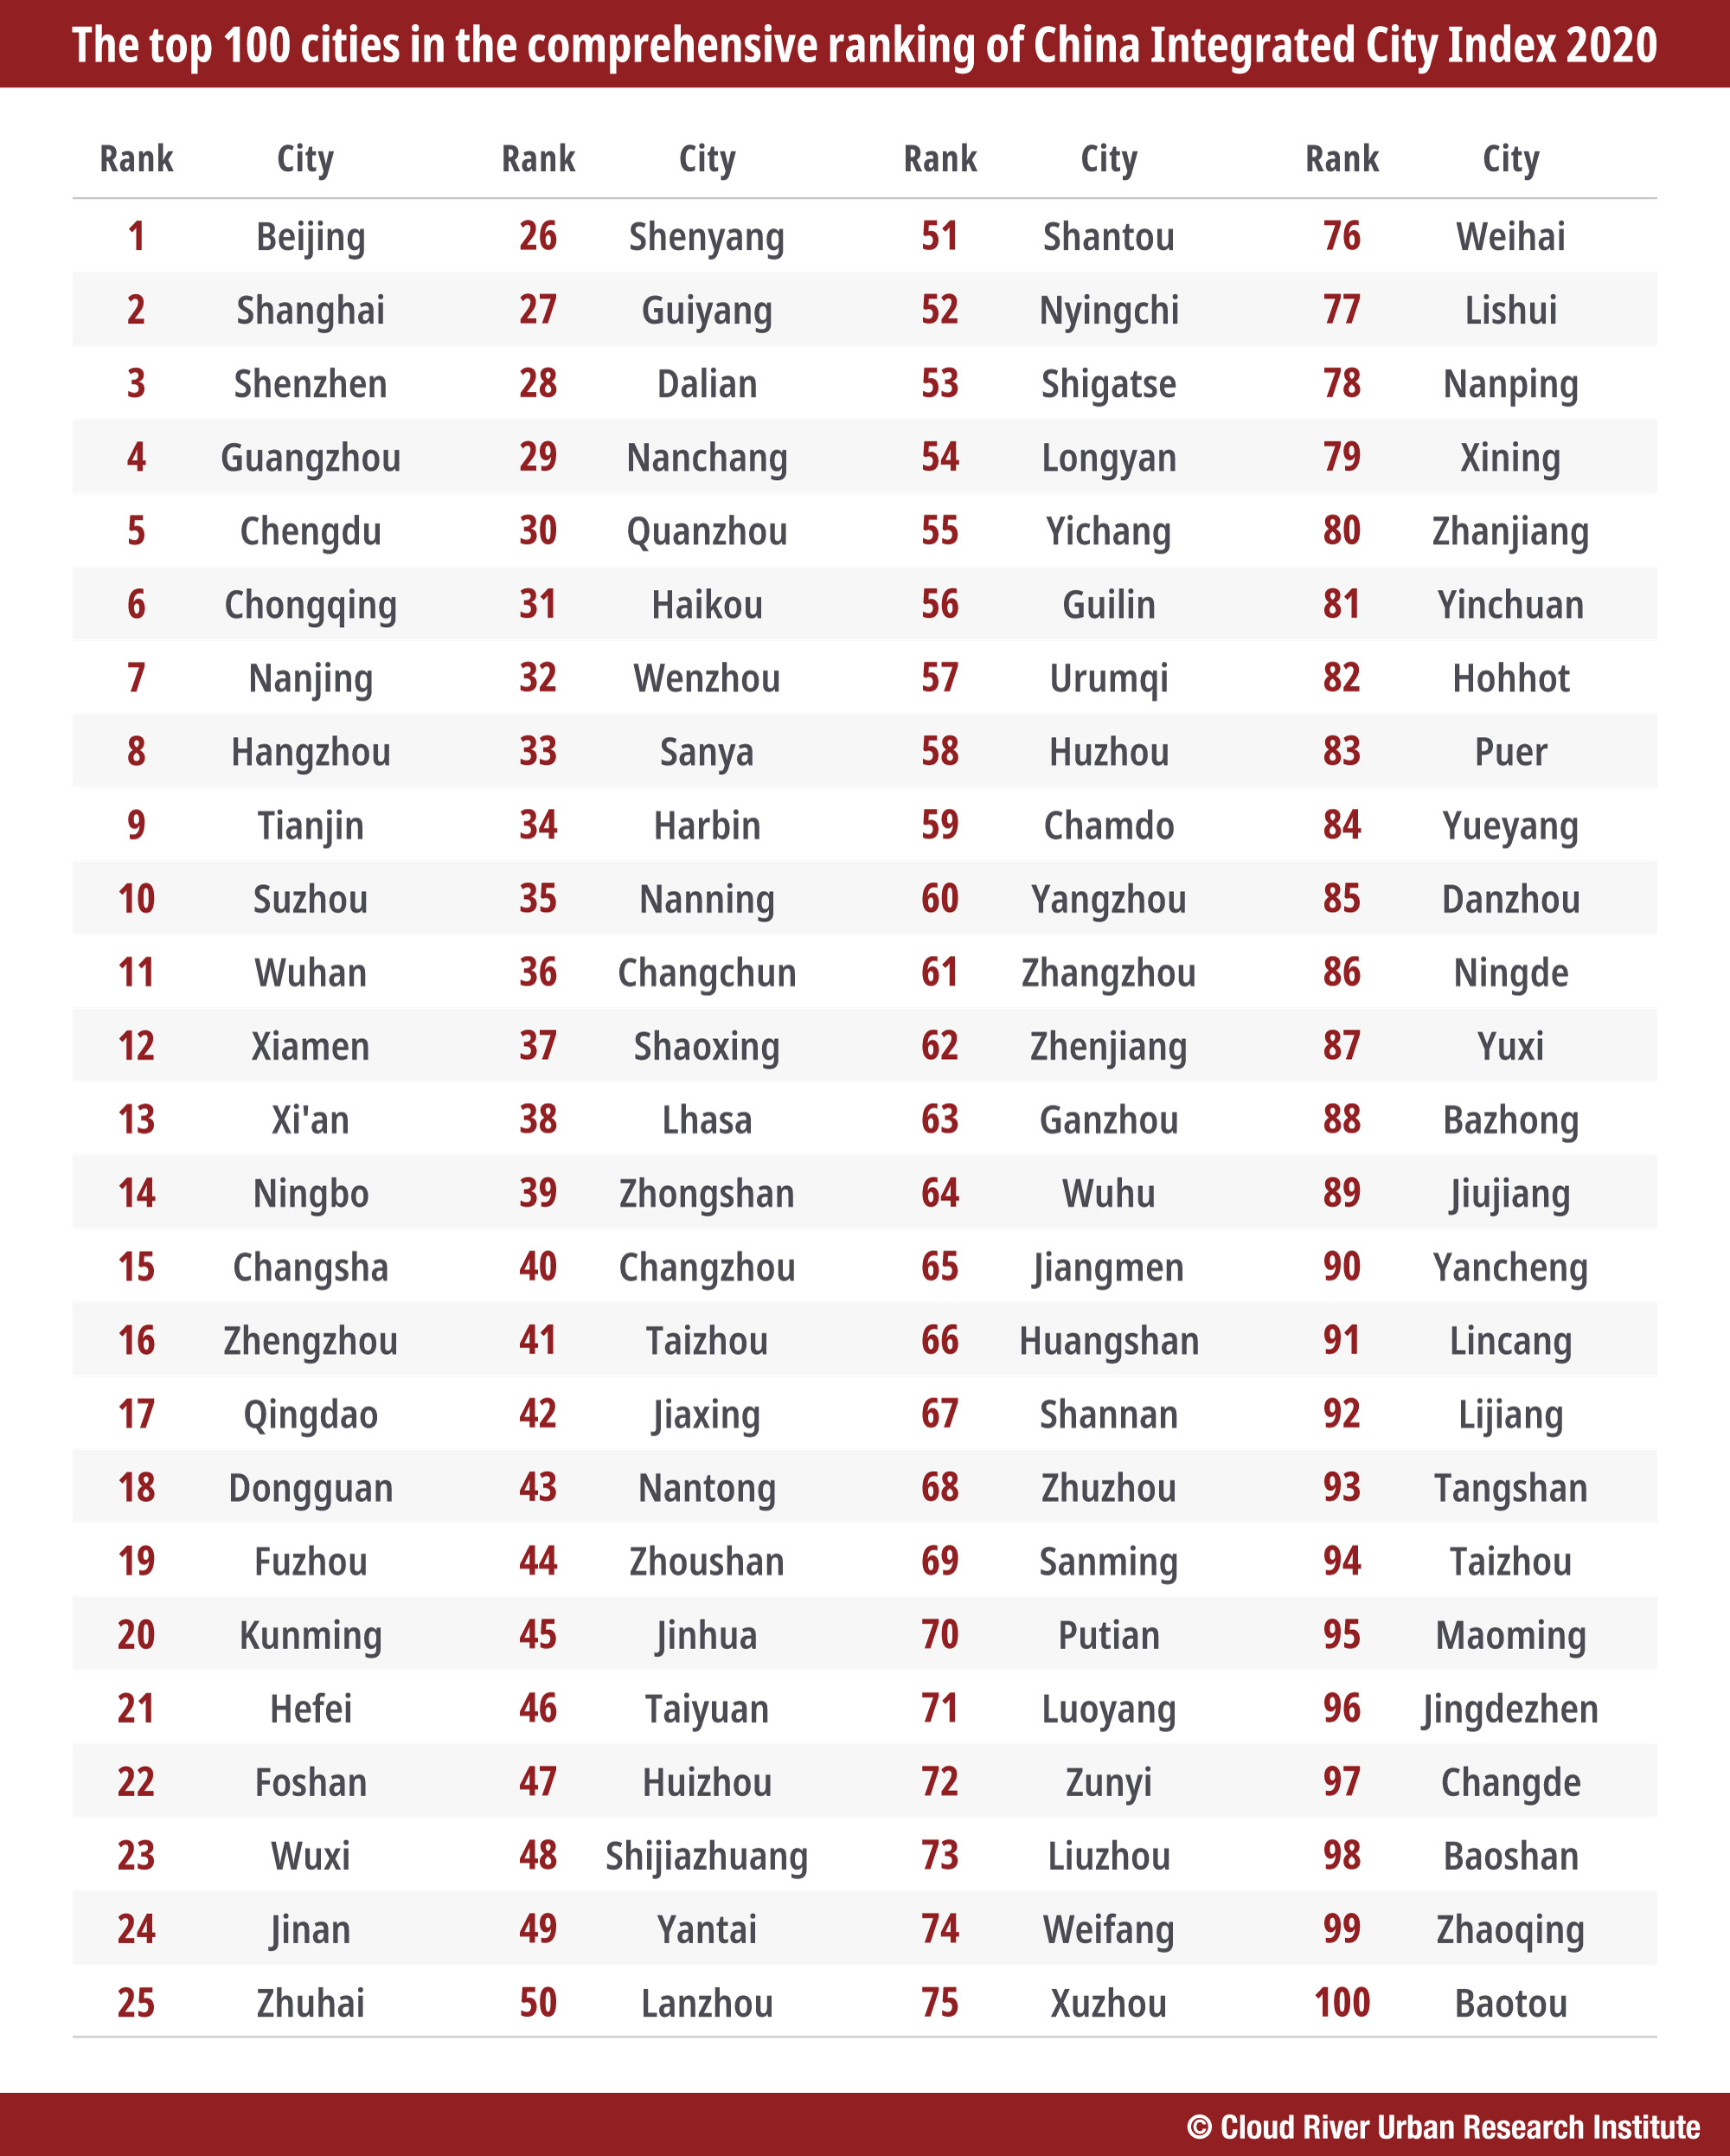
Beijing has topped the comprehensive ranking for five consecutive years, followed by Shanghai in second place and Shenzhen in third.
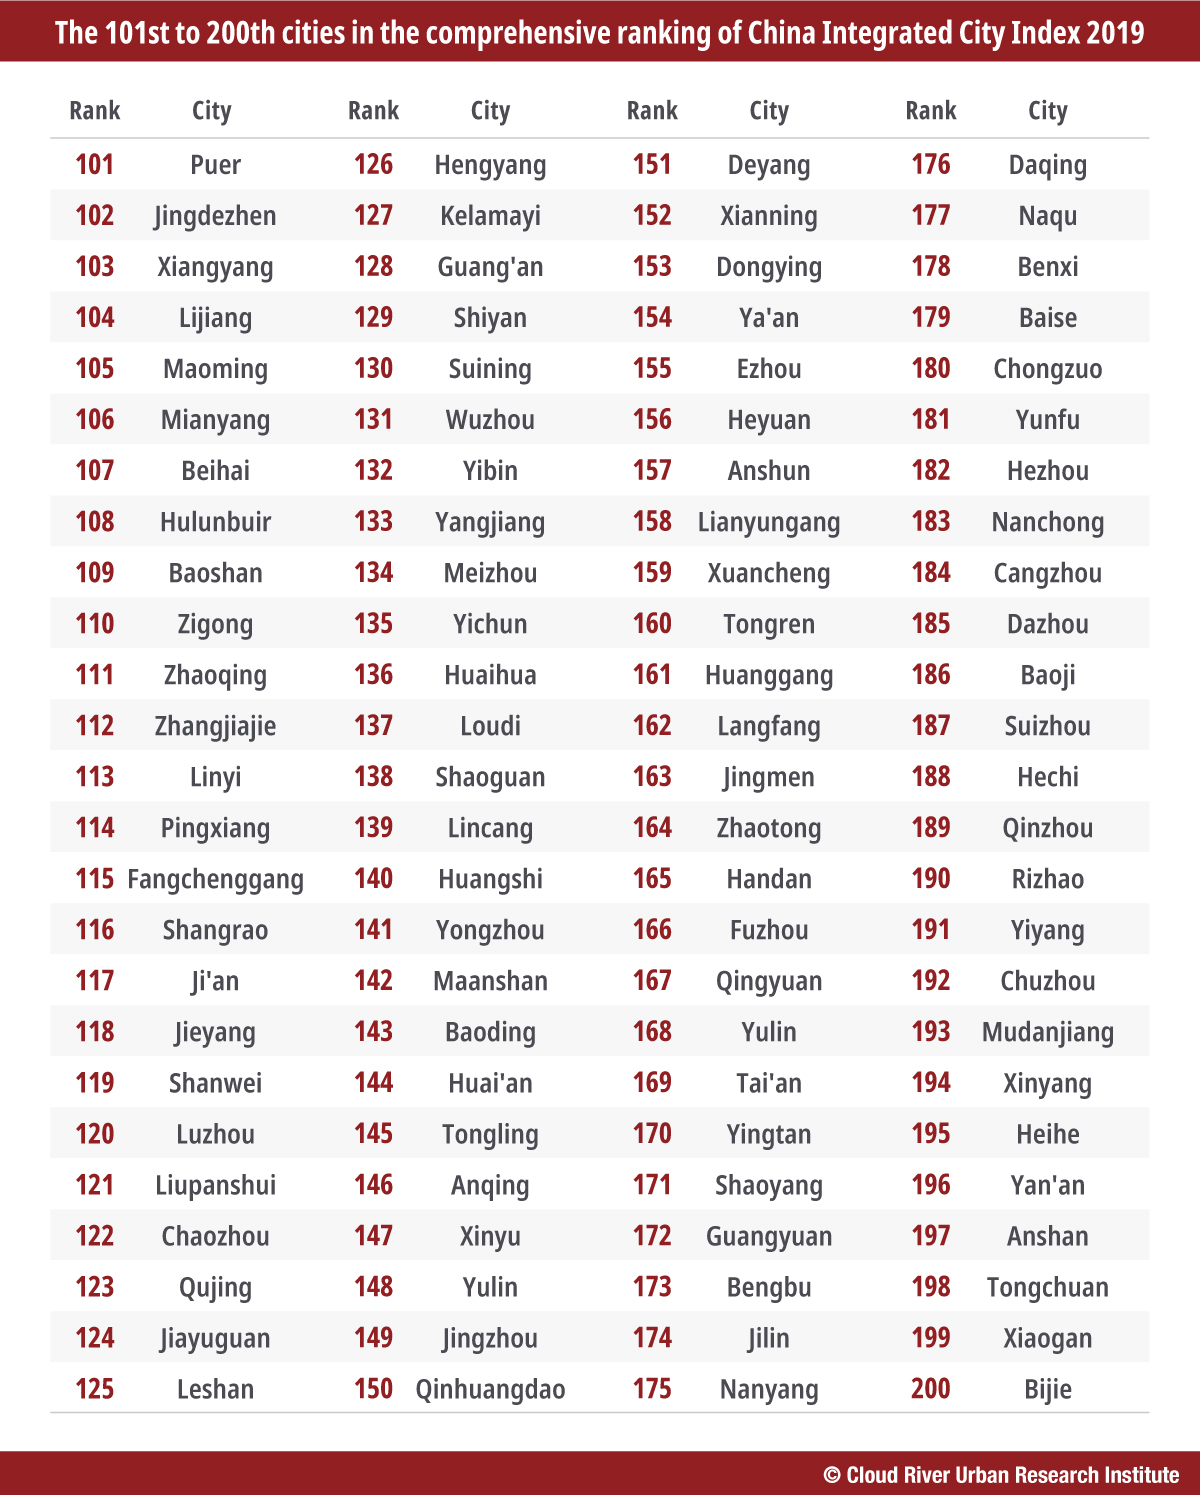
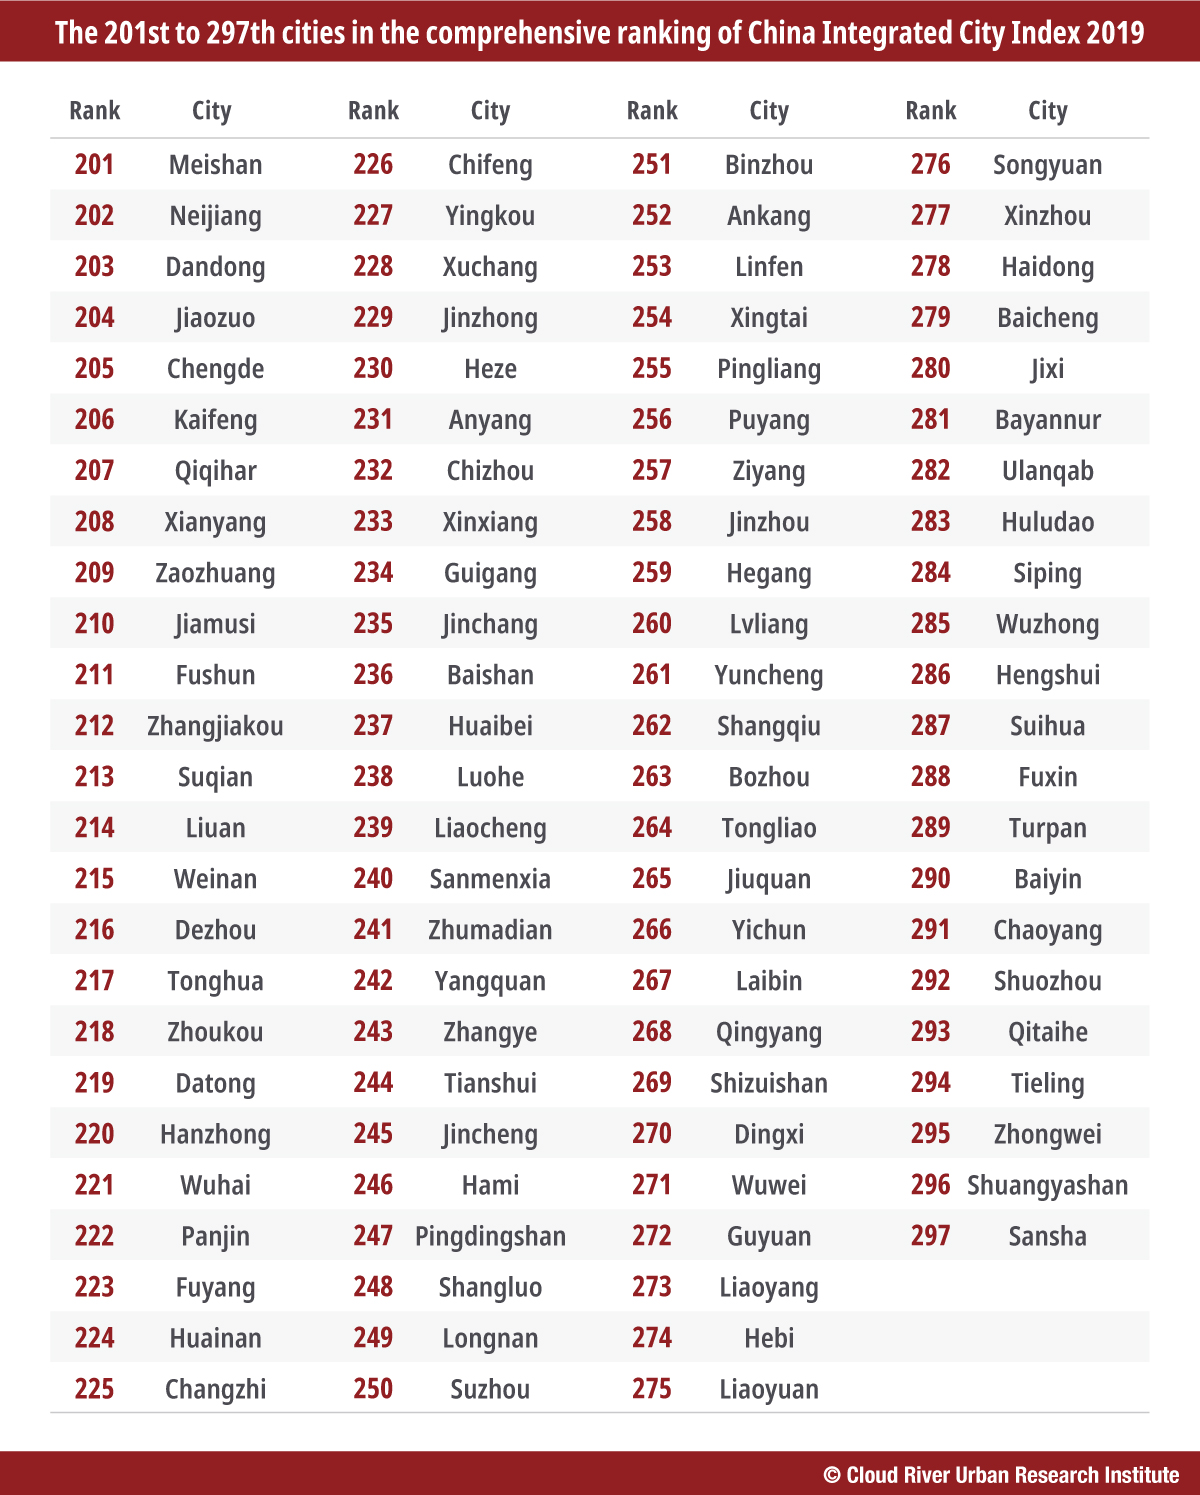
The top 10 Chinese cities in the comprehensive ranking in 2020 are Beijing, Shanghai, Shenzhen, Guangzhou, Chengdu, Chongqing, Nanjing, Hangzhou, Tianjin, and Suzhou. Chengdu and Nanjing rose to fifth and seventh place, respectively, while Suzhou entered the top 10 and Wuhan dropped out. The 10 cities are located in four city clusters, with four cities in the Yangtze River Delta, two in the Pearl River Delta, two in the Beijing-Tianjin-Hebei region, and two in the Chengdu-Chongqing economic circle.
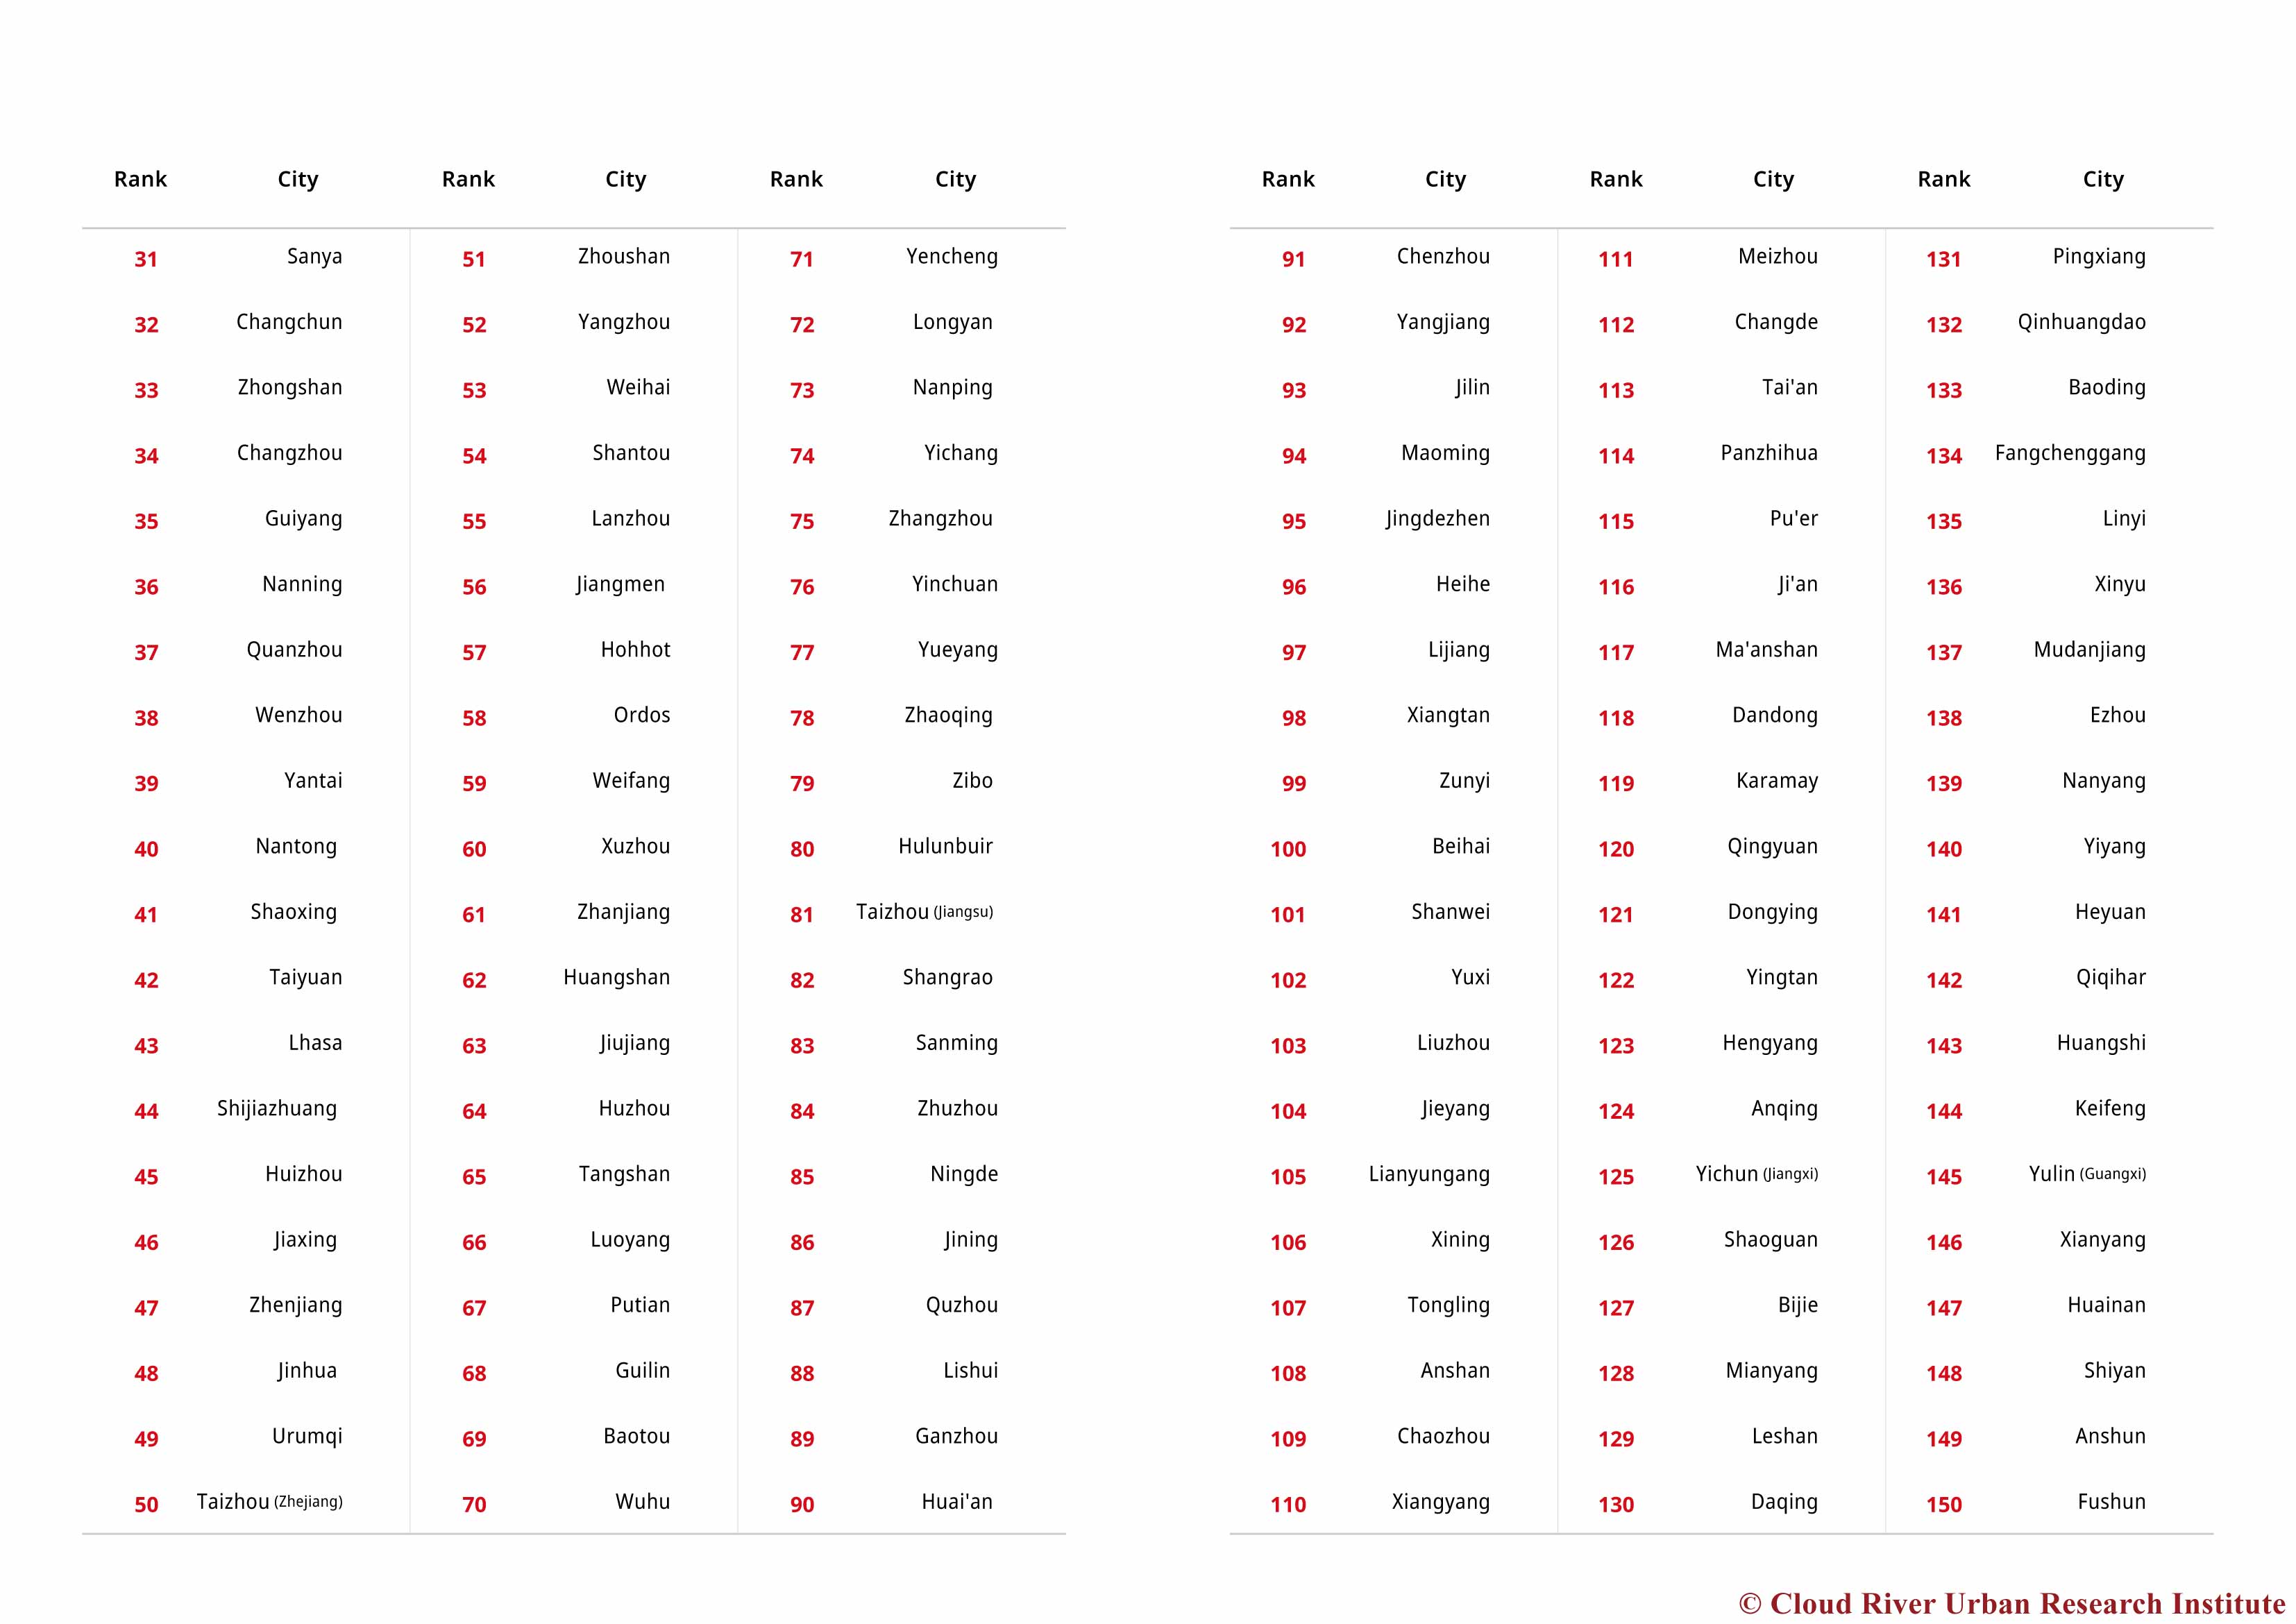
The 11th to 30th are Wuhan, Xiamen, Xi’an, Ningbo, Changsha, Zhengzhou, Qingdao, Dongguan, Fuzhou, Kunming, Hefei, Foshan, Wuxi, Jinan, Zhuhai, Shenyang, Guiyang, Dalian, Nanchang, and Quanzhou.
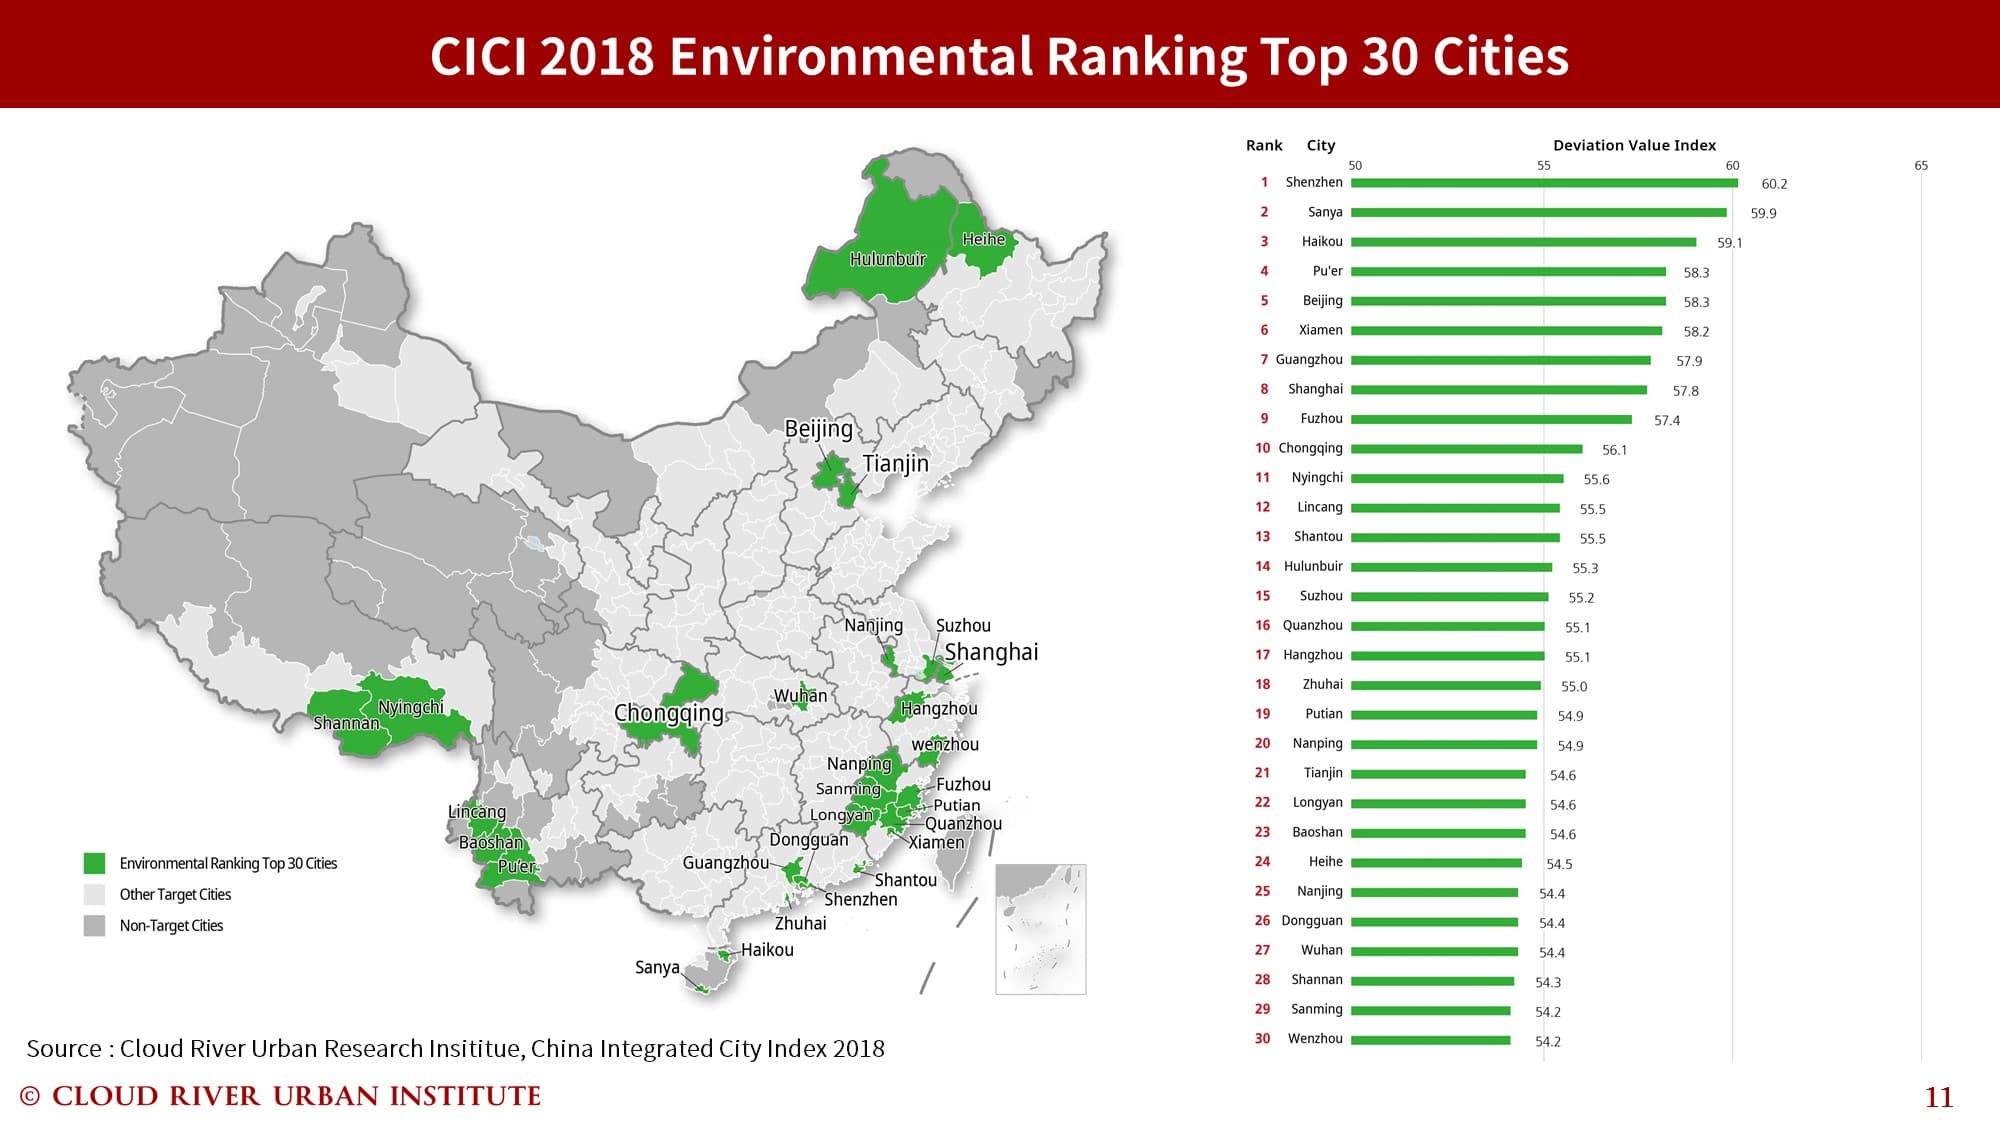
2. Ranking in environment dimension
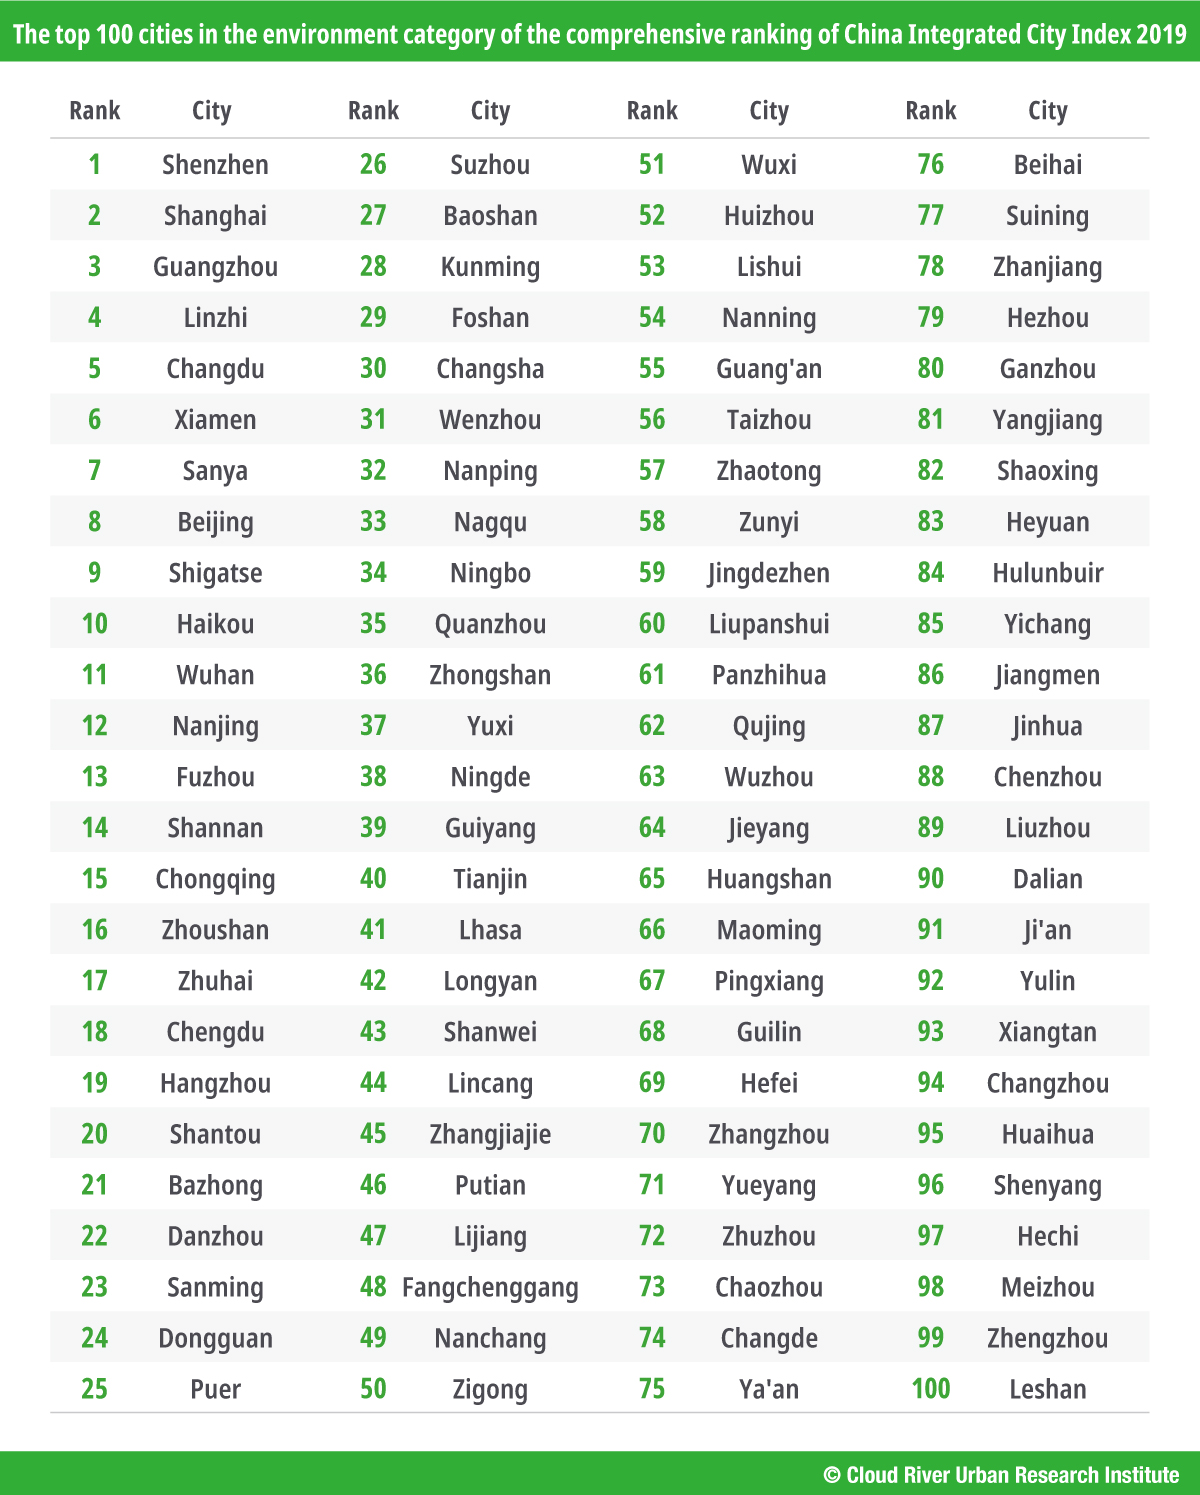
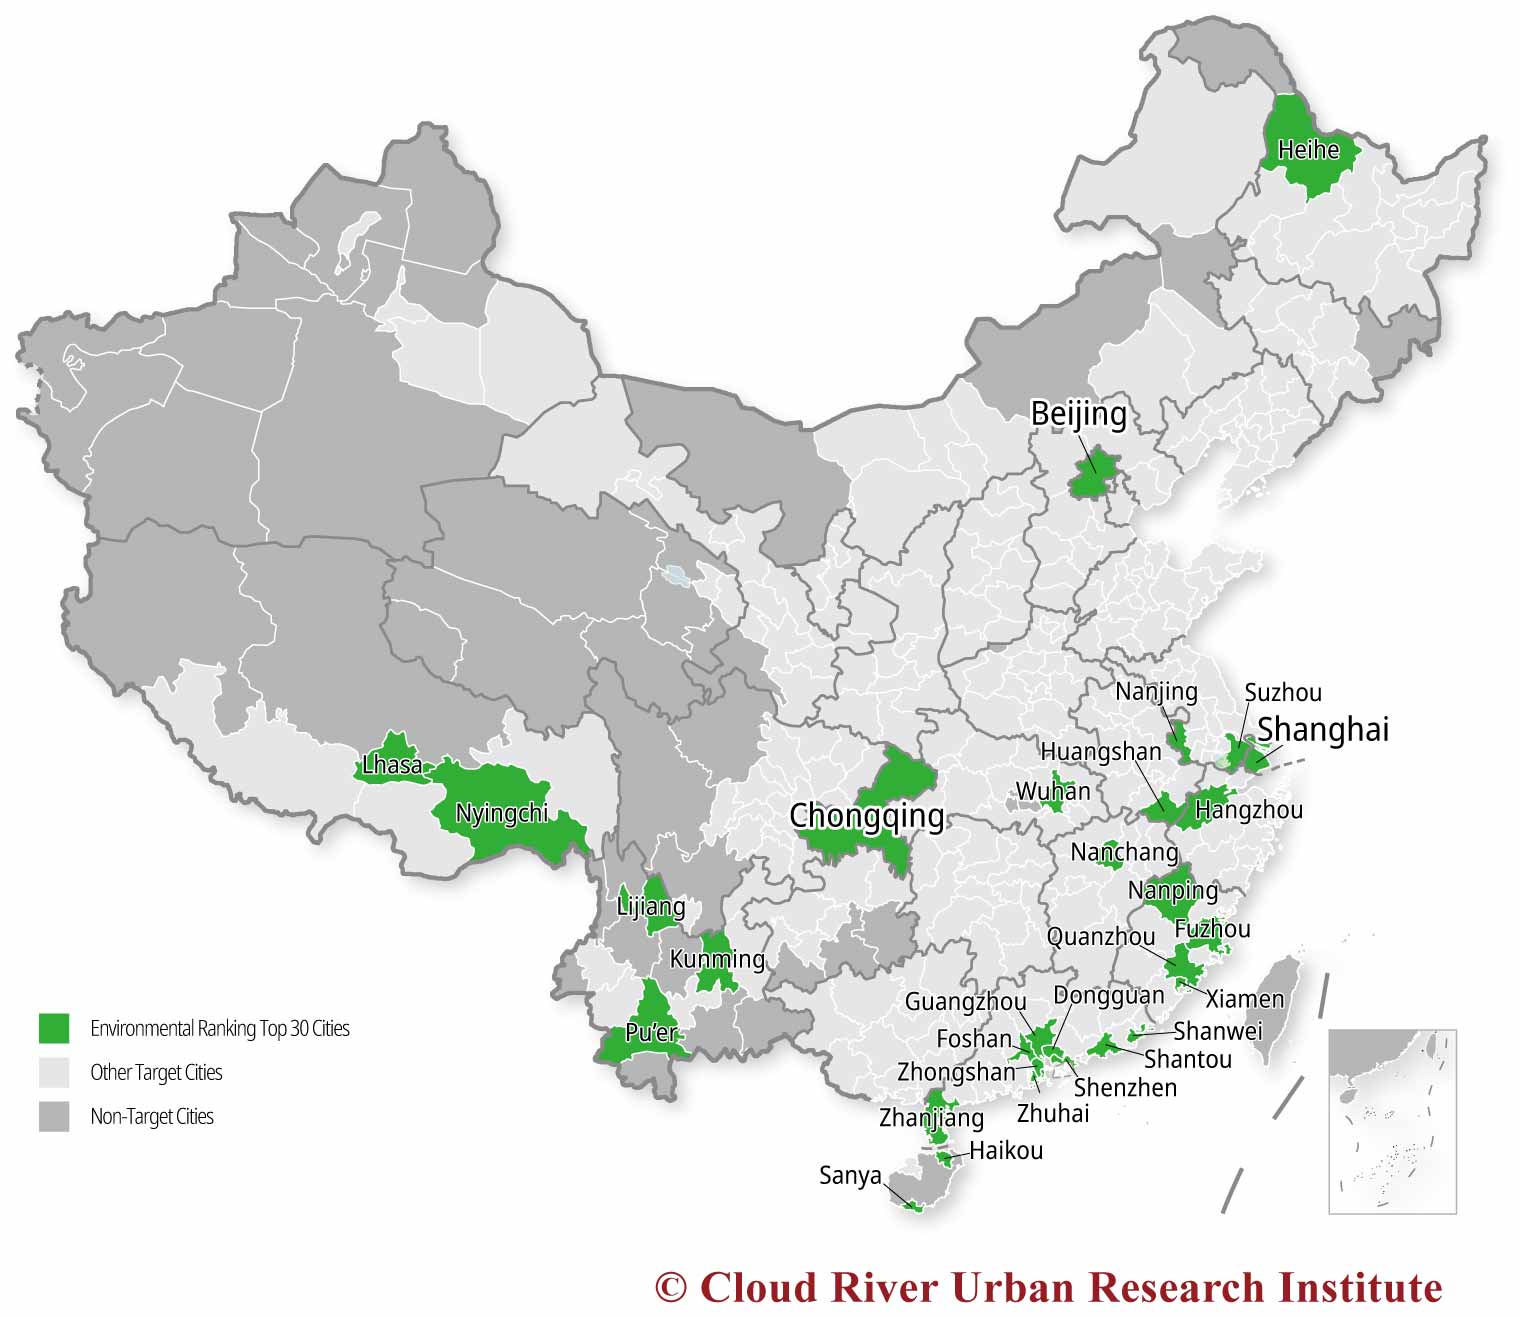
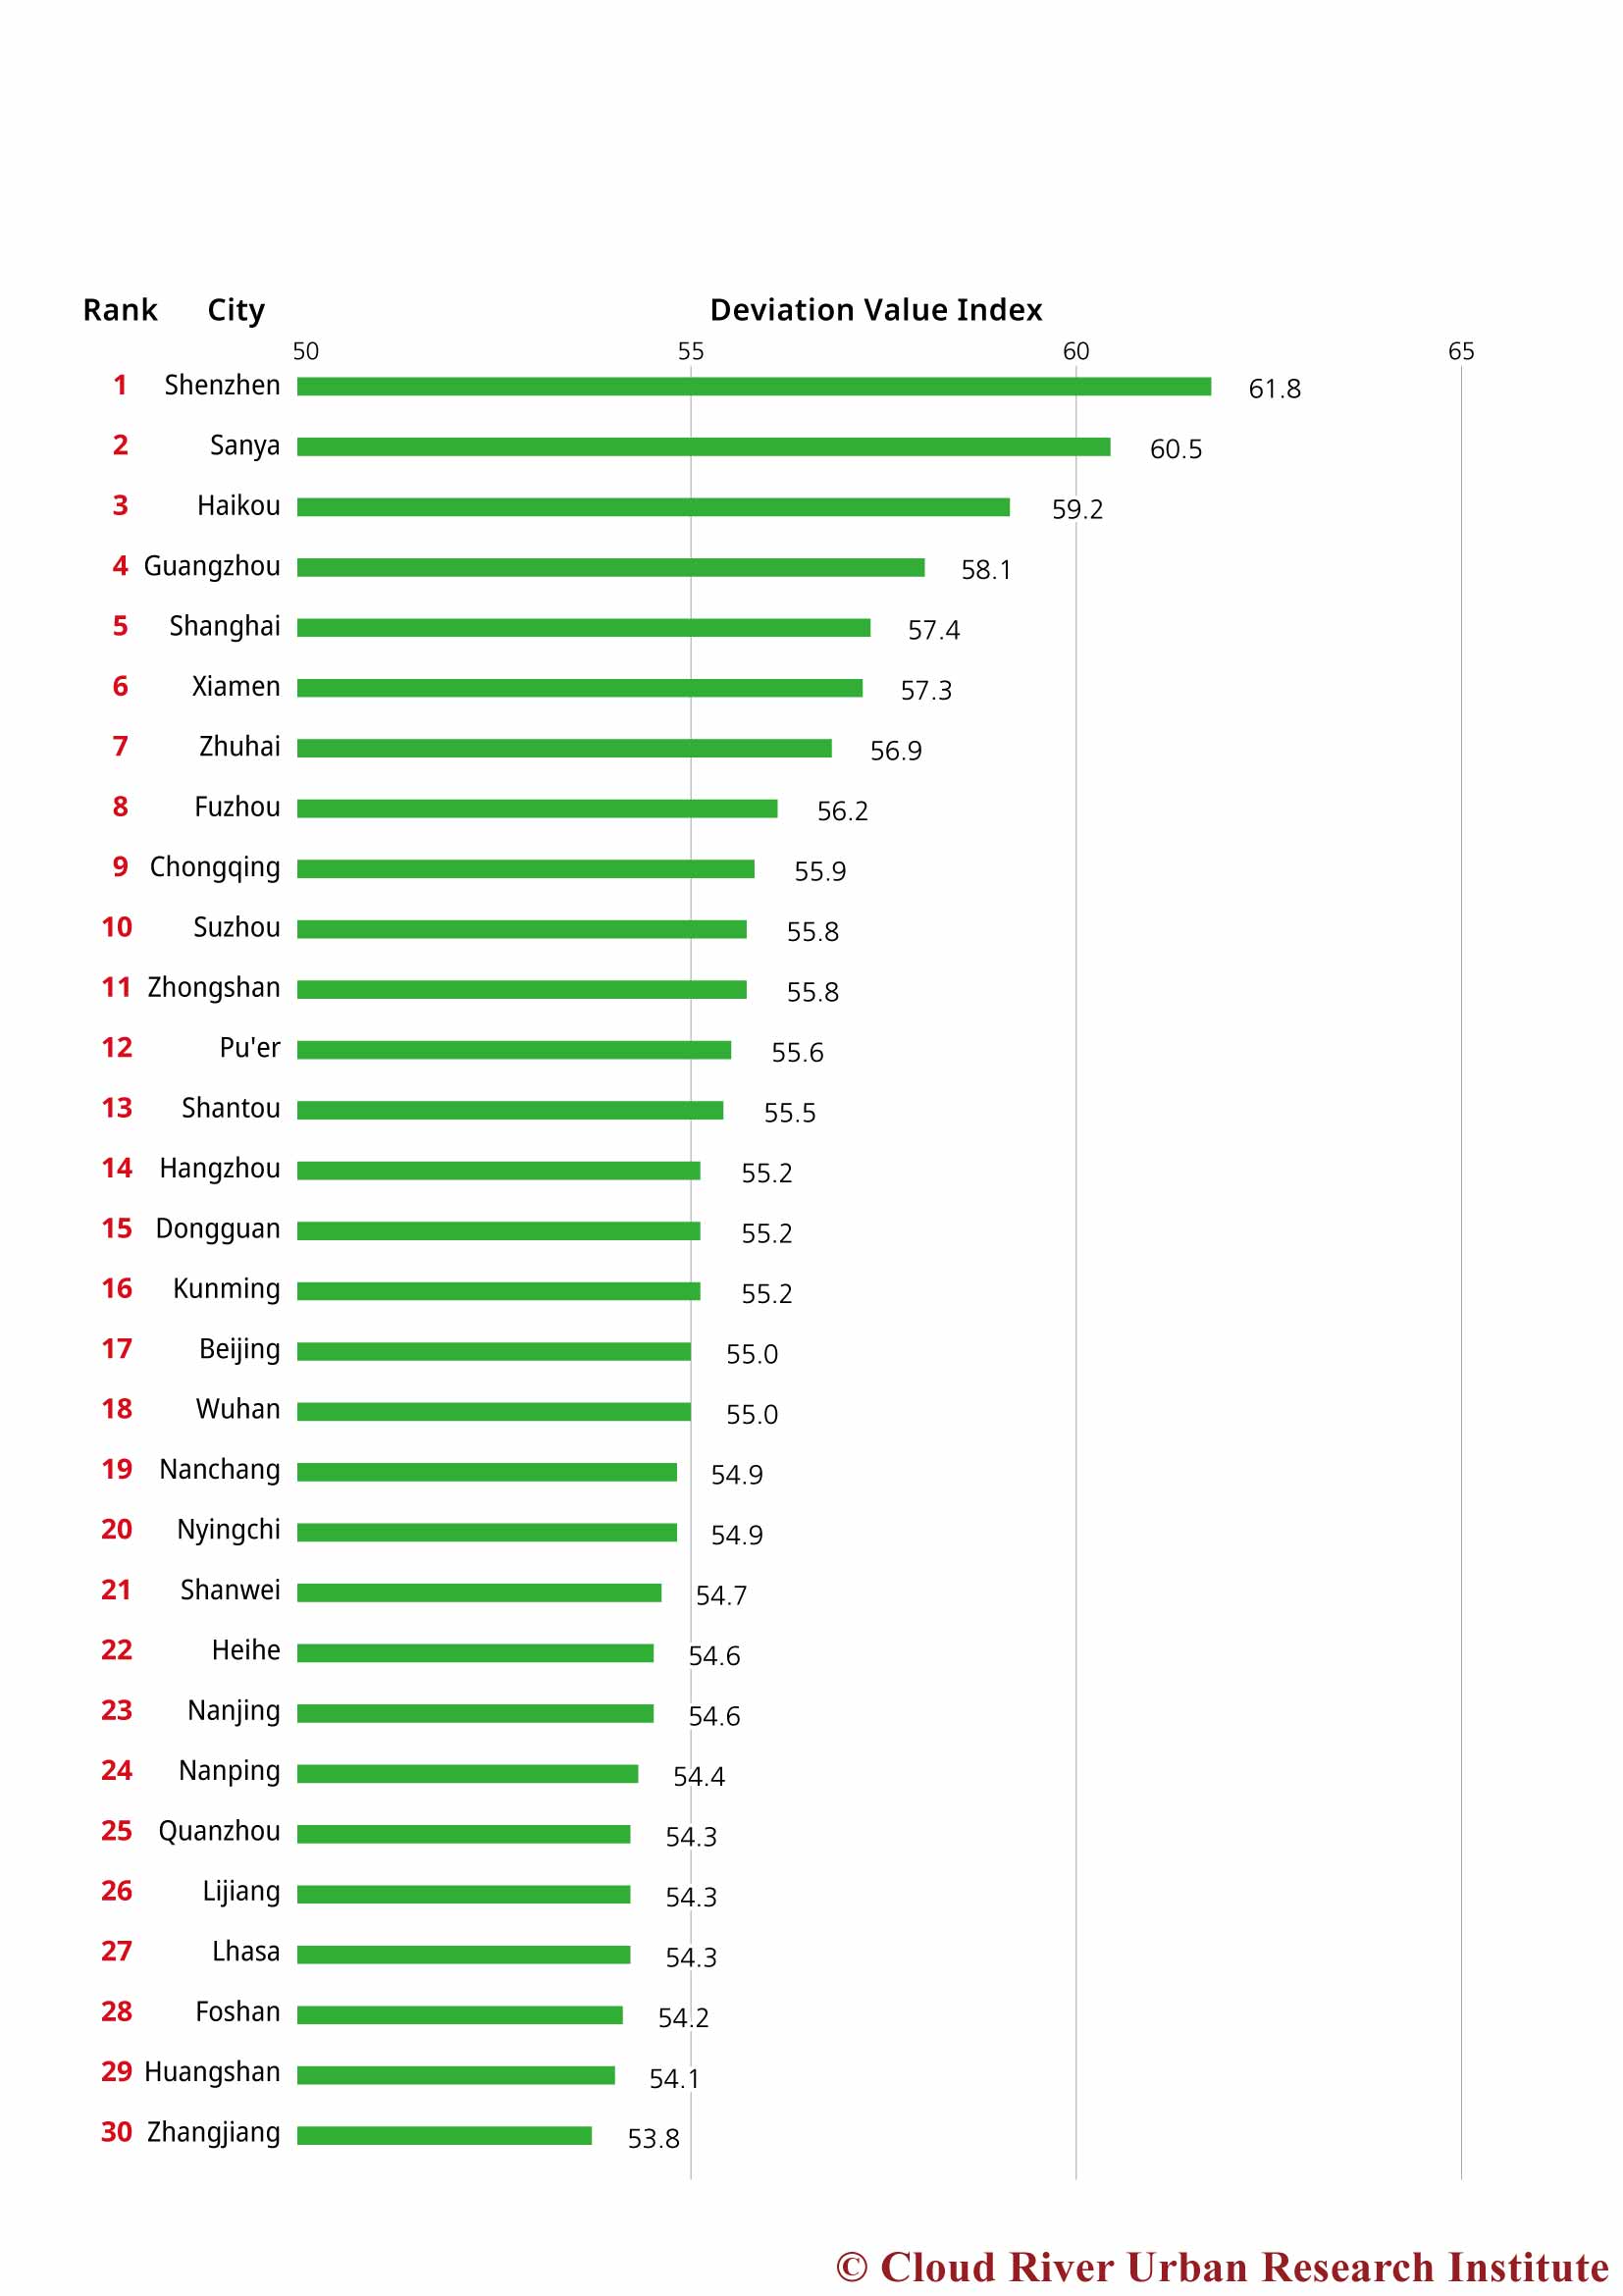
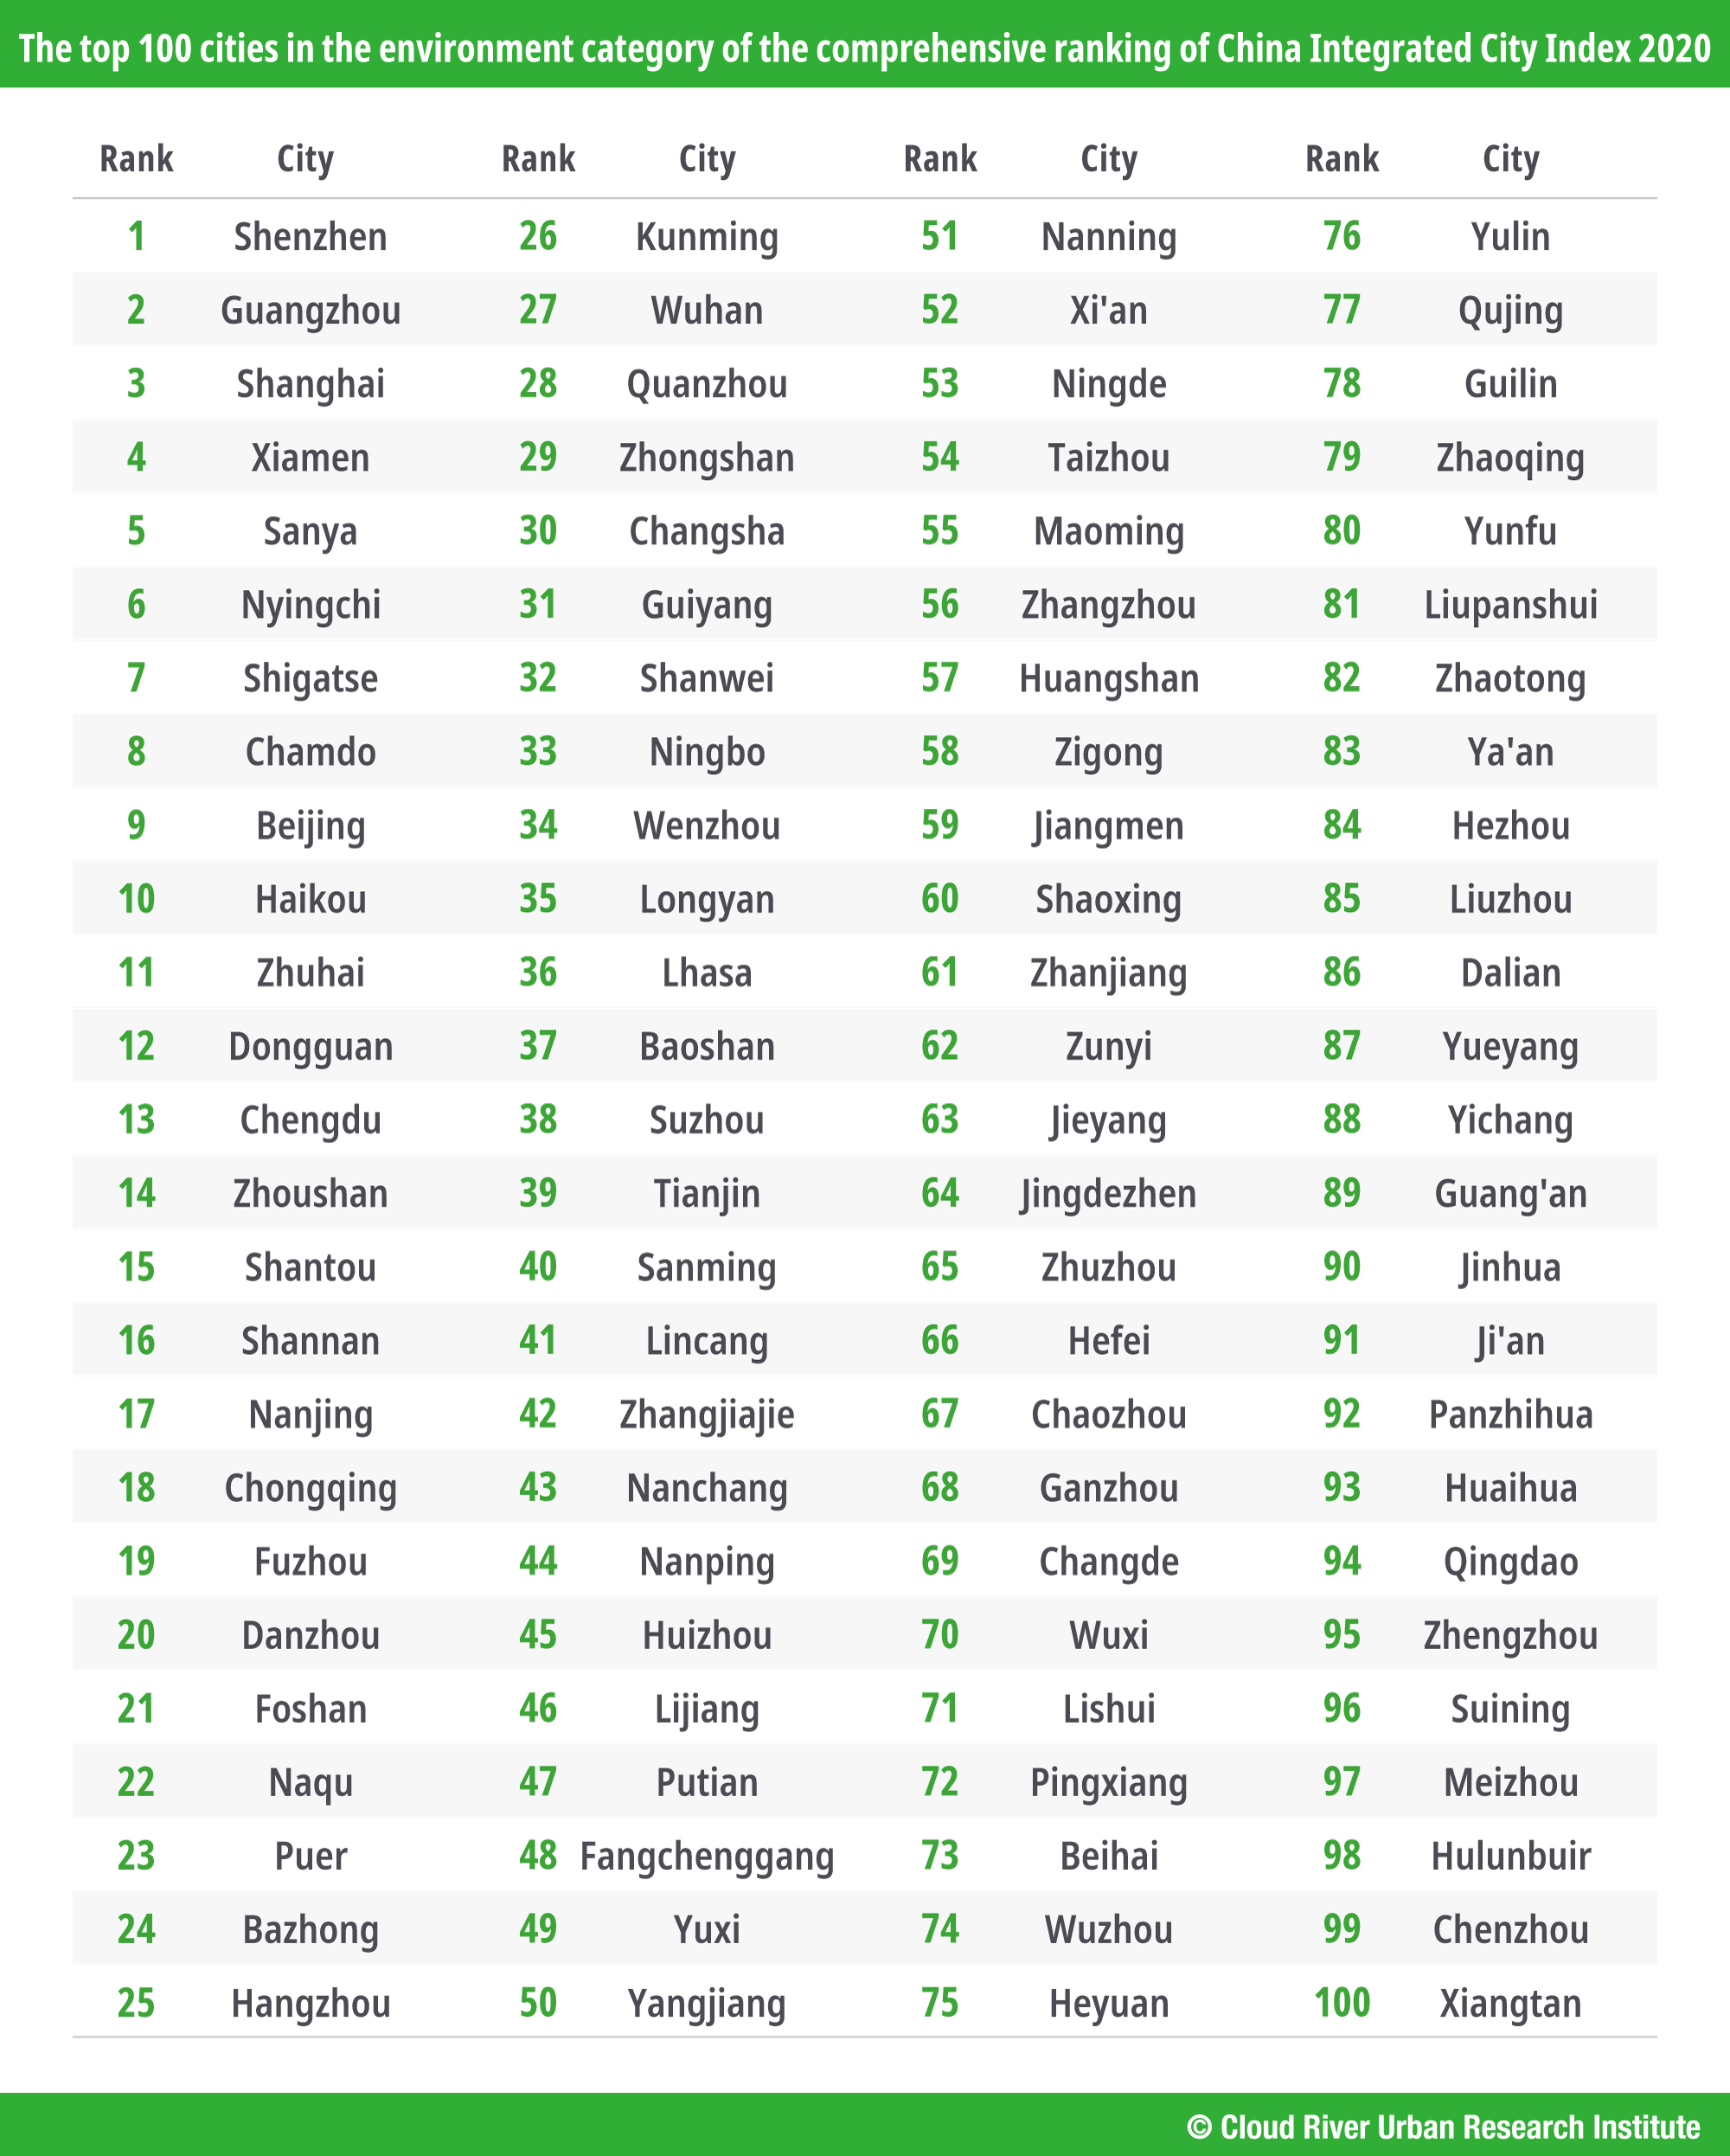
Shenzhen has ranked first in the environment dimension for five consecutive years, followed by Guangzhou in second place and Shanghai in third.
The top 10 Chinese cities in this dimension in 2020 are Shenzhen, Guangzhou, Shanghai, Xiamen, Sanya, Nyingchi, Shigatse, Chamdo, Beijing, and Haikou. Xiamen, Sanya, and Xigaze rose to fourth, fifth, and seventh place, respectively.
The 11th to 30th are Zhuhai, Dongguan, Chengdu, Zhoushan, Shantou, Shannan, Nanjing, Chongqing, Fuzhou, Danzhou, Foshan, Naqu, Puer,Bazhong, Hangzhou, Kunming, Wuhan, Quanzhou, Zhongshan, and Changsha.
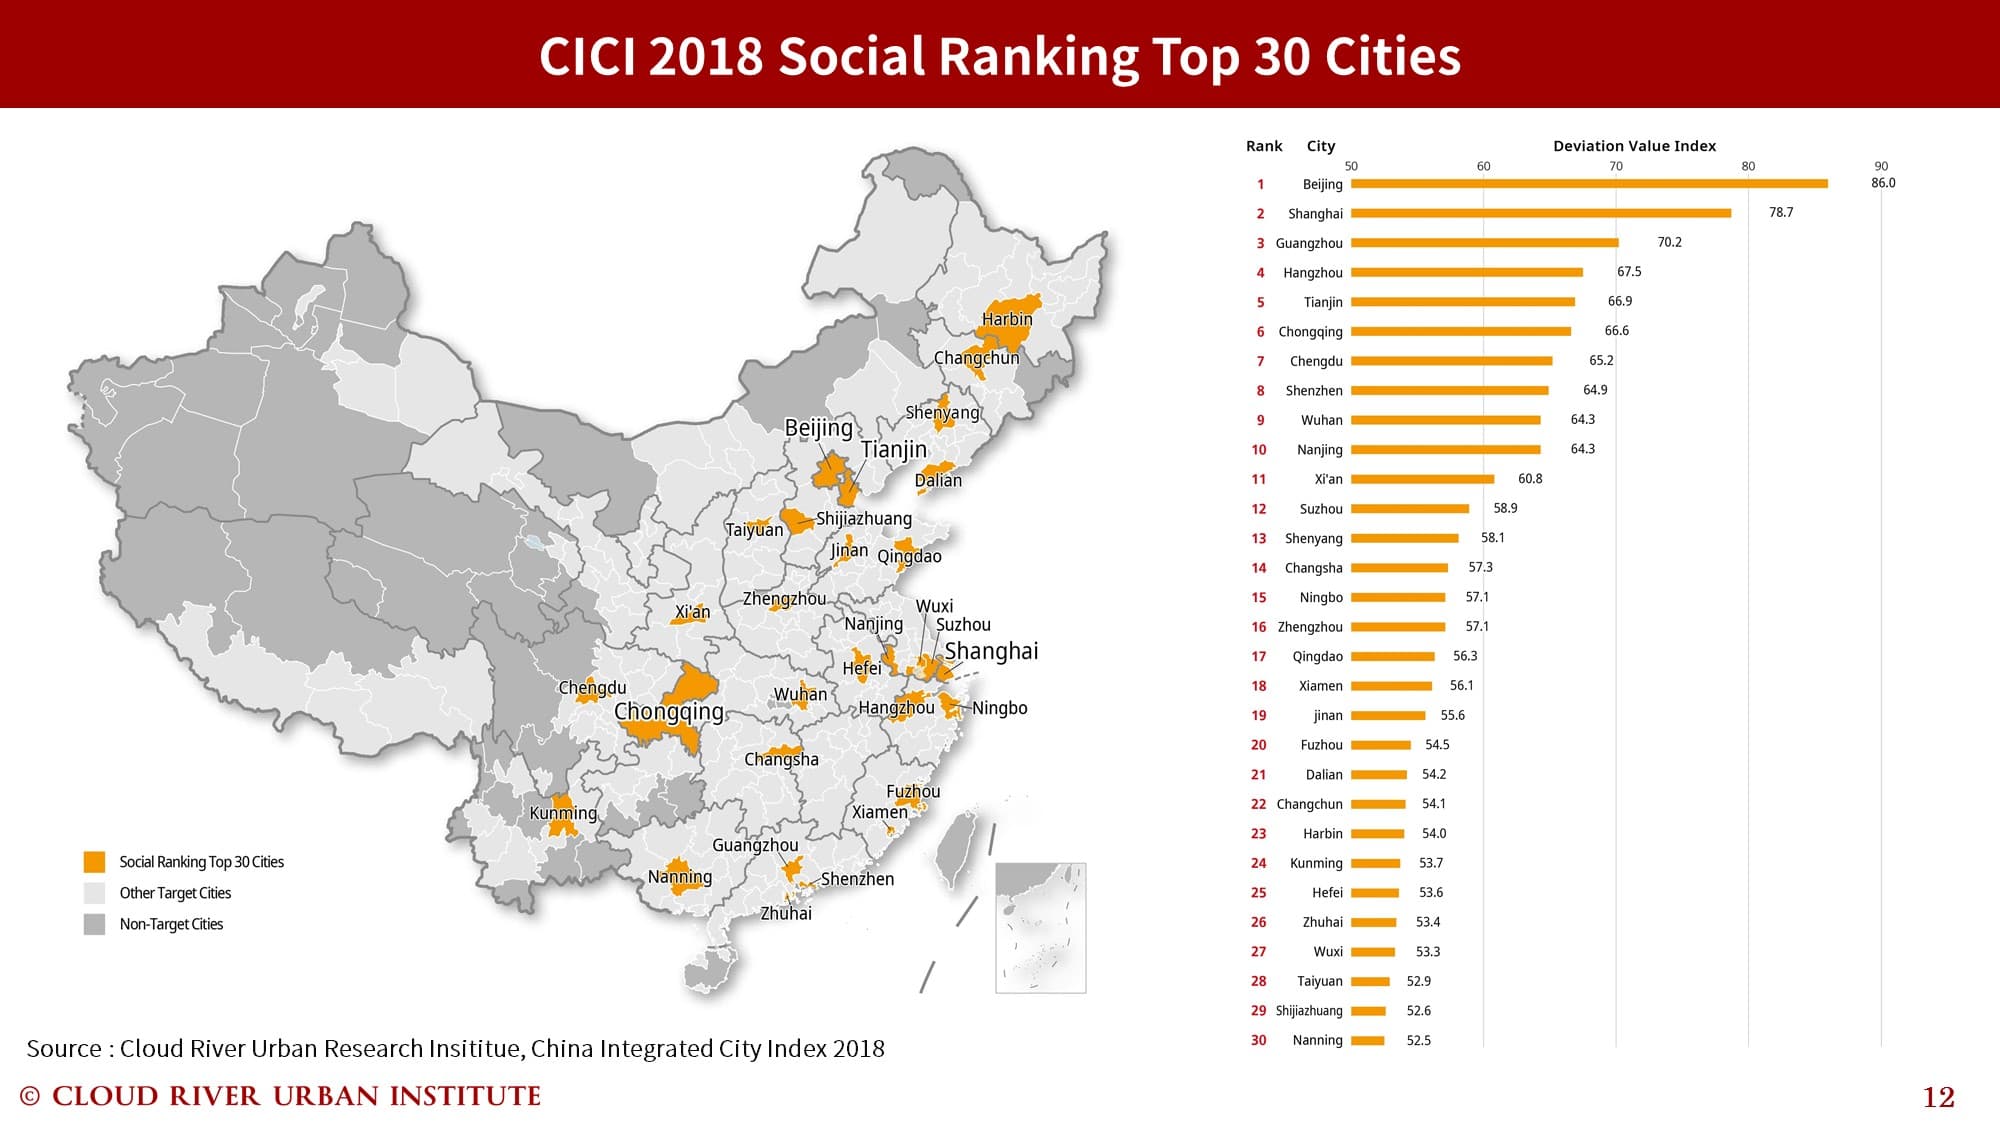
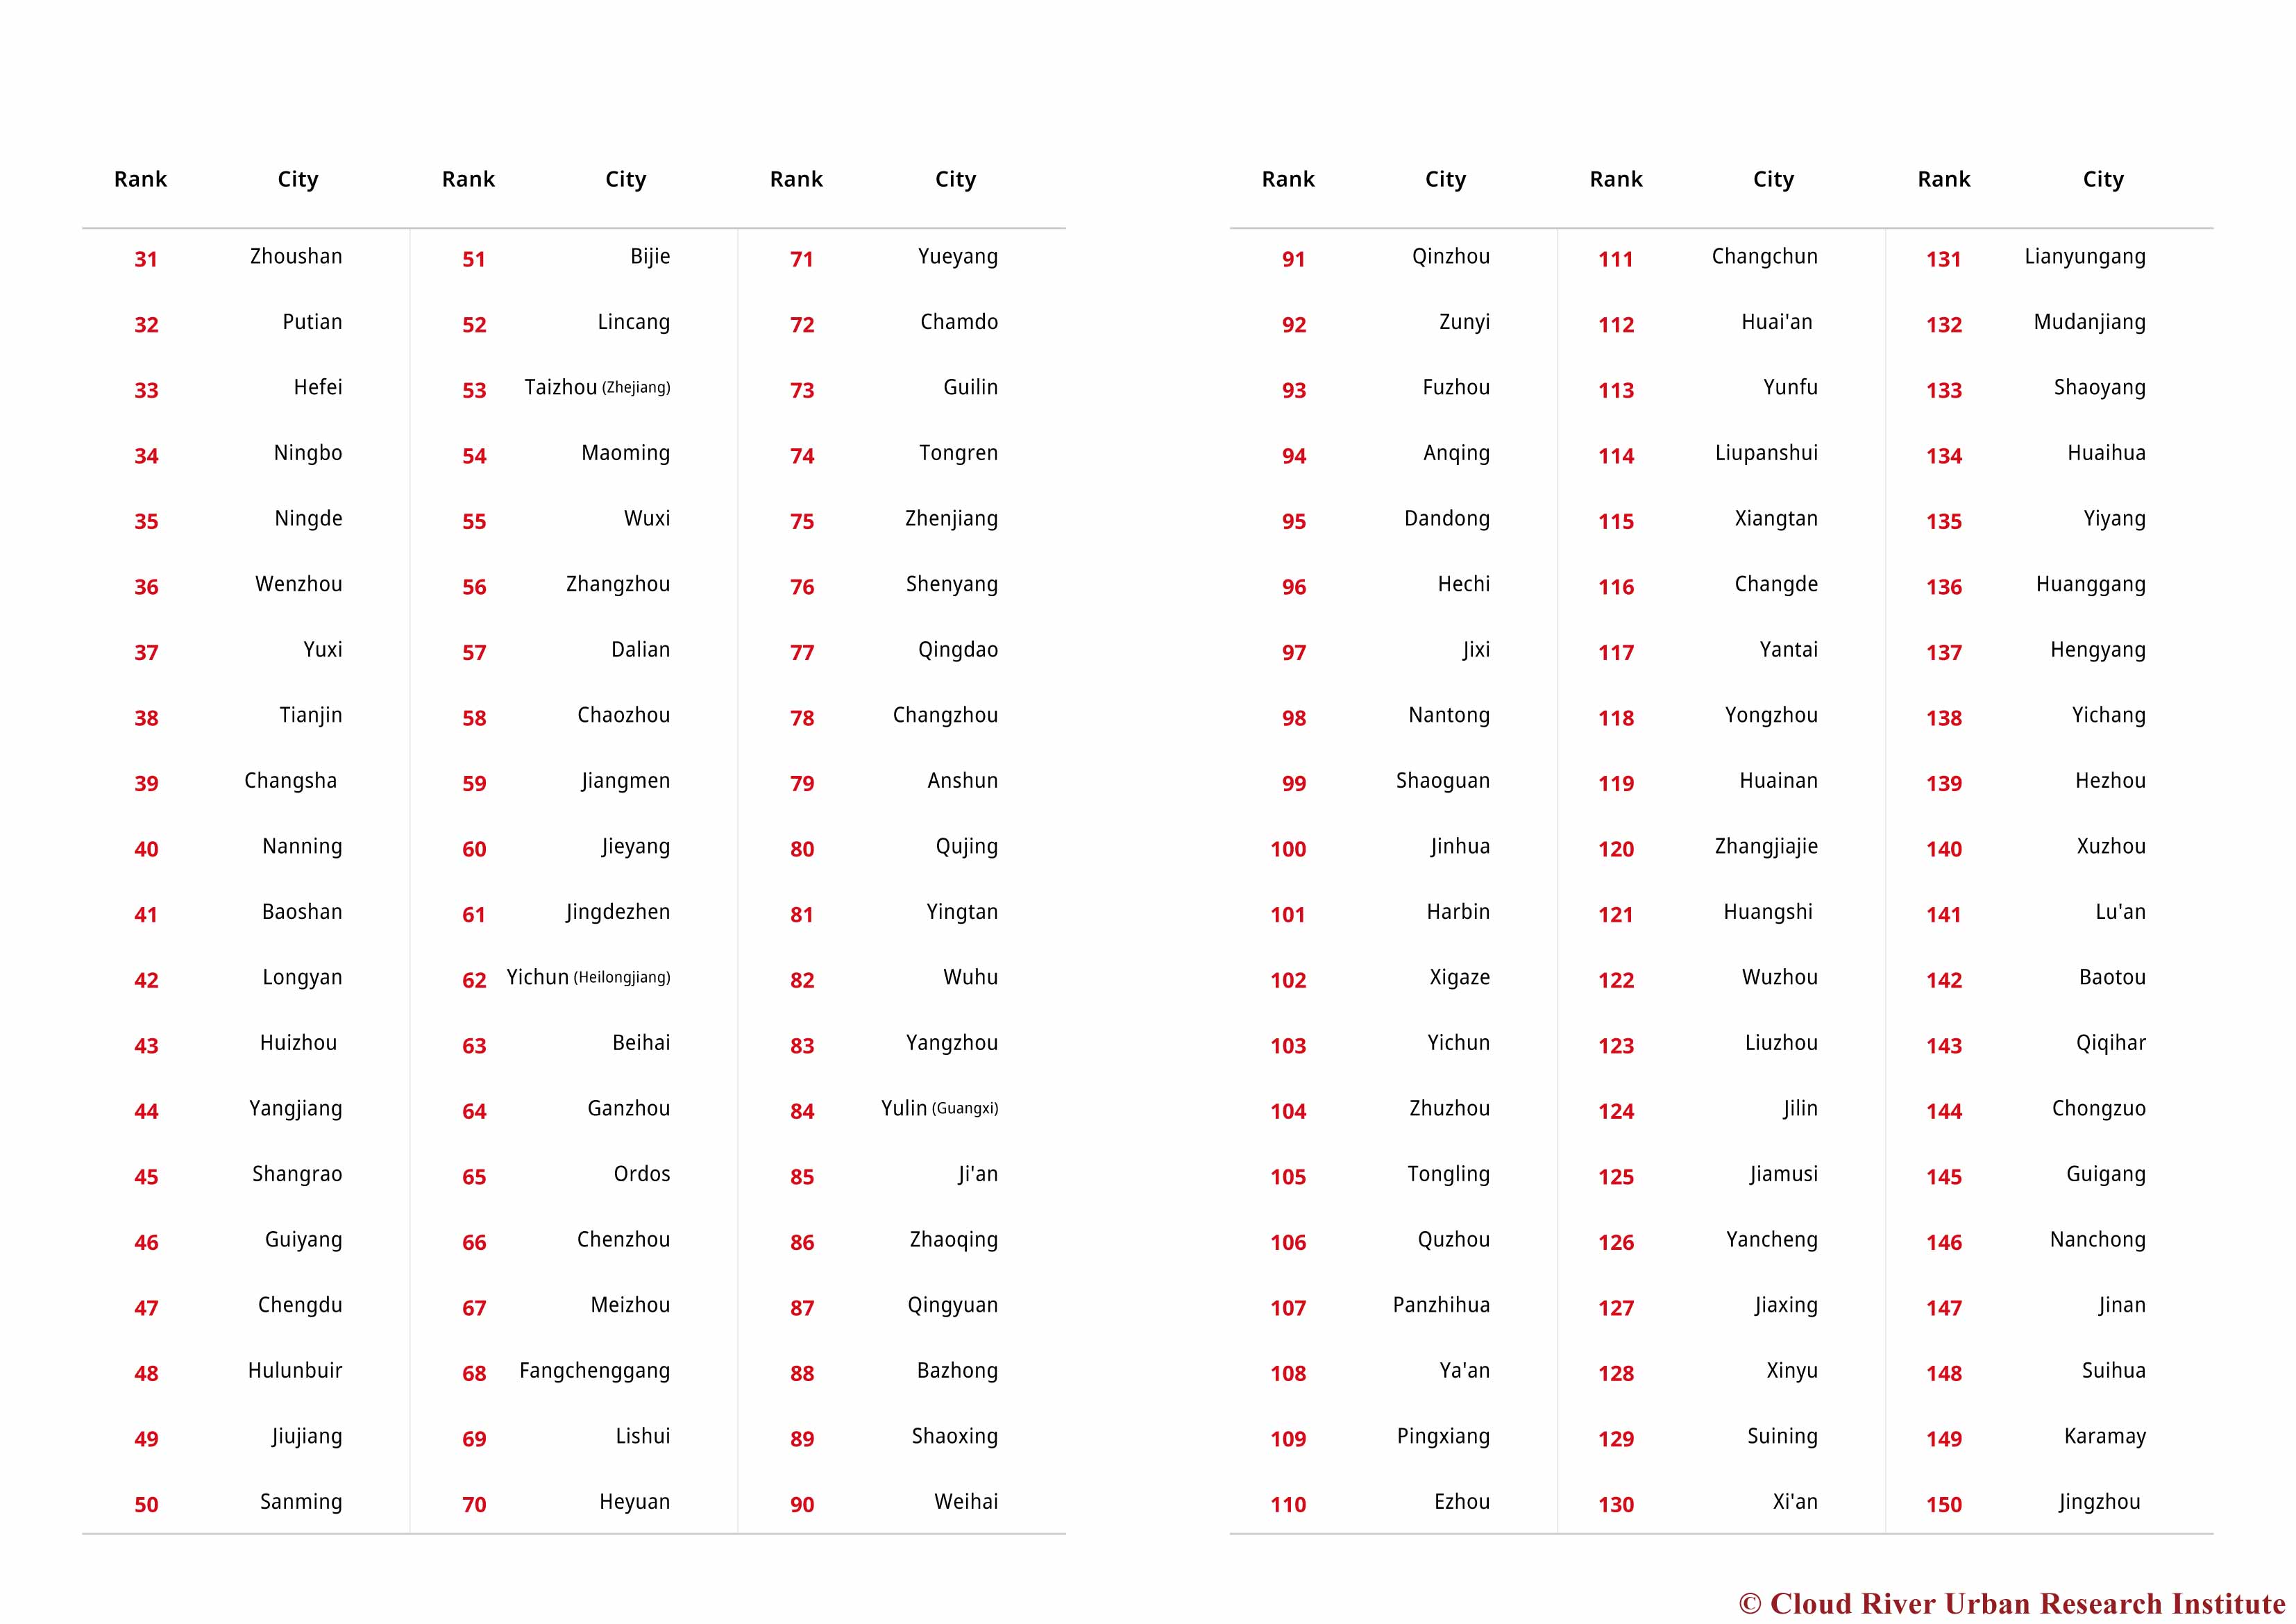
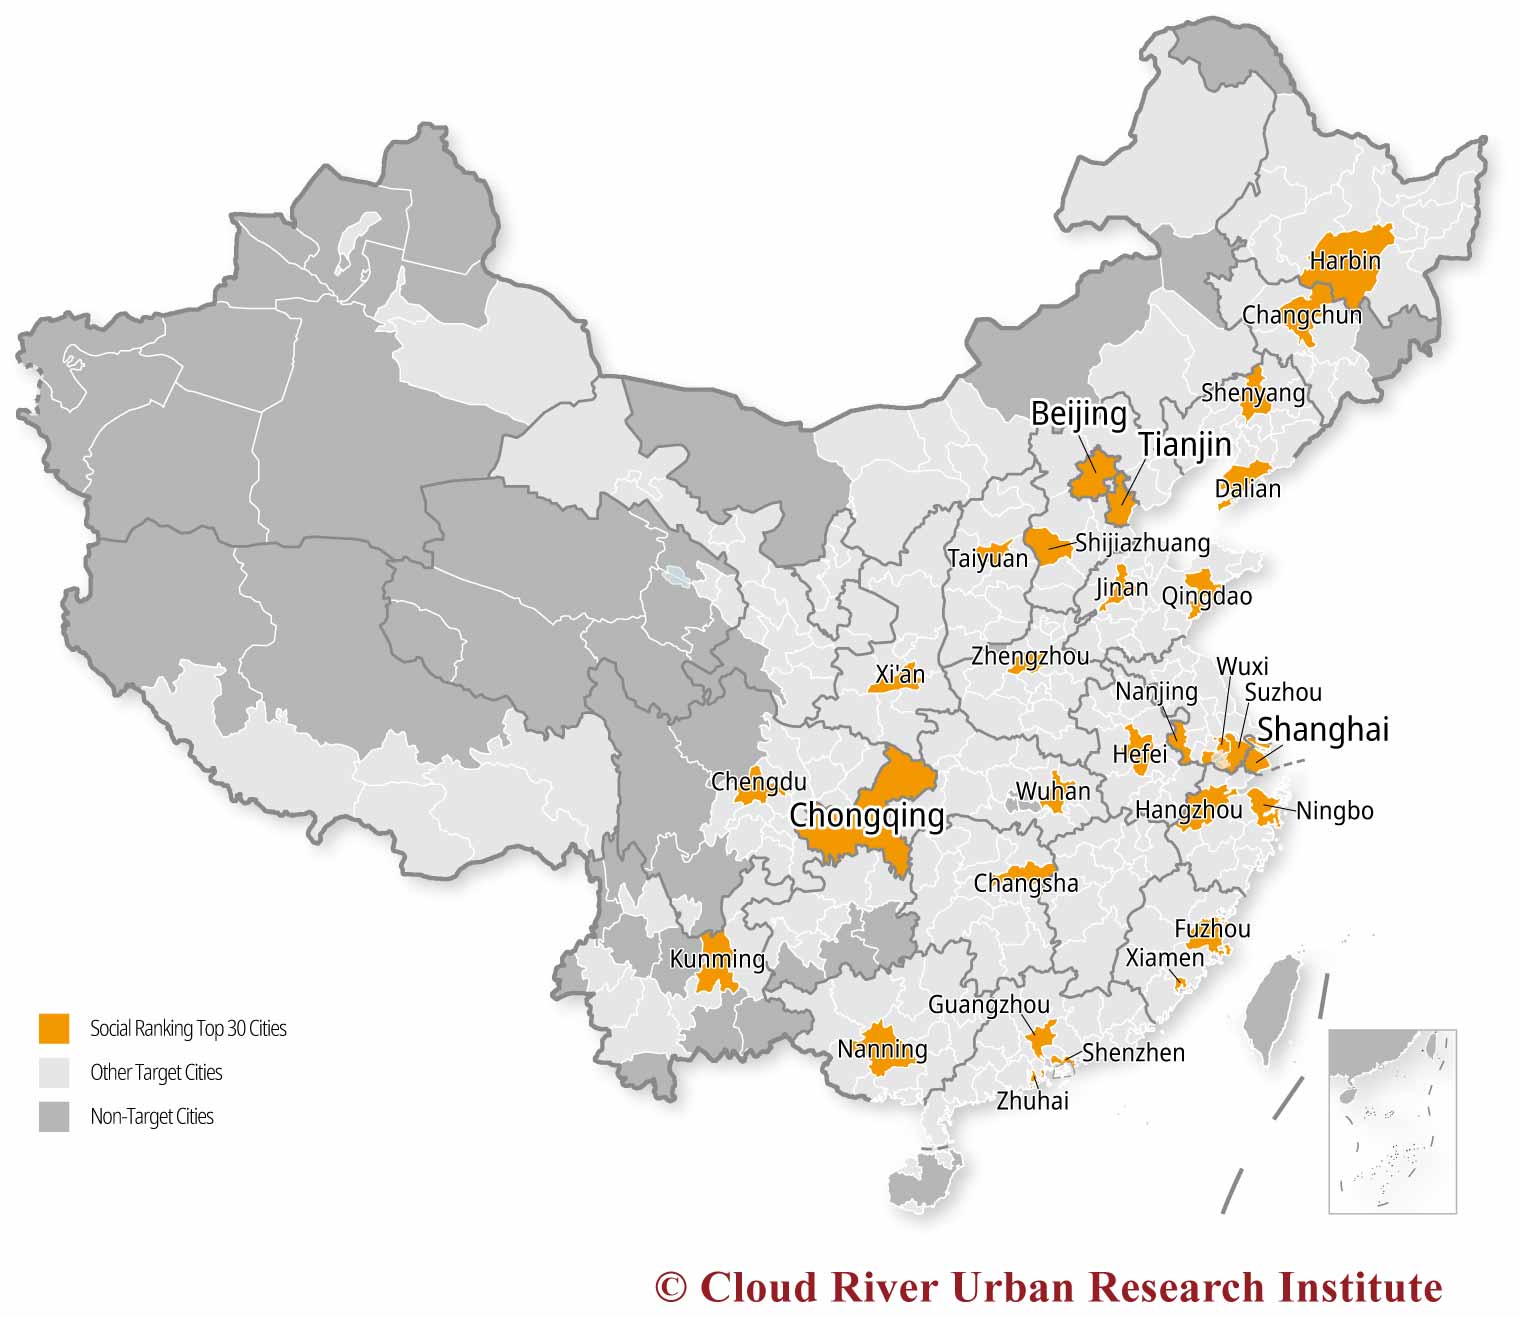
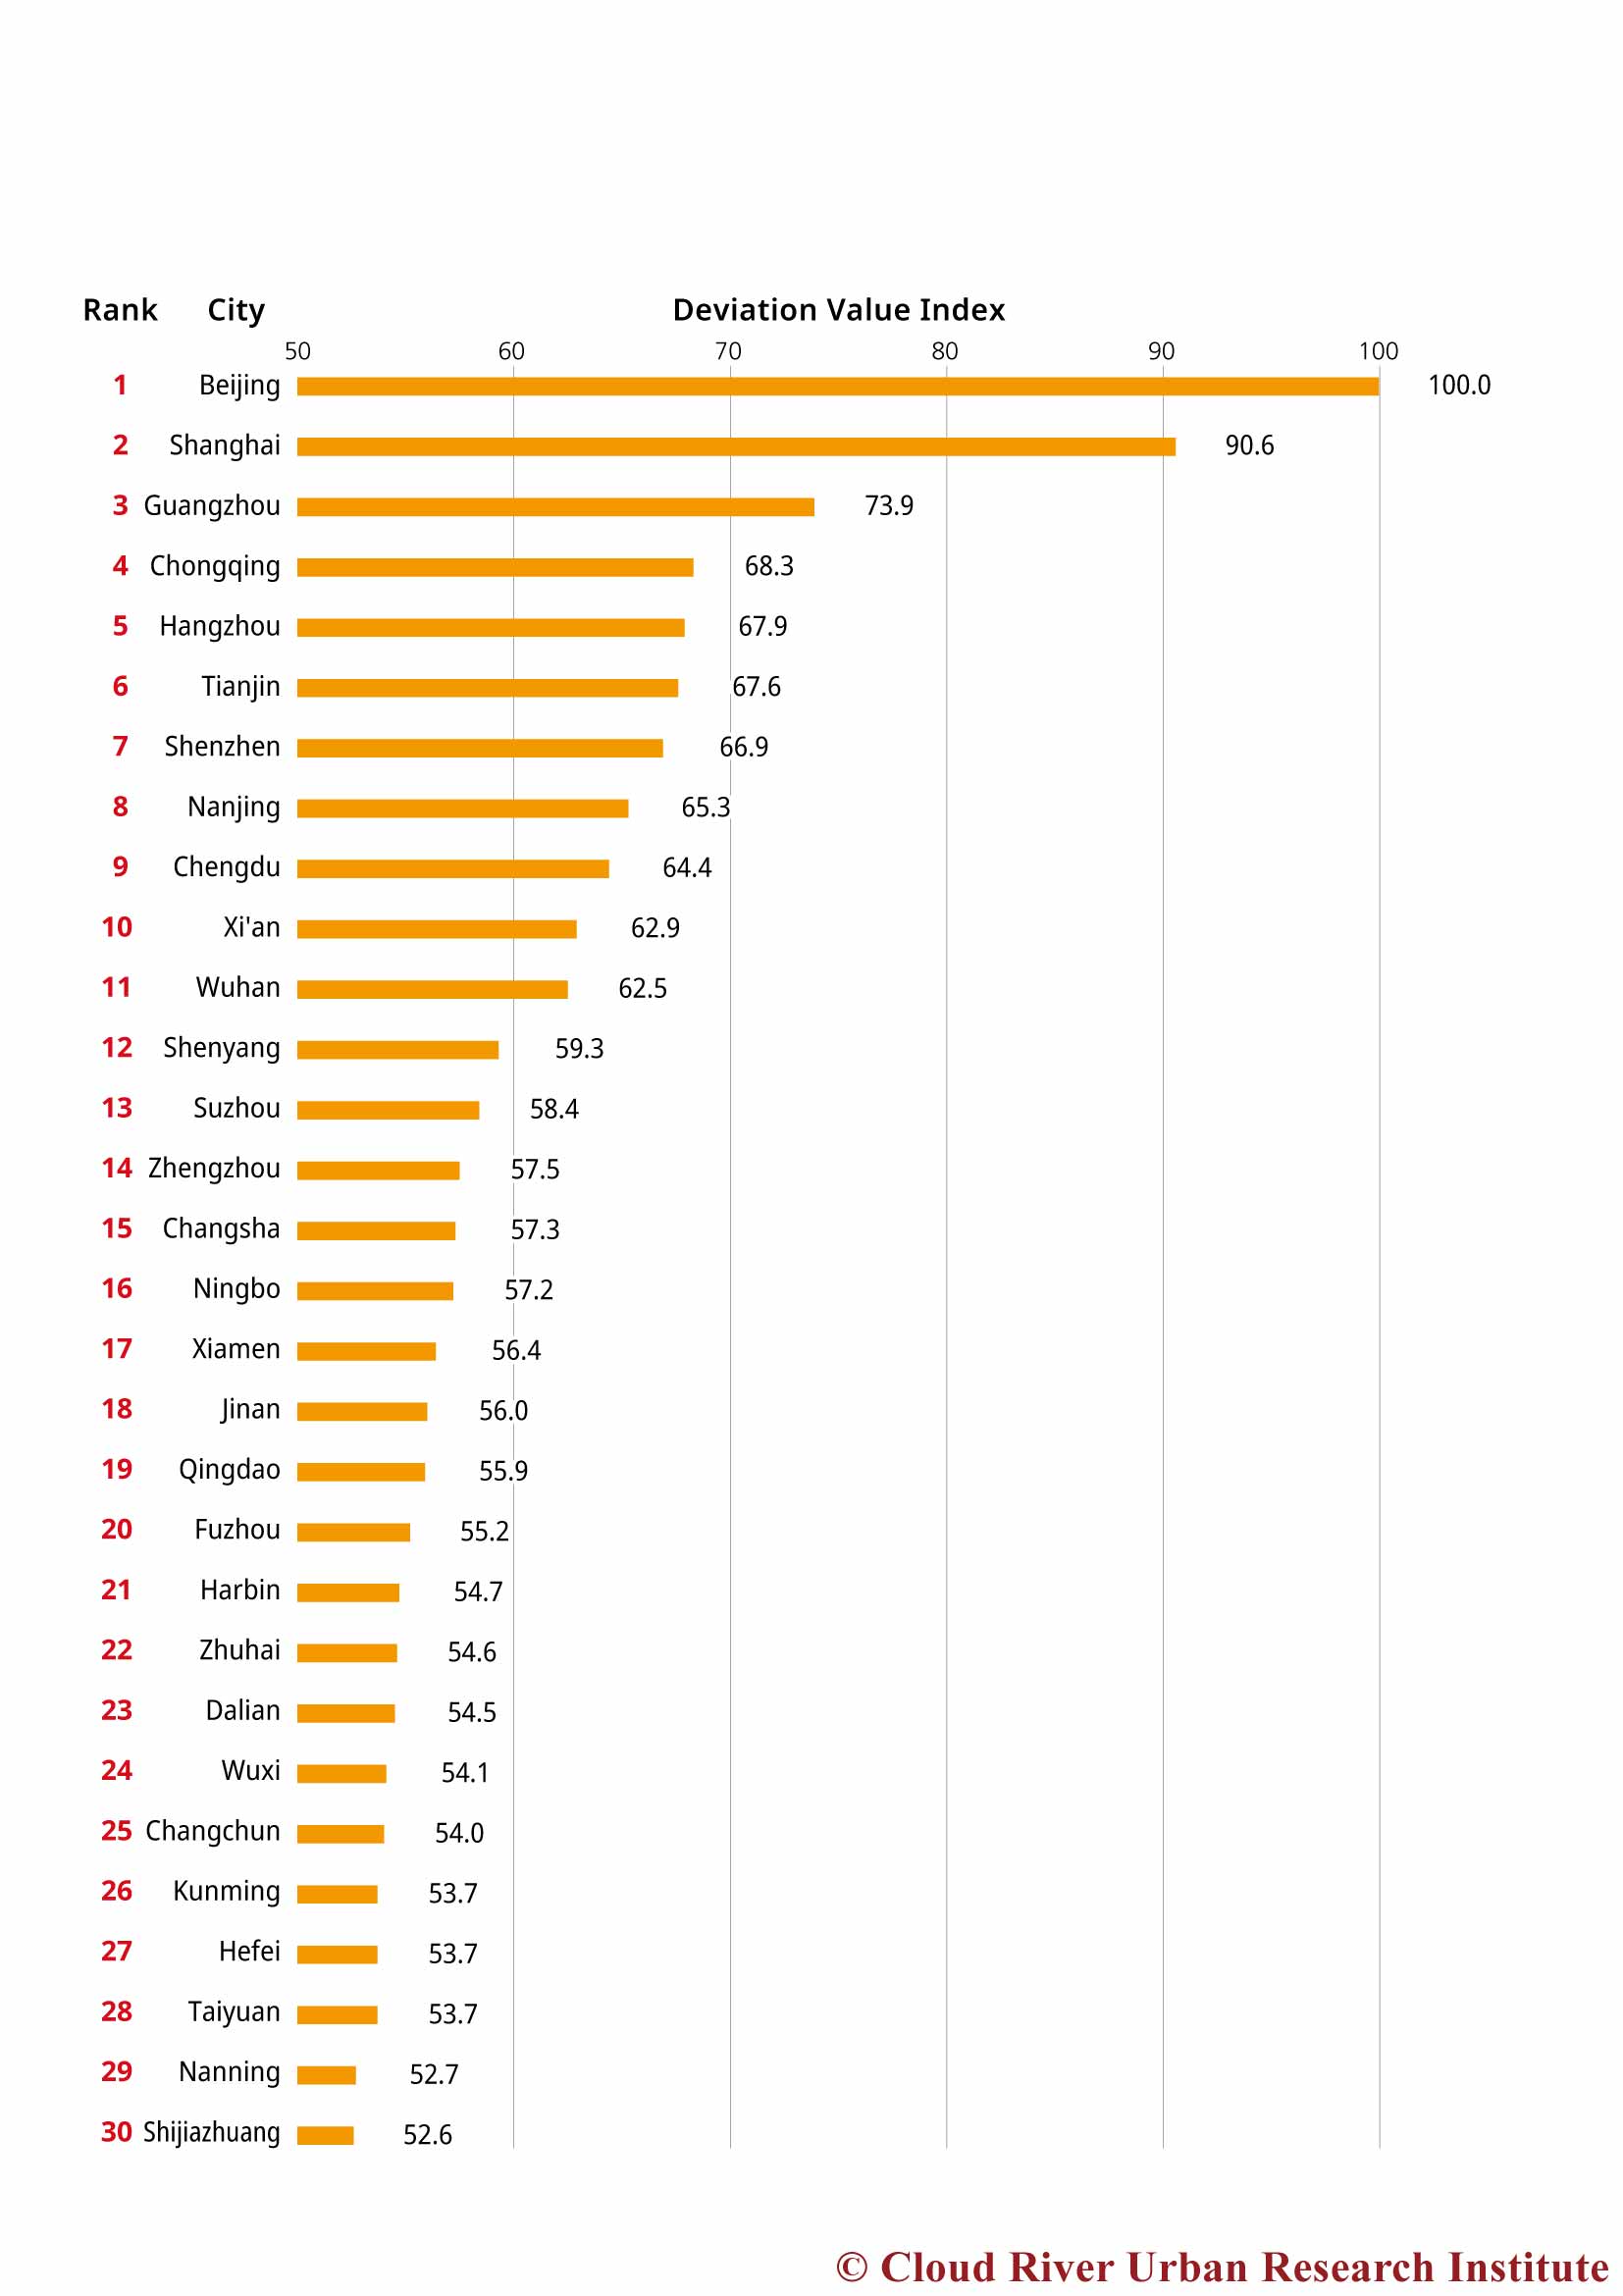
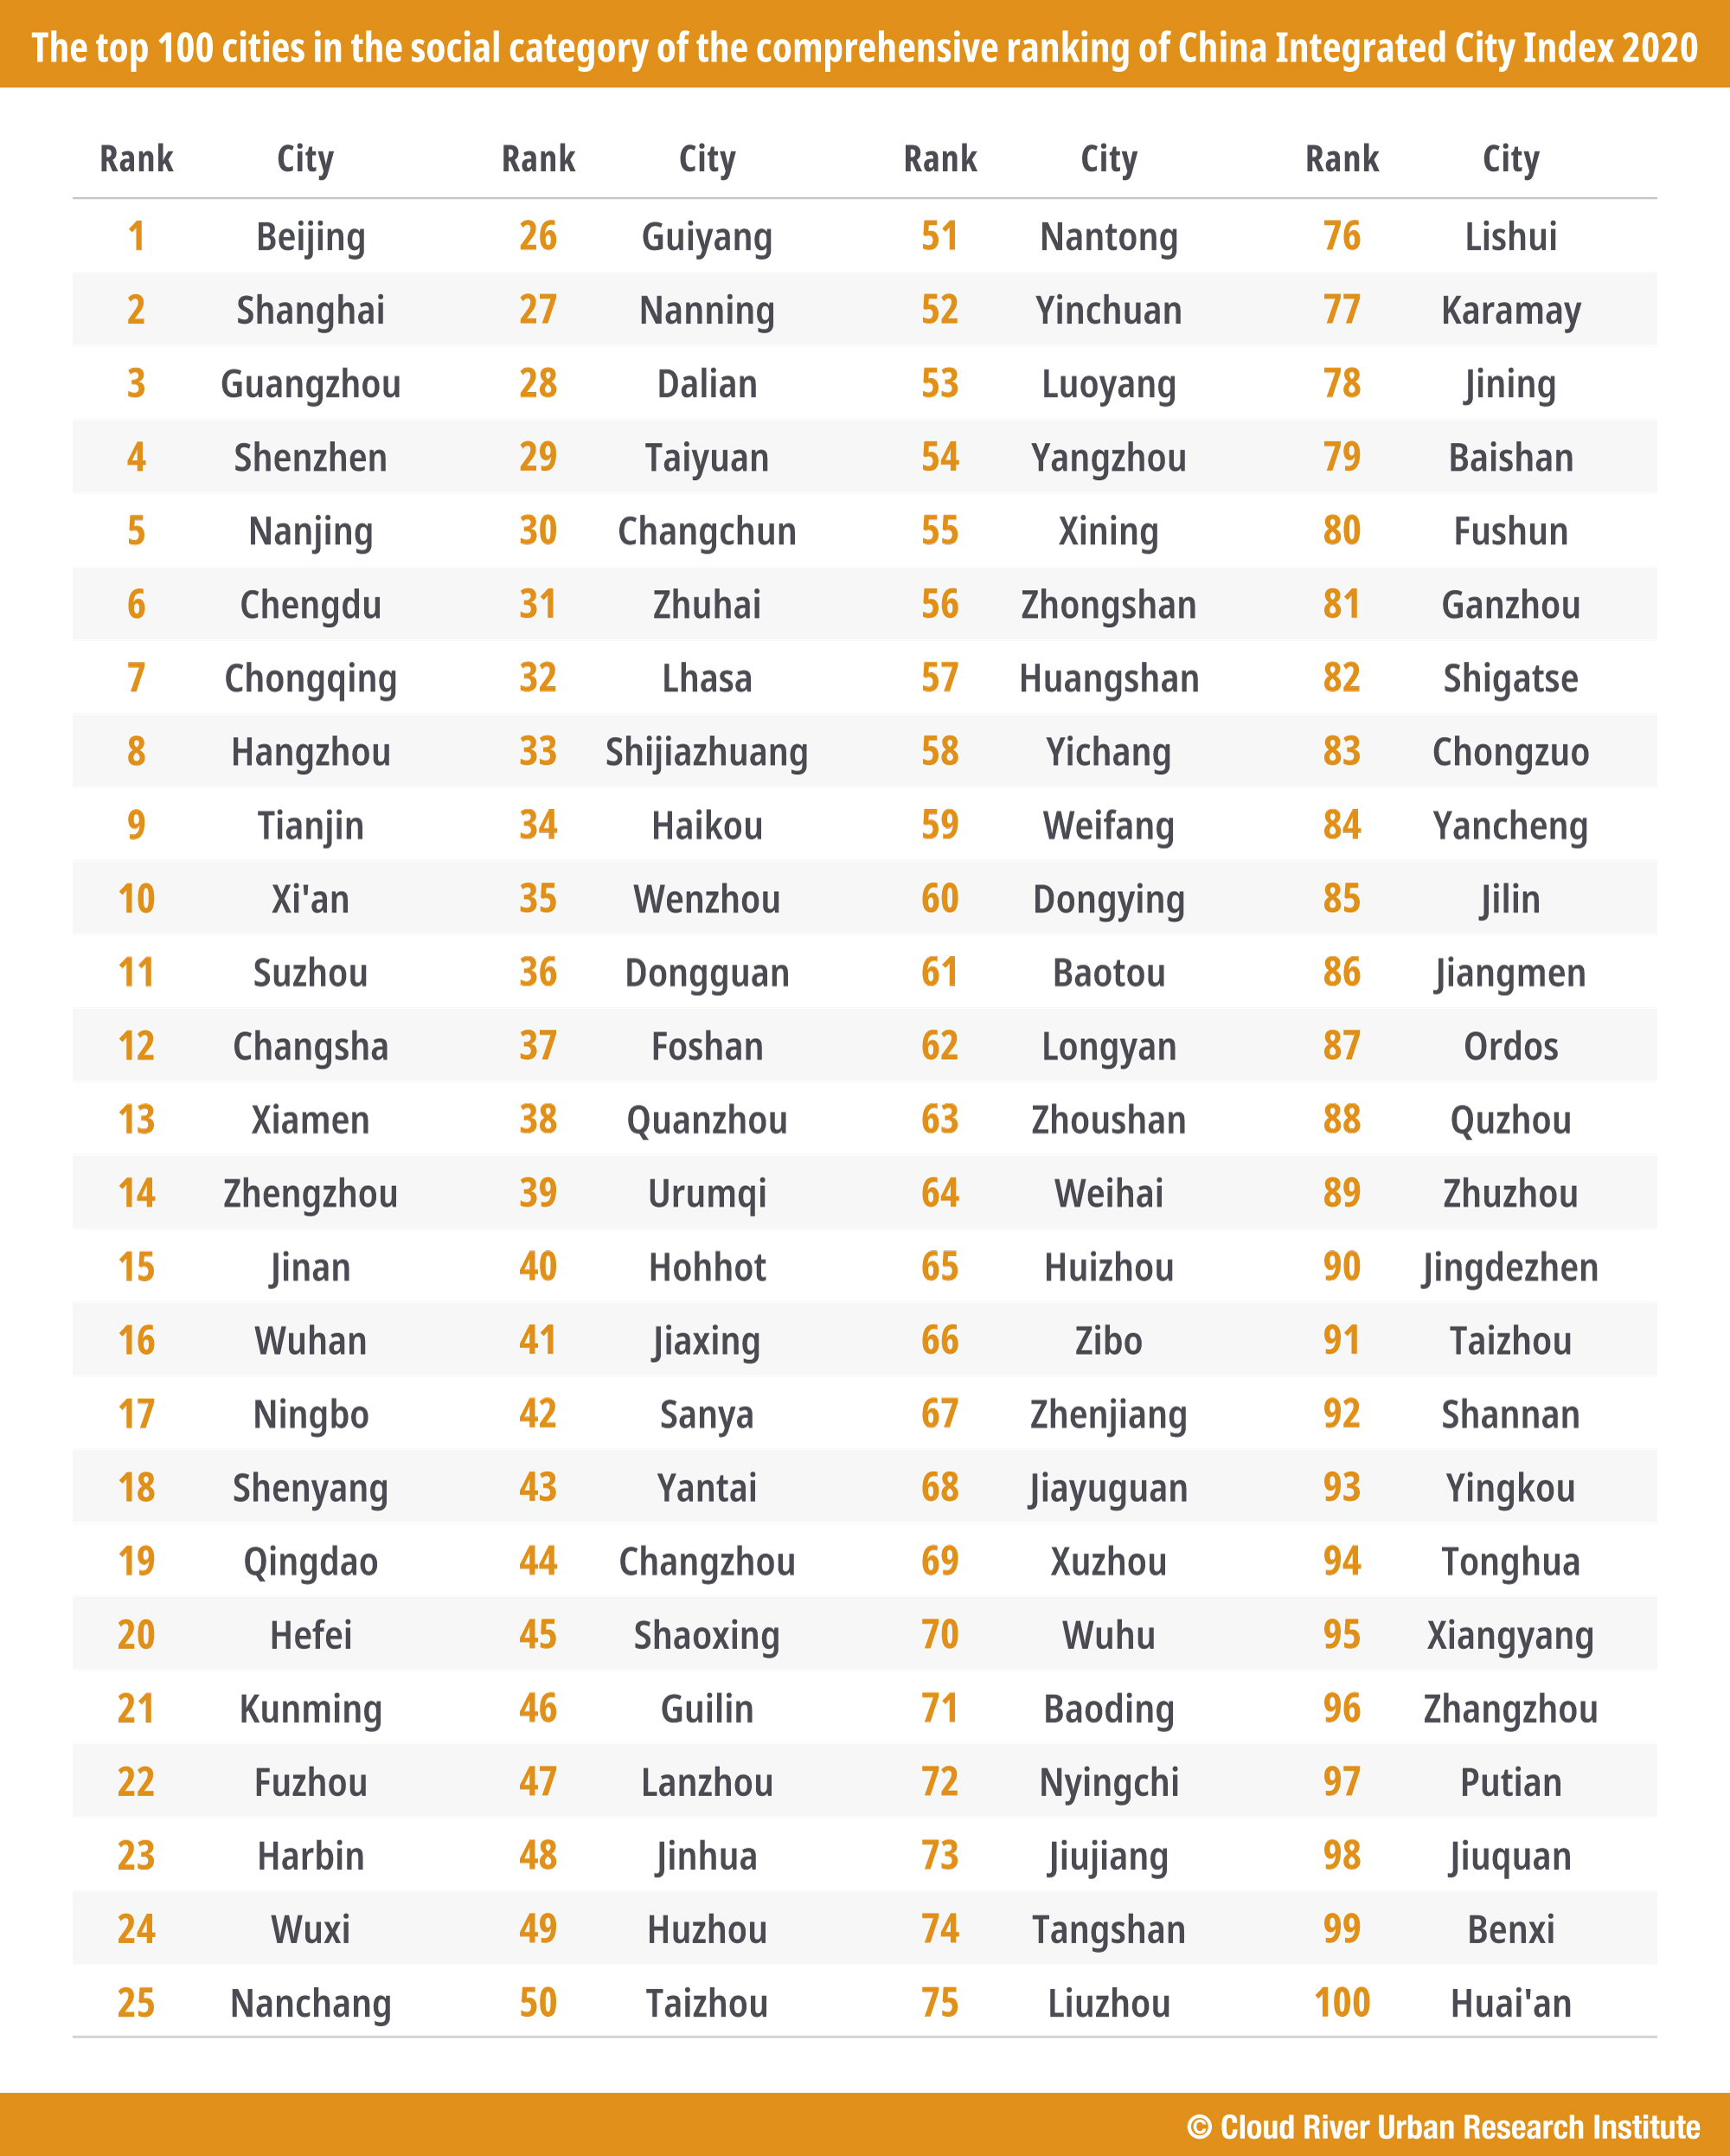
3. Ranking in society dimension
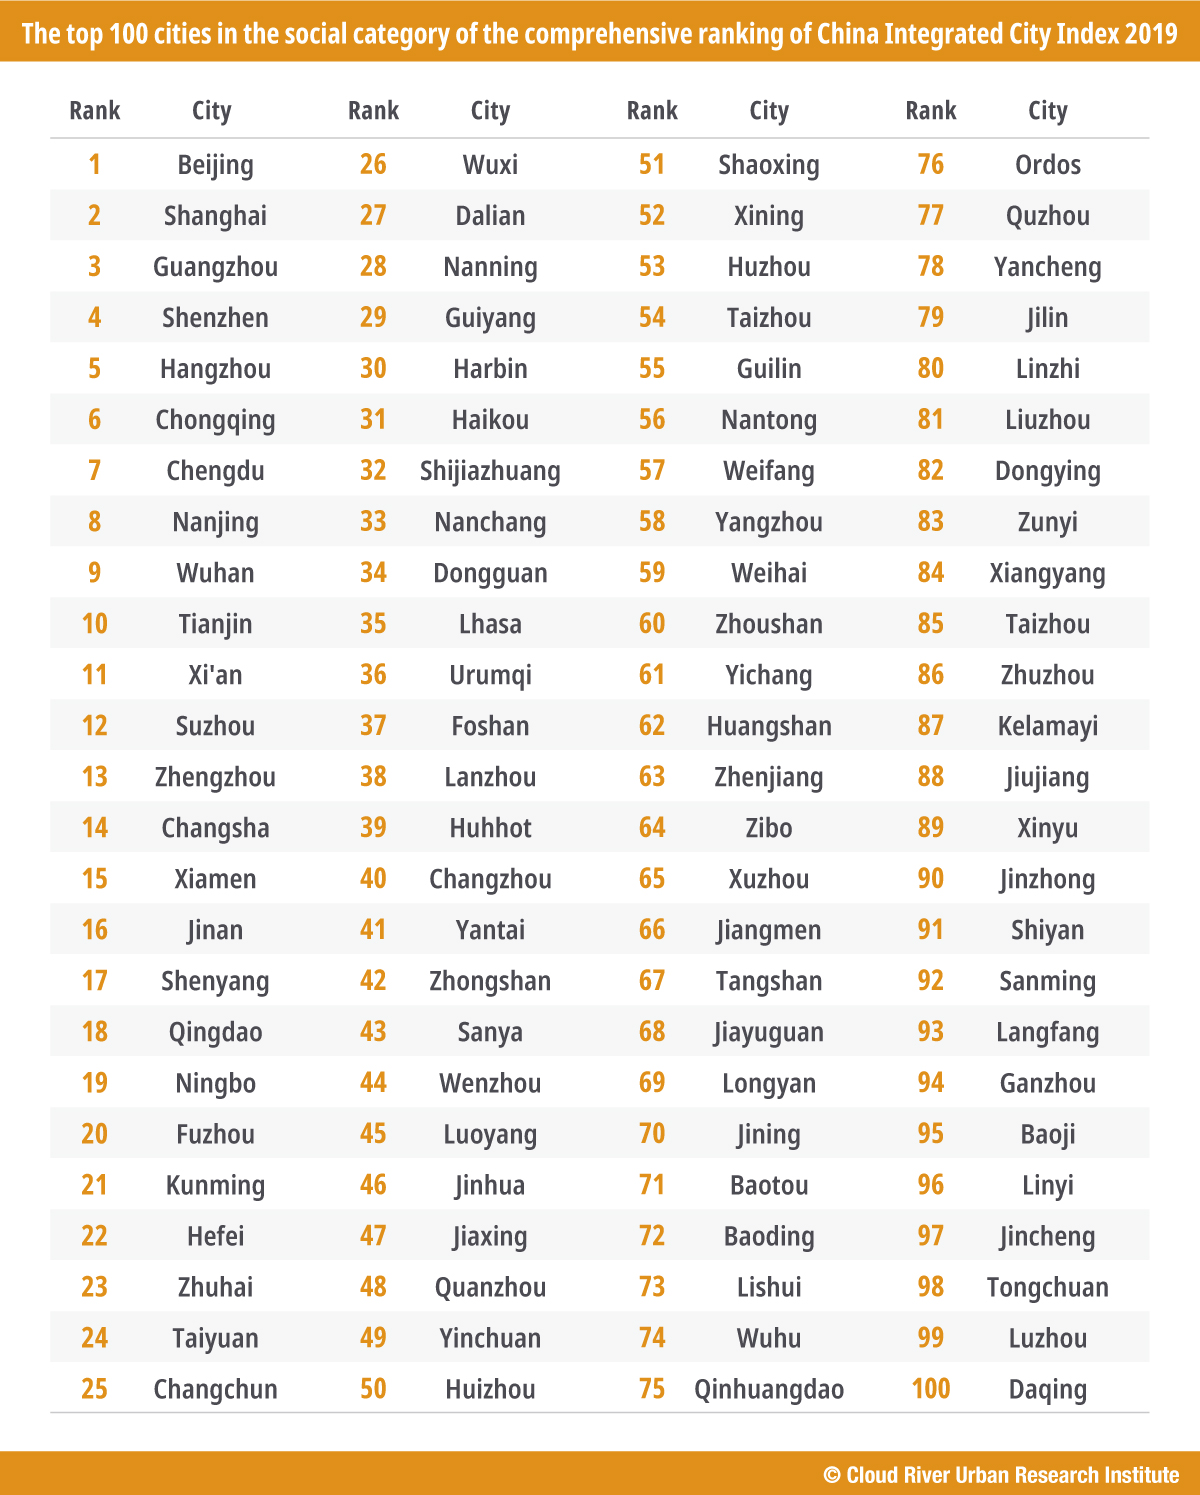
Beijing and Shanghai have ranked first and second, respectively, in the society dimension for five consecutive years, and Guangzhou has remained third for four consecutive years.
The top 10 Chinese cities in this dimension in 2020 are Beijing, Shanghai, Guangzhou, Shenzhen, Nanjing, Chengdu, Chongqing, Hangzhou, Tianjin, and Xi’an. Nanjing, Chengdu, and Tianjin rose to fifth, sixth, and ninth place, respectively, while Xi’an entered the top 10 and Wuhan dropped out.
The 11th to 30th are Suzhou, Changsha, Xiamen, Zhengzhou, Jinan, Wuhan, Ningbo, Shenyang, Qingdao, Hefei, Kunming, Fuzhou, Harbin, Wuxi, Nanchang, Guiyang, Nanning, Dalian, Taiyuan, and Changchun.
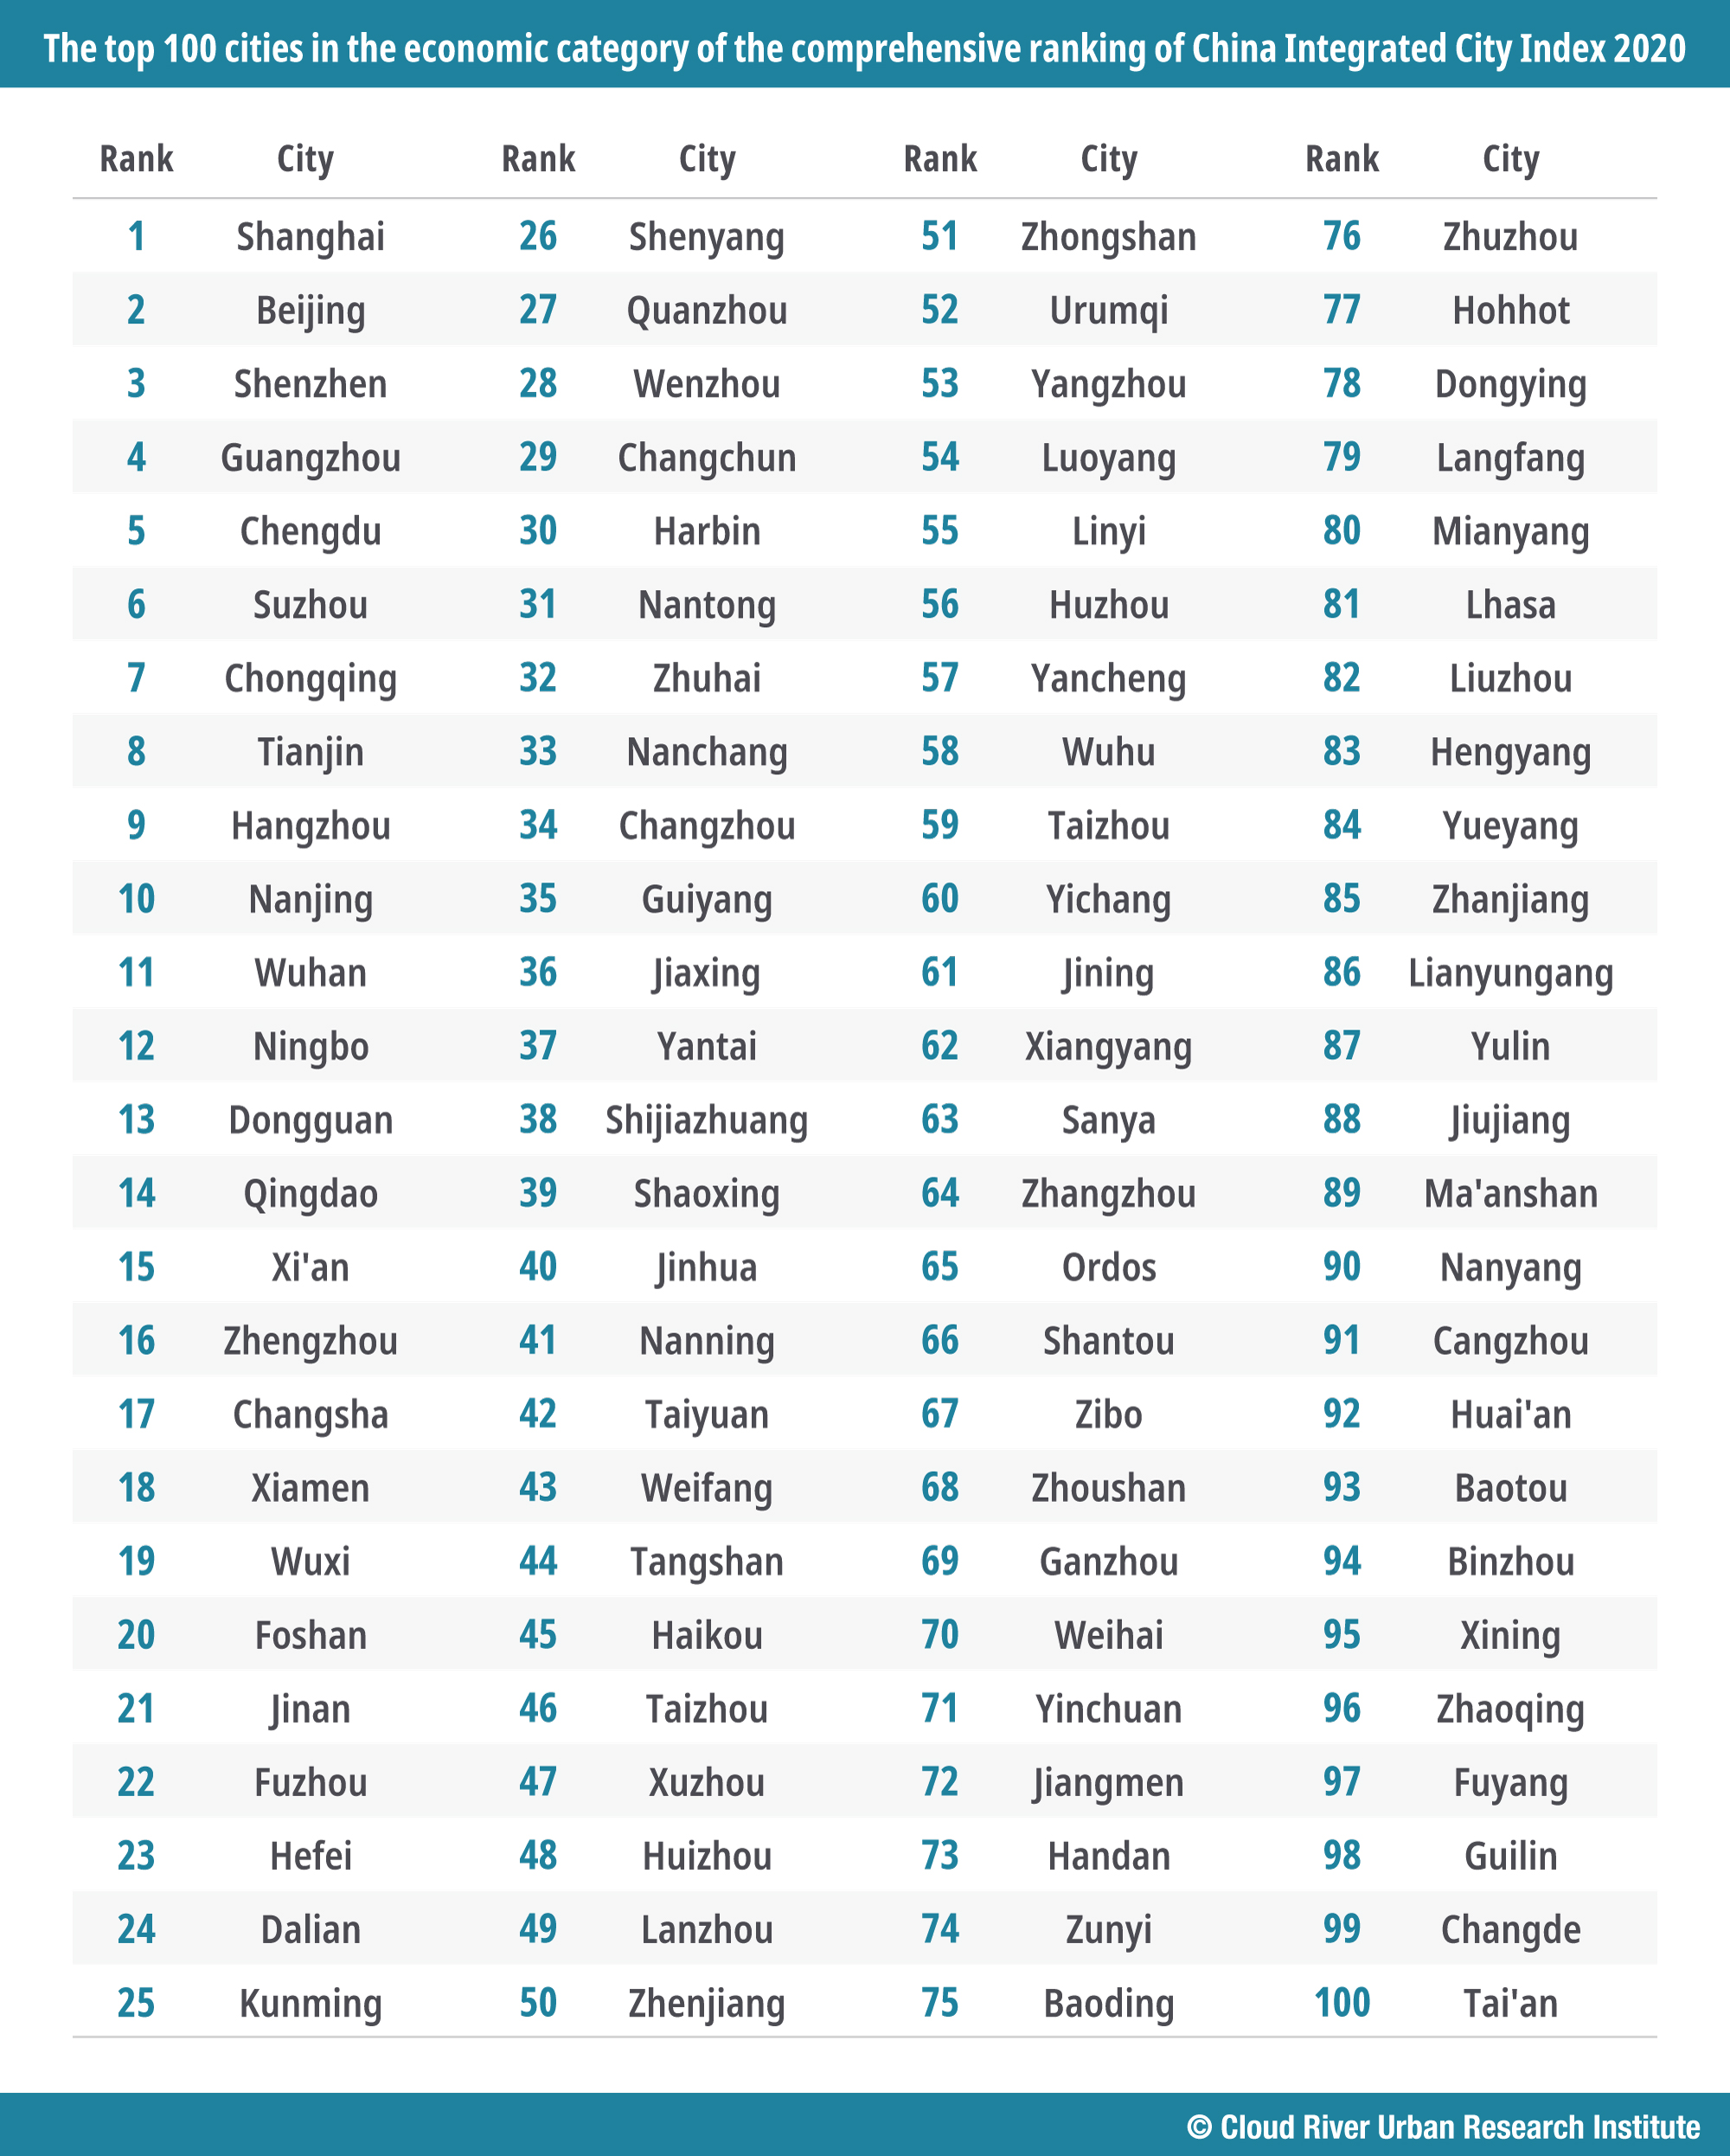
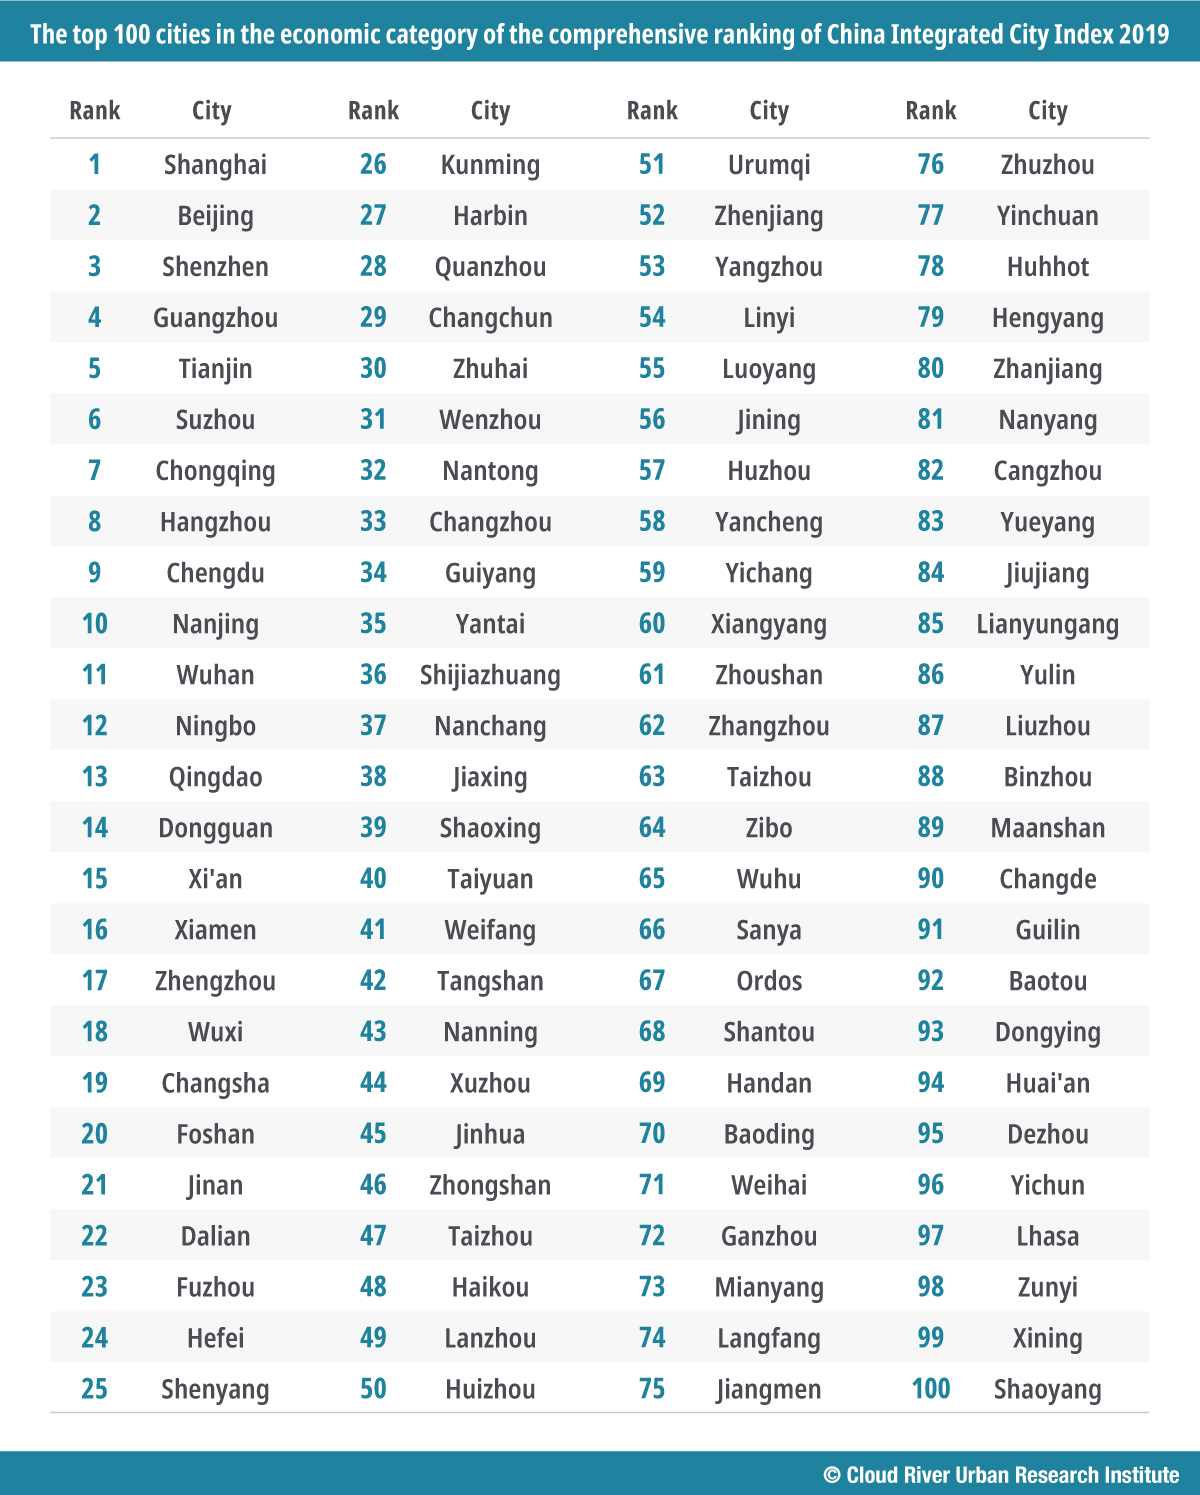
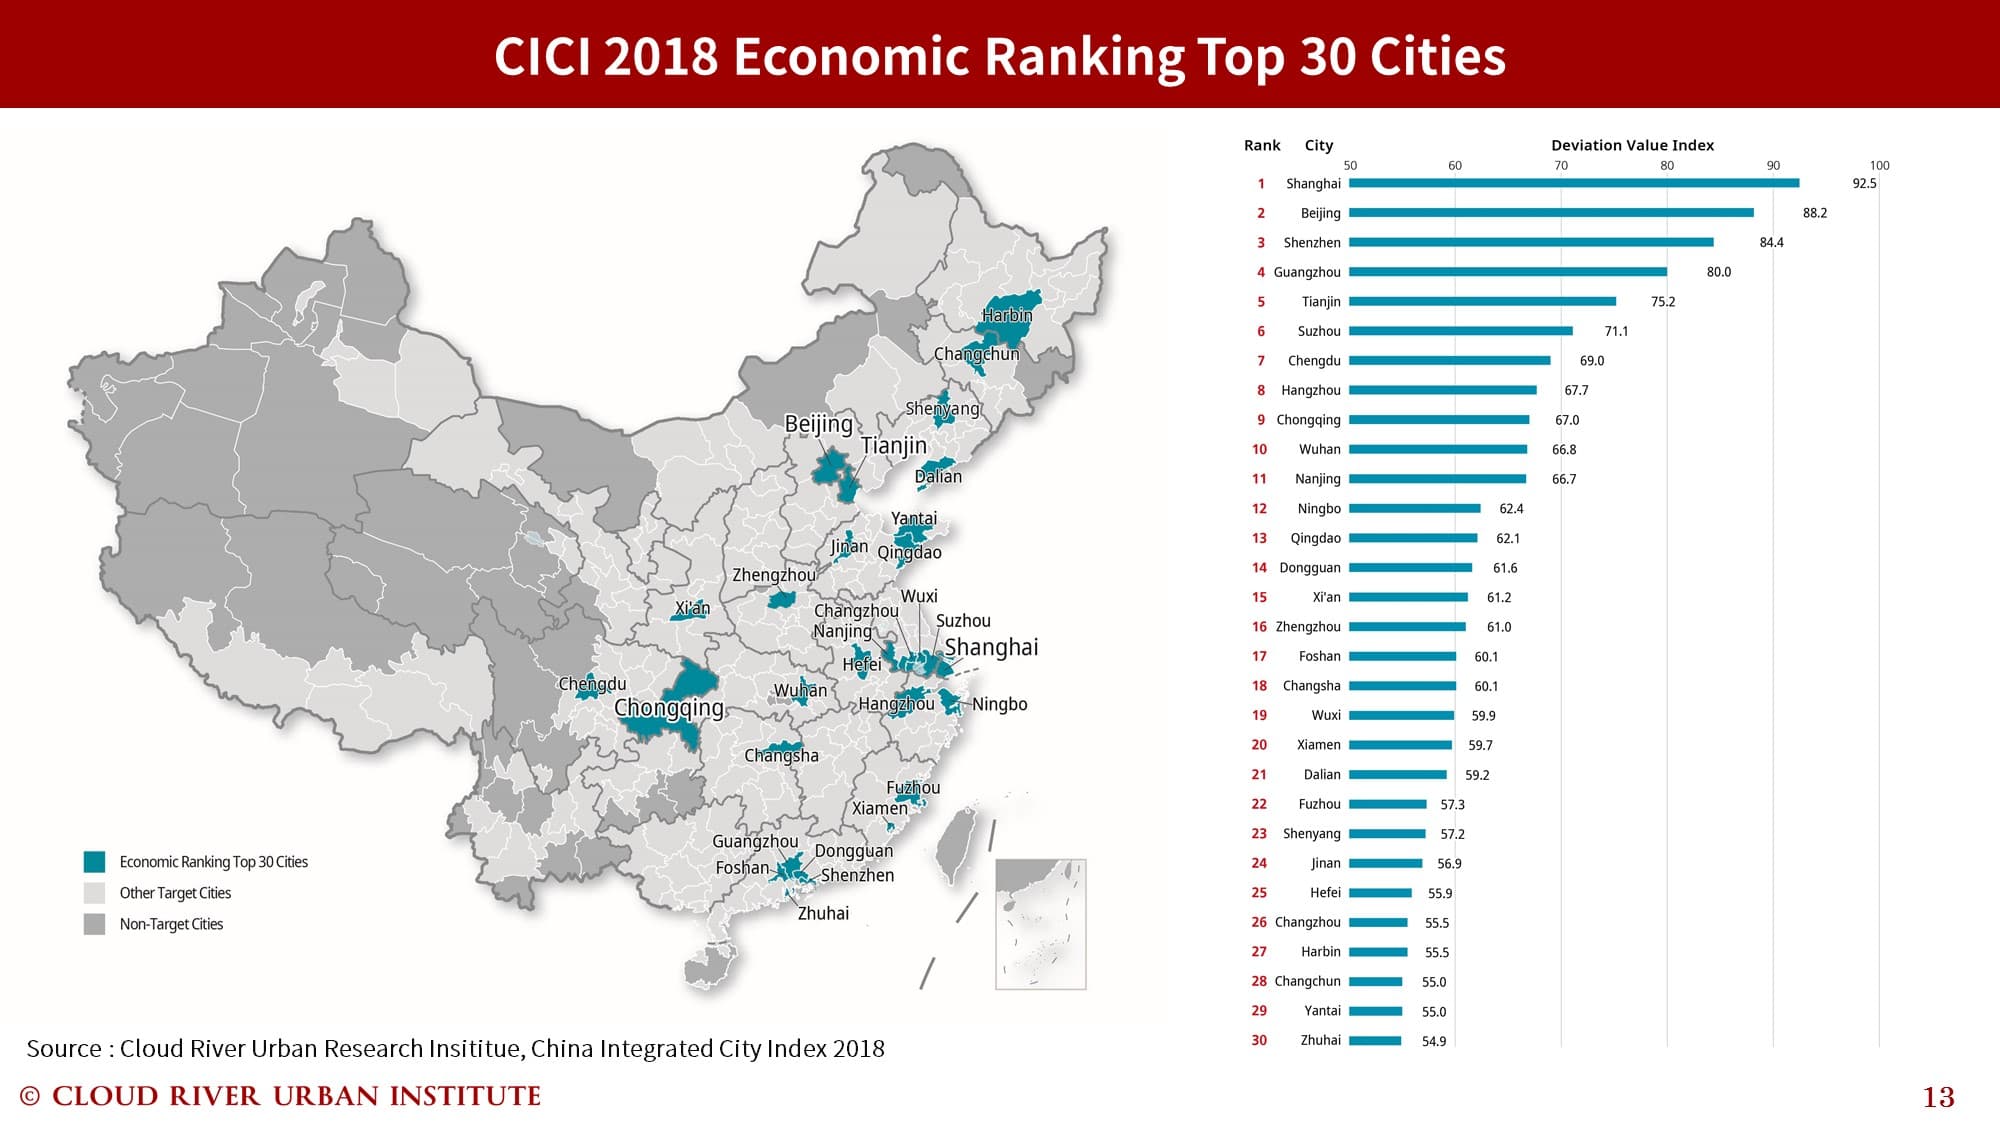
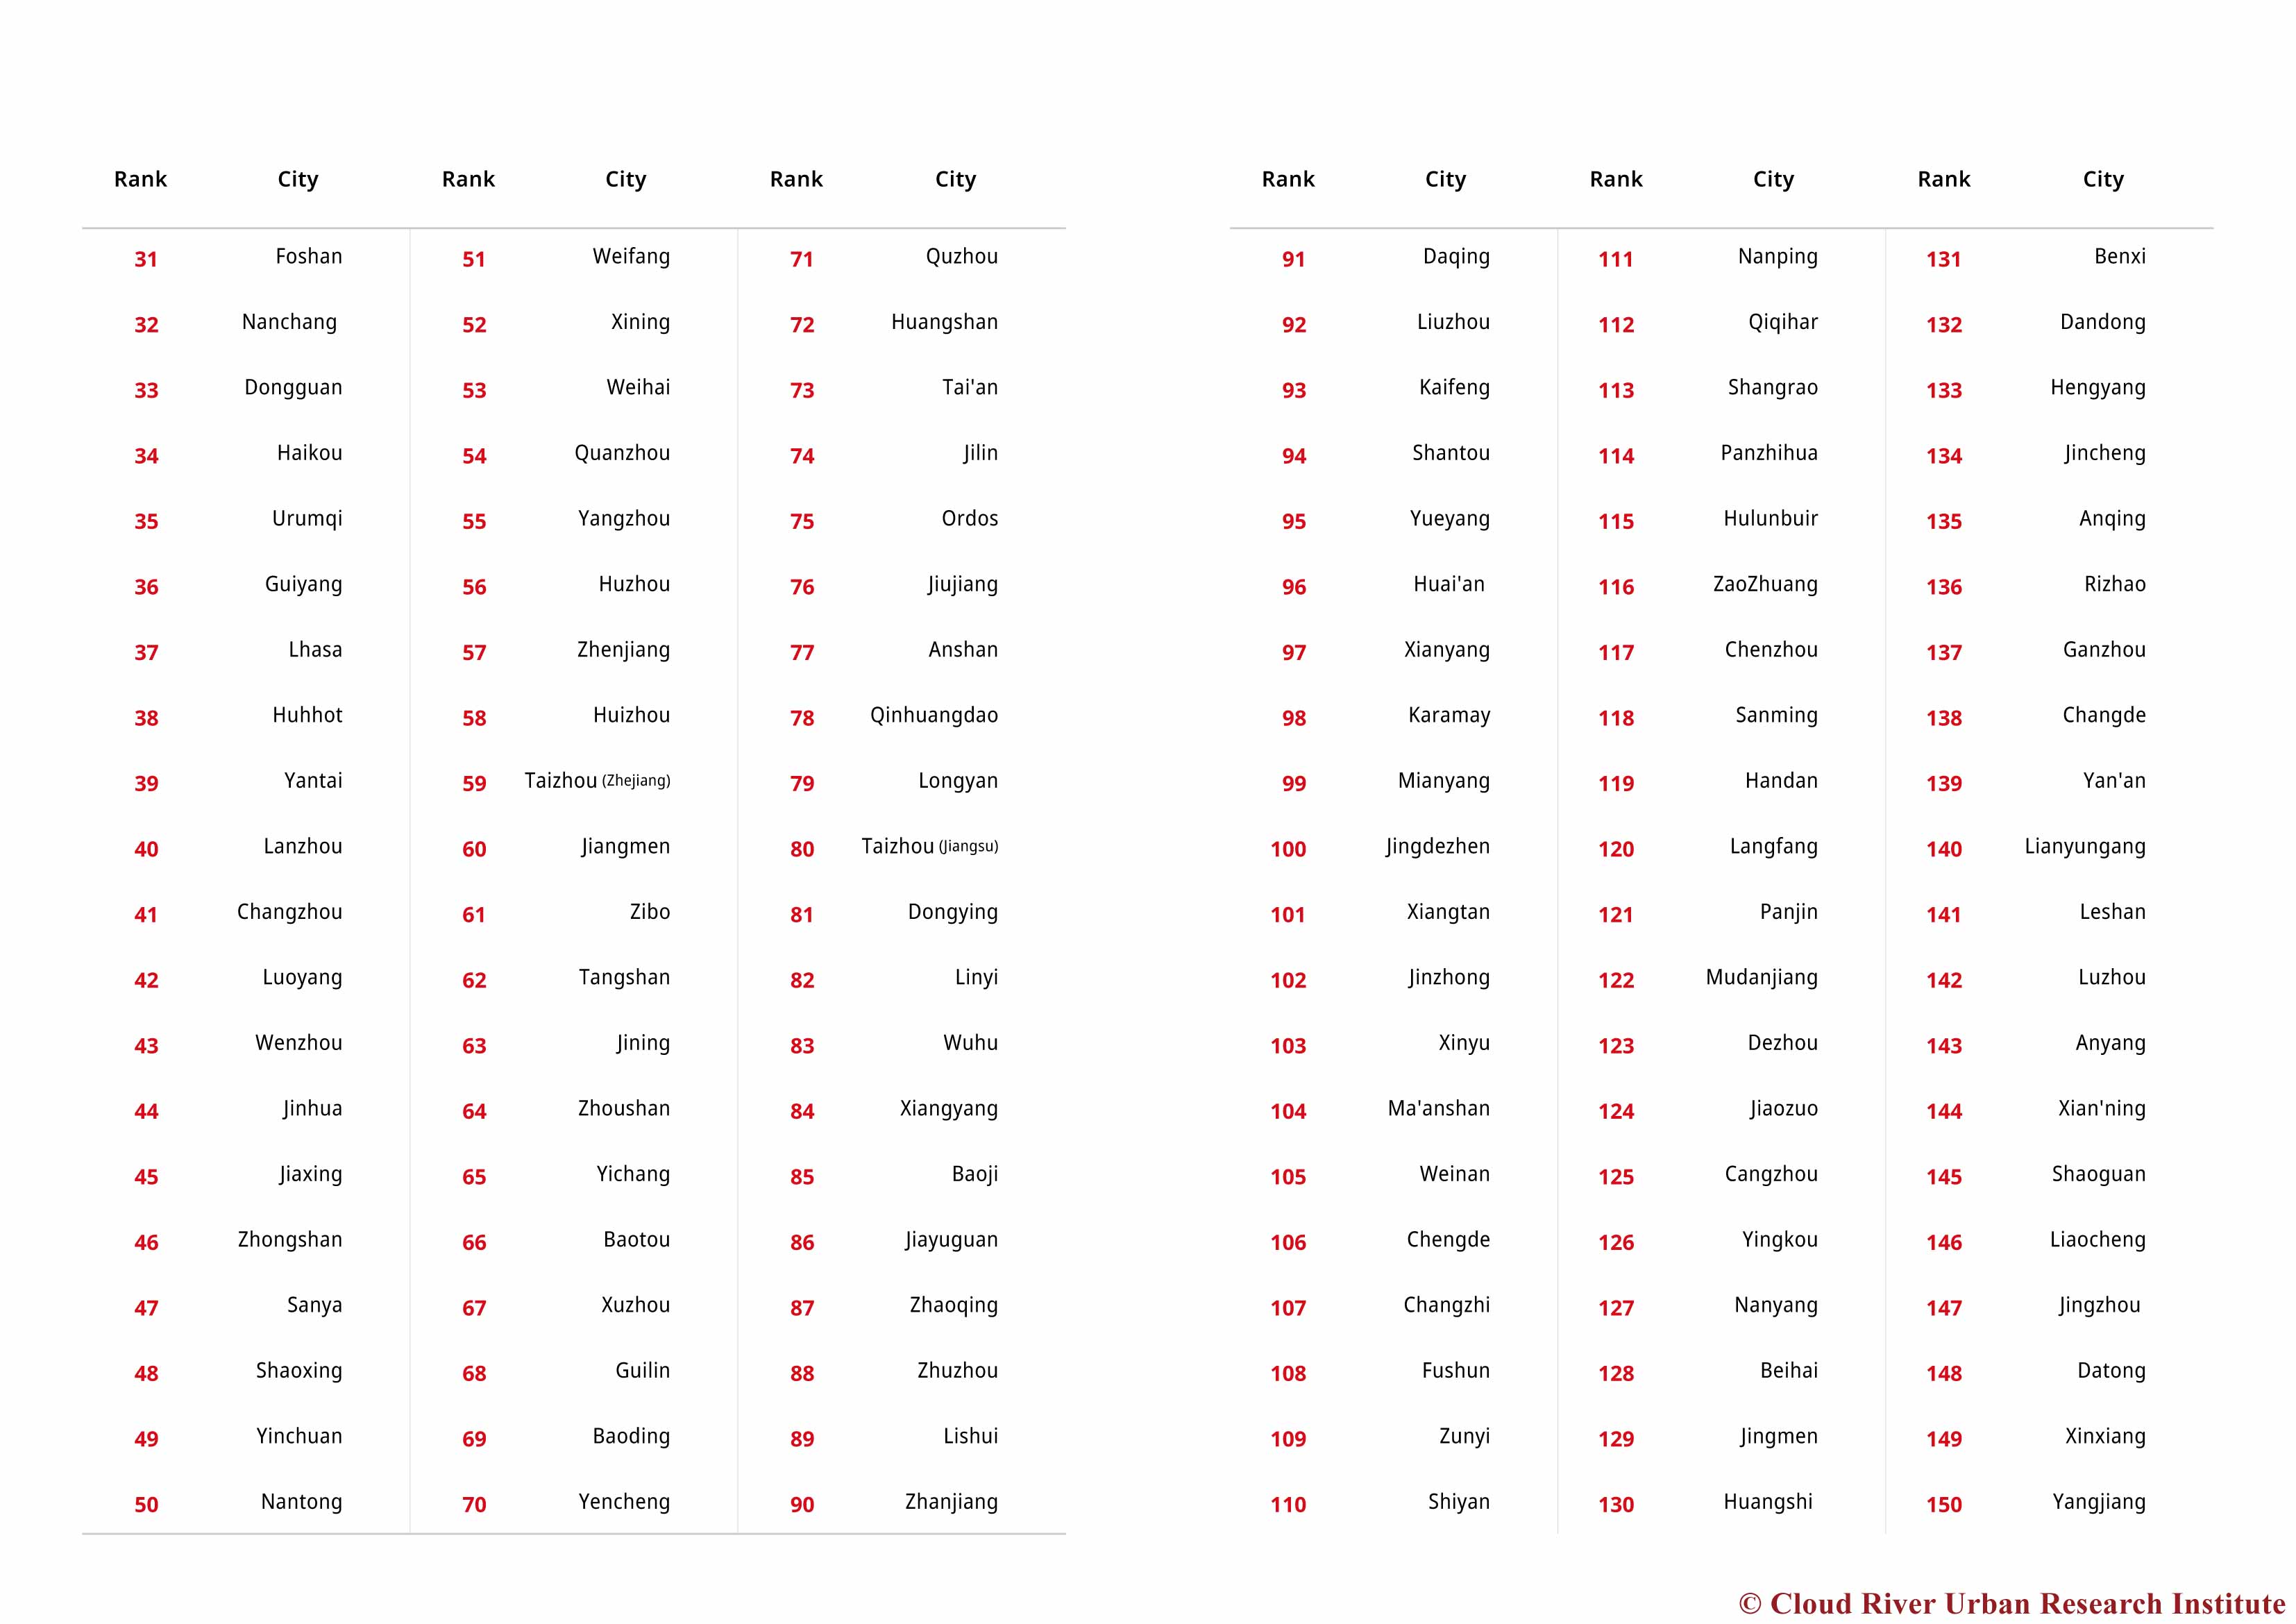
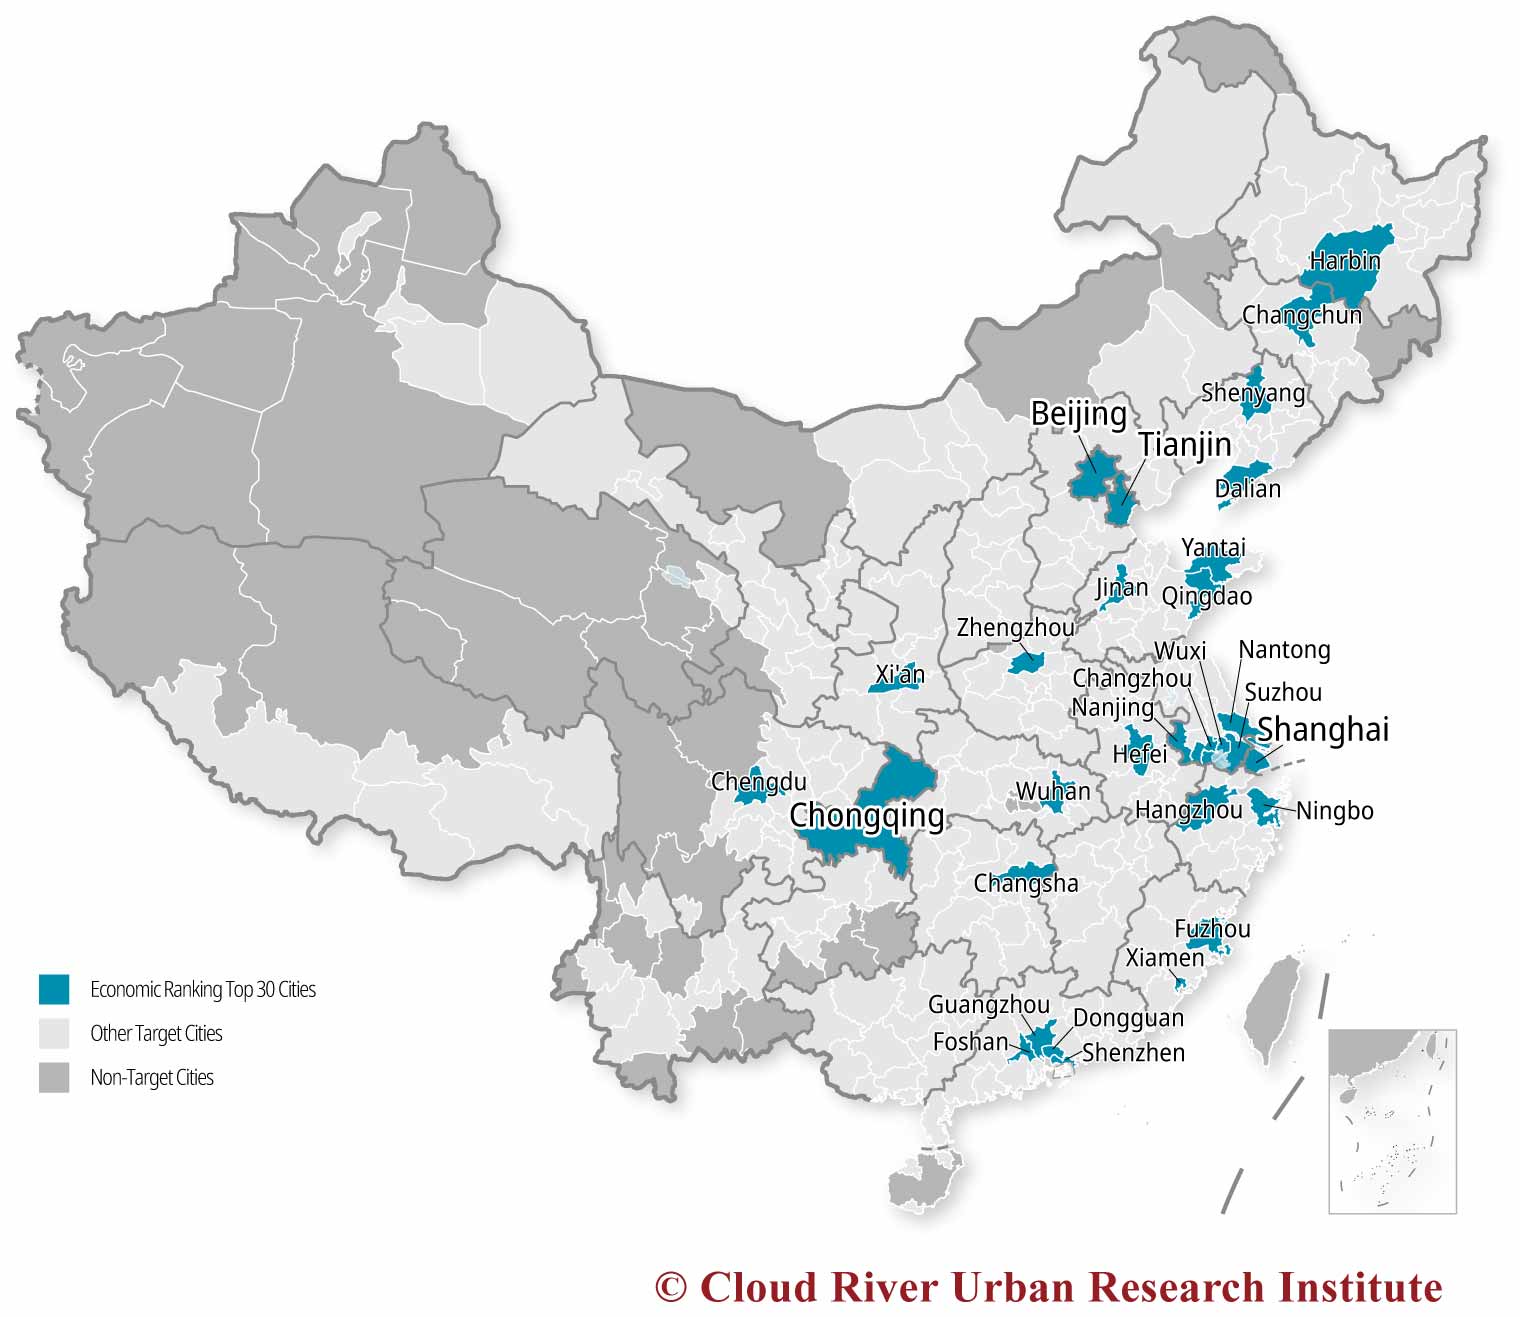
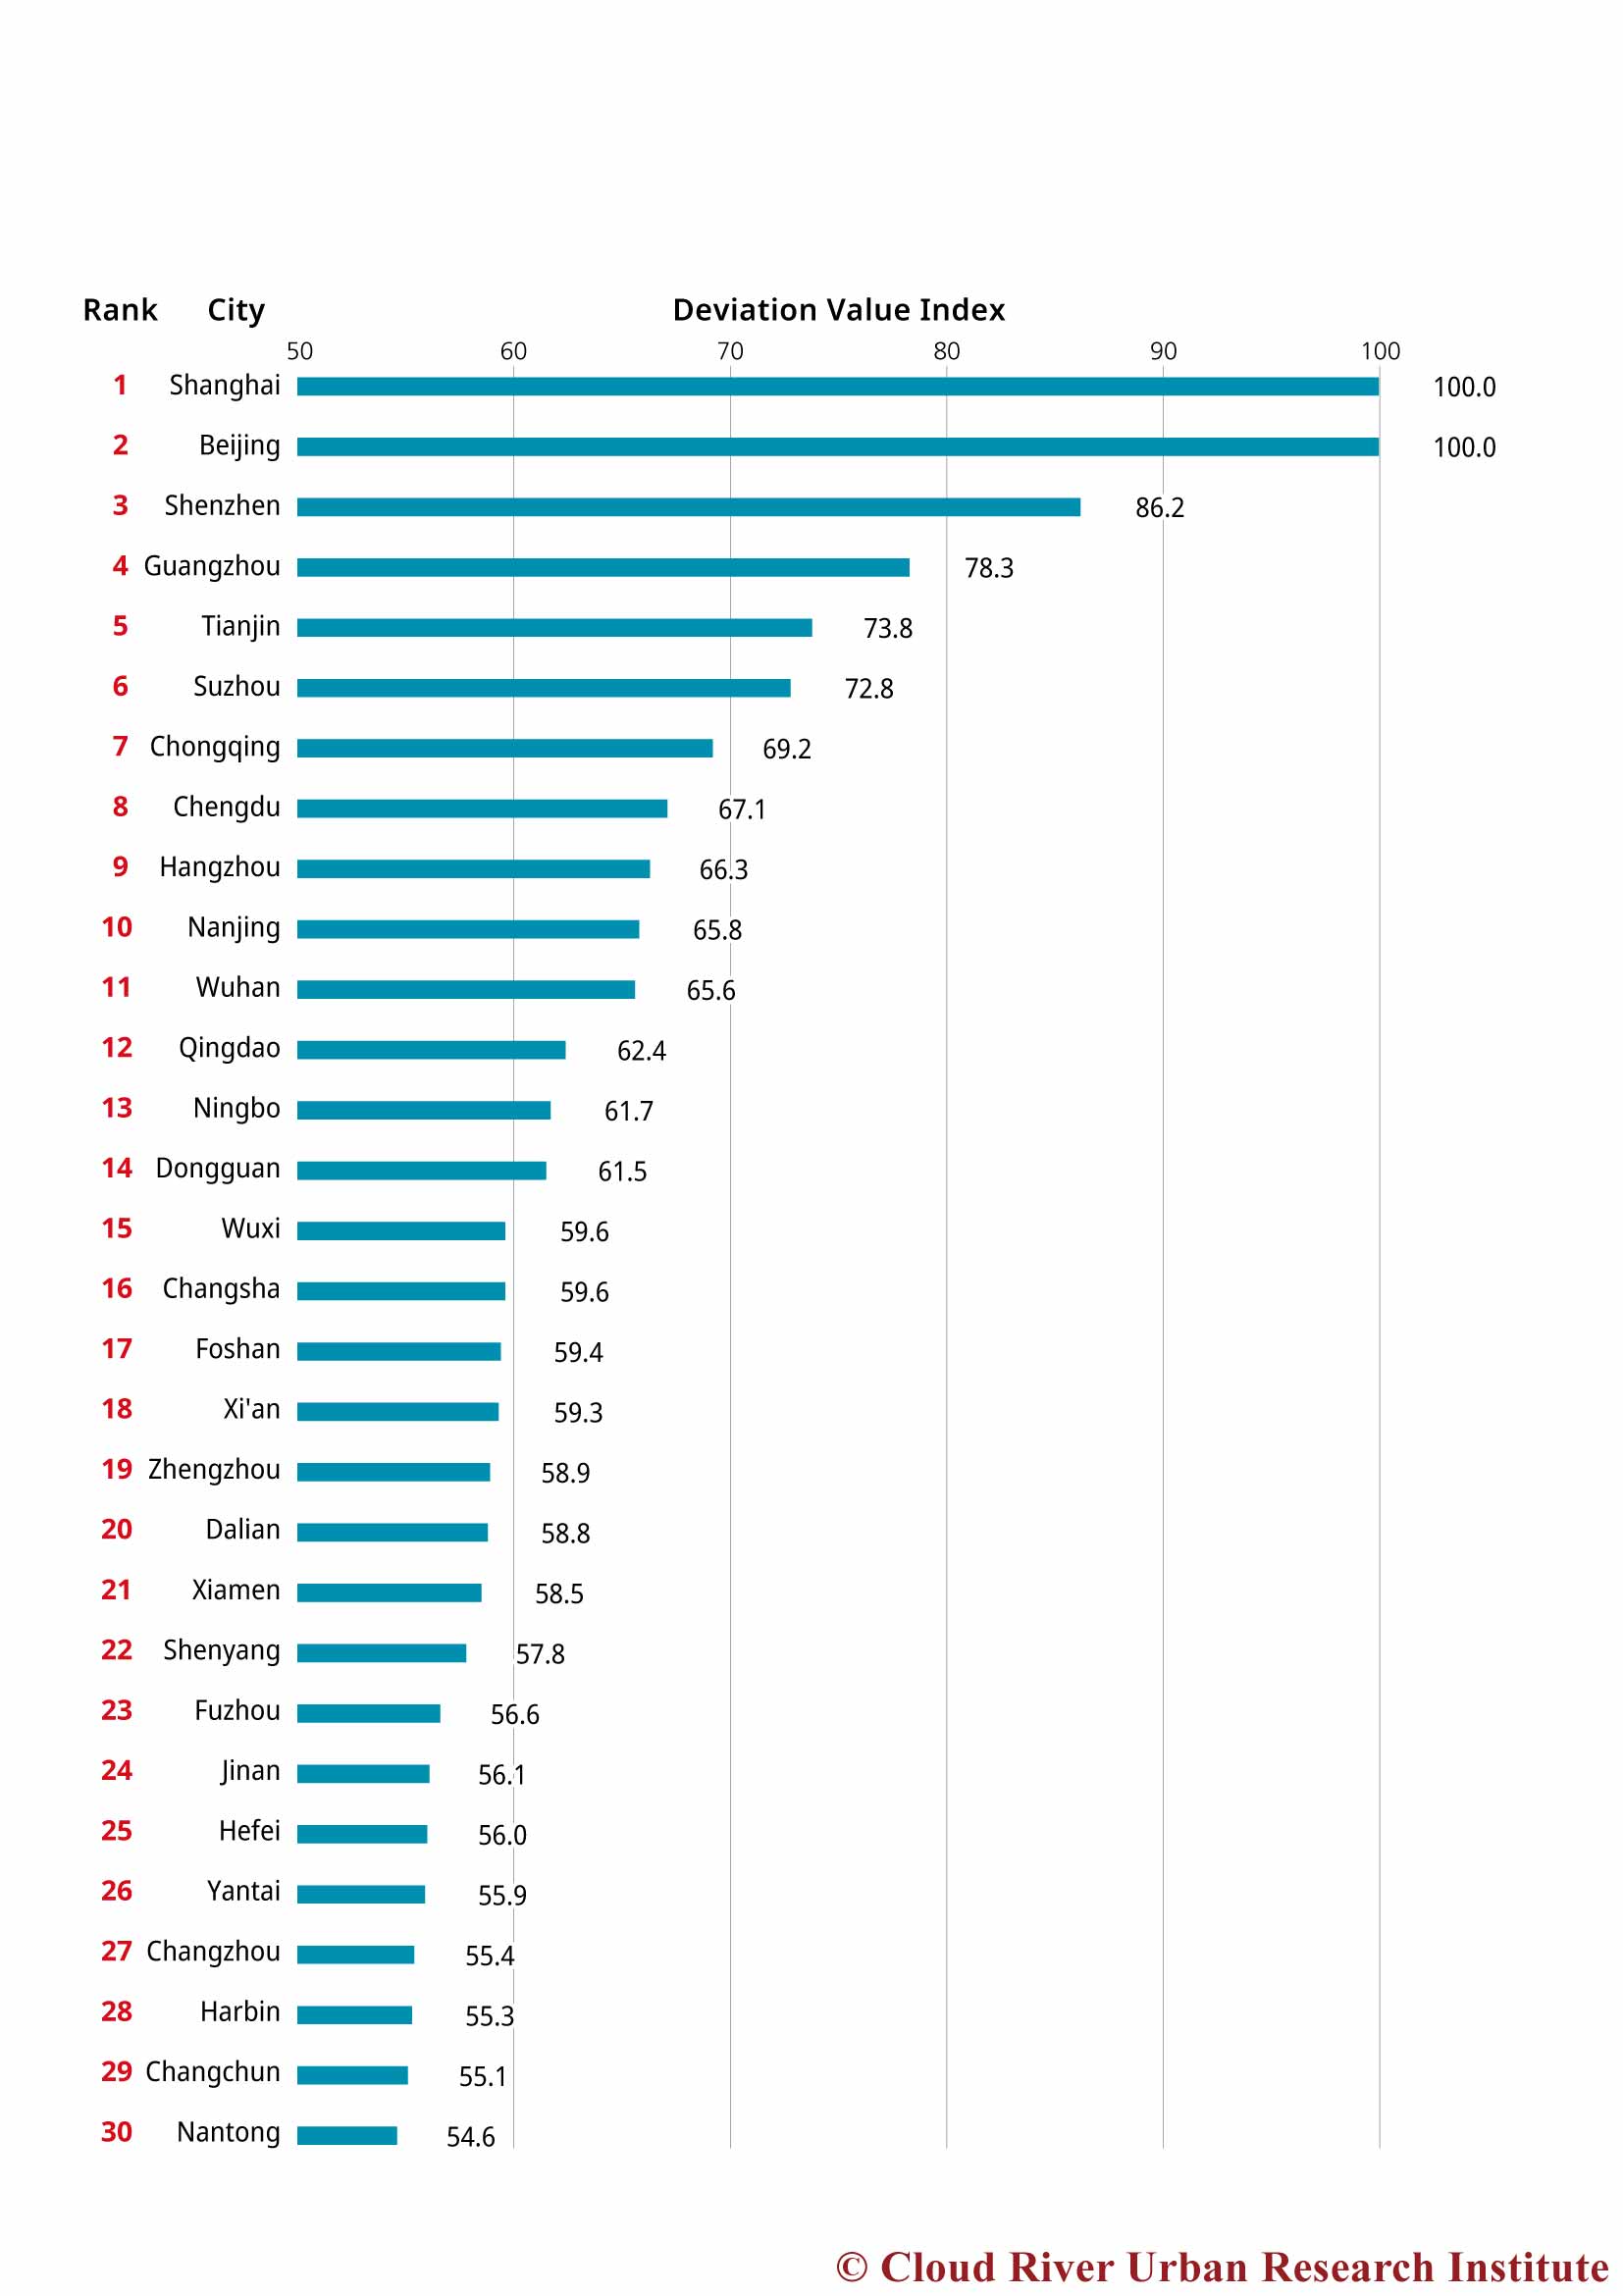
4. Ranking in economy dimension
Shanghai has topped the ranking in the economy dimension for five consecutive years, and Beijing and Shenzhen have remained second and third, respectively, for five consecutive years.
The top 10 Chinese cities in this dimension in 2020 are Shanghai, Beijing, Shenzhen, Guangzhou, Chengdu, Suzhou, Chongqing, Tianjin, Hangzhou, and Nanjing. Chengdu jumped to fifth place, while Tianjin and Hangzhou fell in the ranking.
The 11th to 30th are Wuhan, Ningbo, Dongguan, Qingdao, Xi’an, Zhengzhou, Changsha, Xiamen, Wuxi, Foshan, Jinan, Fuzhou, Hefei, Dalian, Kunming, Shenyang, Quanzhou, Wenzhou, Changchun, and Harbin.