The spatial structure of China’s economic growth is undergoing profound changes, with urban development showing obvious signs of “concentration” and “divergence.” Various functions are increasingly concentrated in leading cities. The more advanced the function is, the higher the concentration becomes. Meanwhile, the divergence between cities is constantly growing, meaning an increasing “polarization of driving forces.”
Cloud River Urban Research Institute, a think tank specializing in urbanization research, published 12 sets of data regarding top 30 Chinese cities in different rankings in a report titled “China Integrated City Index 2018.” The institute looked at the “polarization of driving forces” by analyzing the performance of 298 cities at the prefecture level and above based on major indicators and the concentration of functions.
1. Top 30 Cities by GDP
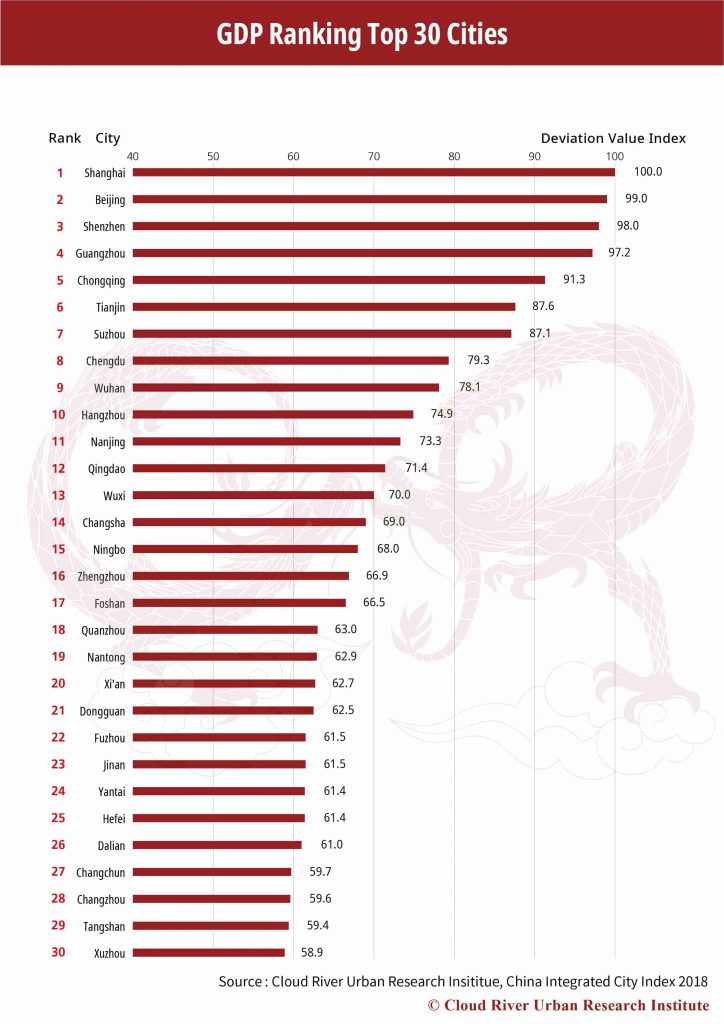
The 10 Chinese cities with the best performance in terms of GDP, namely Shanghai, Beijing, Shenzhen, Guangzhou, Chongqing, Tianjin, Suzhou, Chengdu, Wuhan and Hangzhou, account for 23.6% of the country’s total GDP. The top 30 cities by GDP make up 43.5% of the total. In other words, the richest 10% of the 298 cities create more than 40% of the national GDP, and China’s economic growth relies heavily on the top 30 cities.
2. Top 30 Cities by DID Population
Population density is a key indicator for the assessment of urban development. The China Integrated City Index introduced the concept of densely inhabited district (DID) to make an accurate and effective measurement of population density. The concept of DID refers to districts with a population density of more than 5,000 inhabitants per square kilometer.
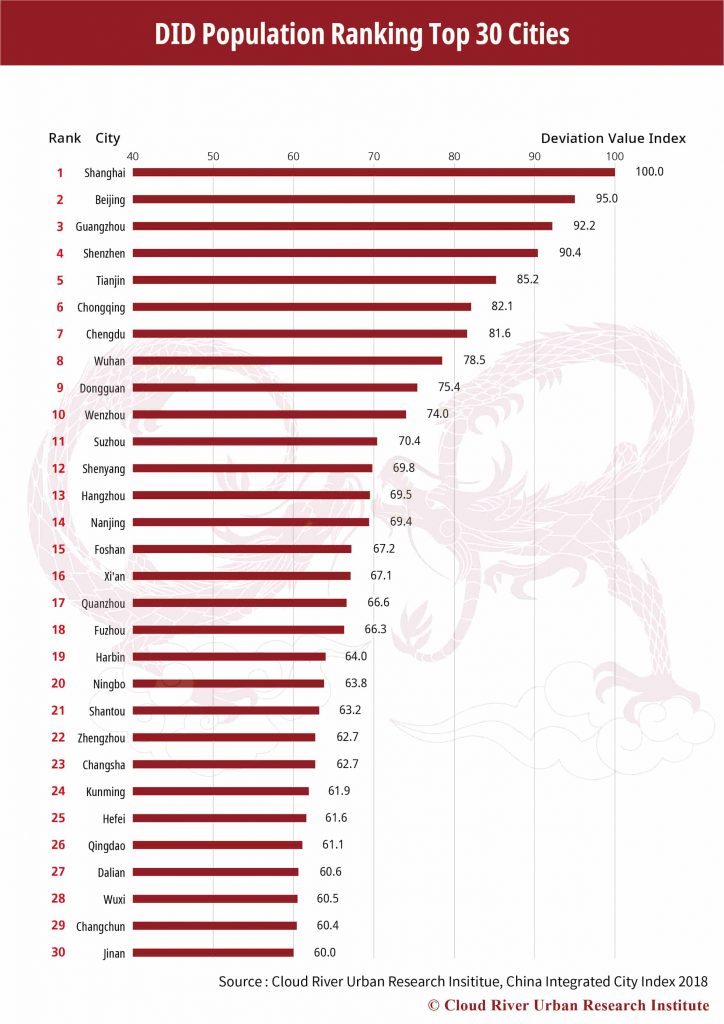
The top 10 cities by DID population, namely Shanghai, Beijing, Guangzhou, Shenzhen, Tianjin, Chongqing, Chengdu, Wuhan, Dongguan and Wenzhou, account for 22.8% of the country’s total DID population. The top 30 cities make up for 43.2% of the total. In other words, more than 40% of China’s DID population is concentrated in the most populous 10% of the 298 cities.
It is more noteworthy that the GDP of the 298 cities is highly correlated with their DID population, with a correlation coefficient of 0.93, meaning a “complete correlation.” Furthermore, 26 out of the top 30 cities by GDP are also on the list of the top 30 by DID population (in different positions). All these highlight the importance of DID population. Therefore, Chinese cities need to pay close attention to DID quality and scale.
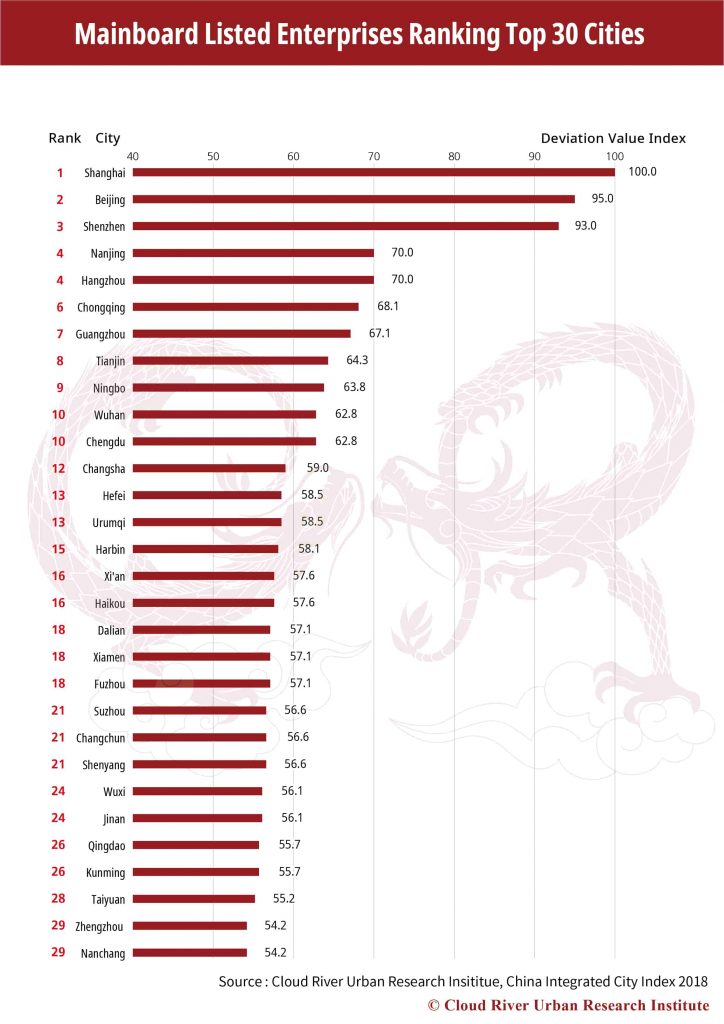
3. Top 30 Cities with Most Main Board Listed Companies
As to the number of listed companies on the main boards of the Shanghai, Shenzhen and Hong Kong stock markets, enterprises from the top 30 cities account for 69.7% of the country’s total, among which 39.6% are located in the top three cities, namely Shanghai, Beijing and Shenzhen. In other words, the top 10% of the 298 cities are home to nearly 70% of all the Chinese companies listed on the main board.
Main-board listed companies are more and more concentrated in large cities, especially core cities.
4. Top 30 Cities with Most Fortune 500 Chinese Companies
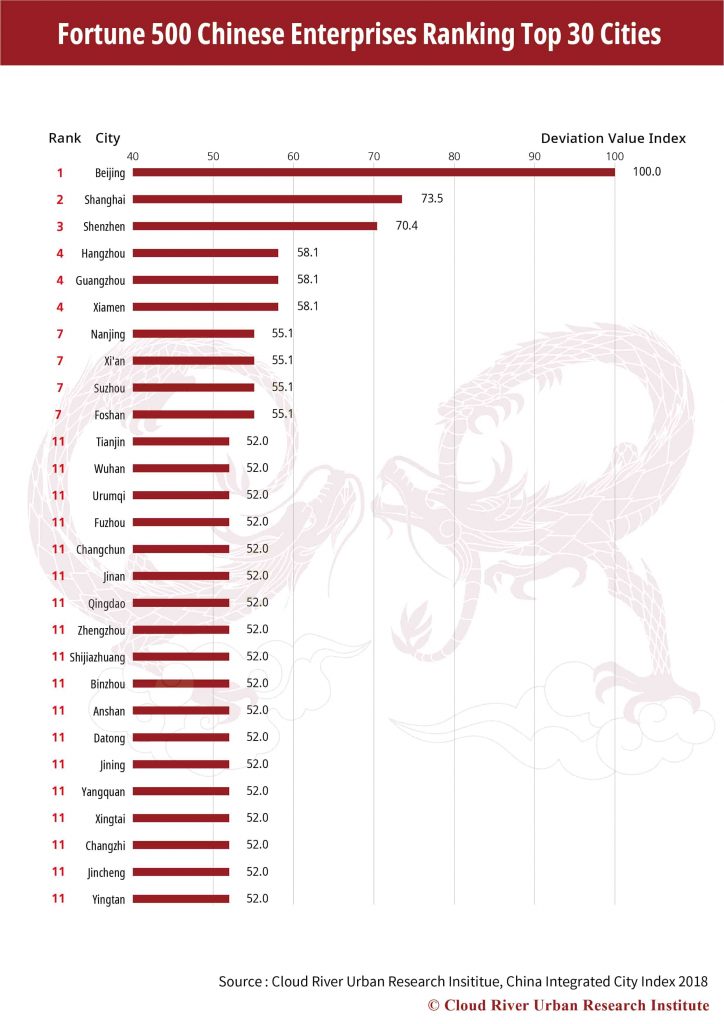
In 1989, China had only three companies listed among the Fortune Global 500. In 2018, the number of Chinese companies on the list reached 105, second only to the 126 of the U.S. In particular, three Chinese companies took spots in the top 10.
Chinese companies on the Fortune Global 500 list are located in 28 cities, while 66.7% are concentrated in Beijing, Shanghai and Shenzhen. Compared with ordinary main-board listed companies, Fortune Global 500 Chinese Companies are more concentrated in the national core cities.
An analysis of the top 30 cities with most main board listed companies and top 30 with most Fortune Global 500 Chinese companies shows that the headquarters of the most outstanding Chinese companies, which serve as the central management in the economy, are highly concentrated in core cities represented by Beijing, Shanghai and Shenzhen.
5. Top 30 Cities by Manufacturing Radiation
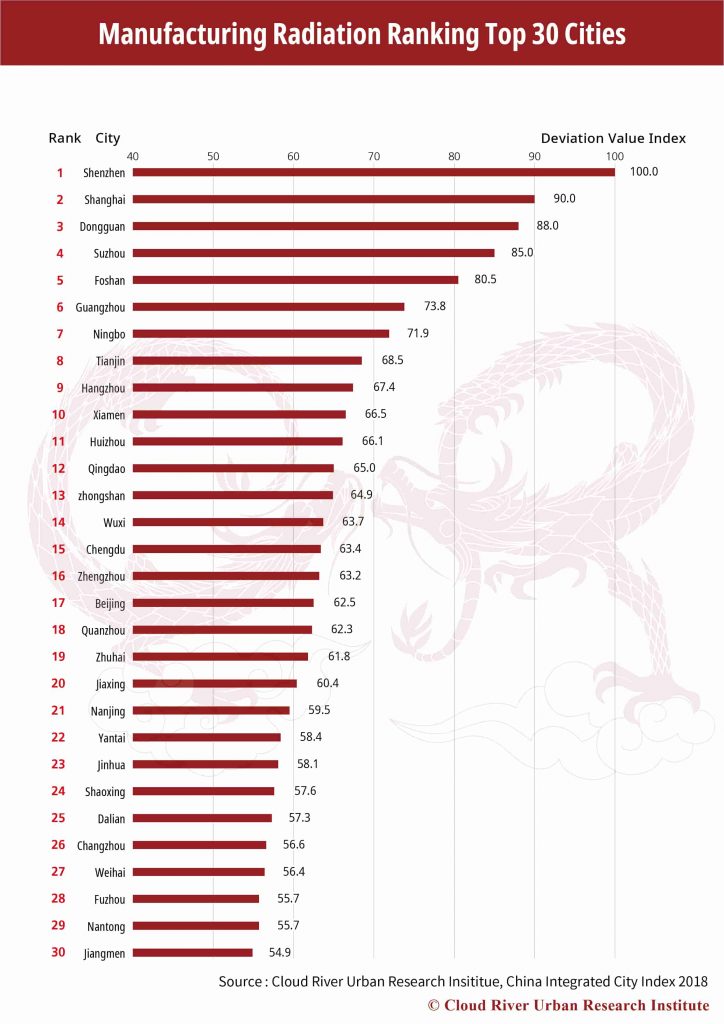
As to the manufacturing radiation, Shenzhen, Shanghai and Dongguan are followed by Suzhou, Foshan, Guangzhou, Ningbo, Tianjin, Hangzhou and Xiamen to round up the top 10. The 10 cities, all with easy access to large container ports, account for 48.2% of the country’s total exports of goods. The top 30 cities make up 74.9% of the total. In other words, top 10% of the 298 cities contributed to three quarters of the country’s goods exports.
6. Top 30 Cities by IT Industry Radiation
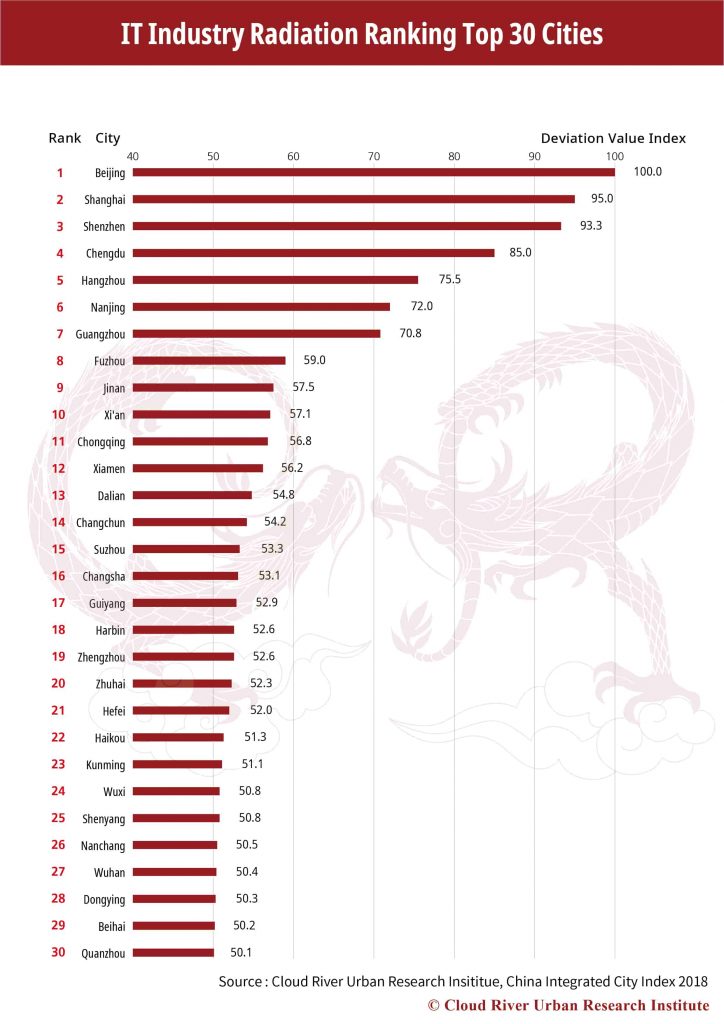
When it comes to the IT industry radiation, the cities occupying the top 10 places are Beijing, Shanghai, Shenzhen, Chengdu, Hangzhou, Nanjing, Guangzhou, Fuzhou, Jinan and Xi’an. The 10 cities account for 52.8%, 76.1%, 60% and 81% of the country’s total jobs created by IT industry, IT companies listed on the main board, small and medium-sized enterprises board and growth enterprises market board. The top 30 cities make up 68%, 94%, 78.2% and 91.2% in the above four categories. It is obvious that China’s IT industry is highly concentrated in the leading cities of the ranking.
Most Chinese cities are developing IT as a key industry. However, China’s IT industry, as a matter of fact, is highly concentrated in such cities as Beijing, Shanghai, Shenzhen, Chengdu, Hangzhou, Nanjing and Guangzhou. Compared with manufacturing, IT is far more concentrated and converged in certain cities. In this sense, the cities seeking to develop the IT industry need to carefully study and analyze the necessary requirements.
7. Top 30 Cities by Higher Education Radiation
As to the higher education radiation, Beijing, Shanghai, Wuhan are the top three cities, followed by Nanjing, Xi’an, Guangzhou, Changsha, Chengdu, Tianjin and Harbin. The 10 cities account for 69.3% of universities listed in Project 211 and Project 985, and 26.0% of all the students studying in regular universities. The top 30 cities make up 92.8% and 57.1% respectively. China’s higher education resources, especially high quality ones, are highly concentrated in the leading cities of the ranking.
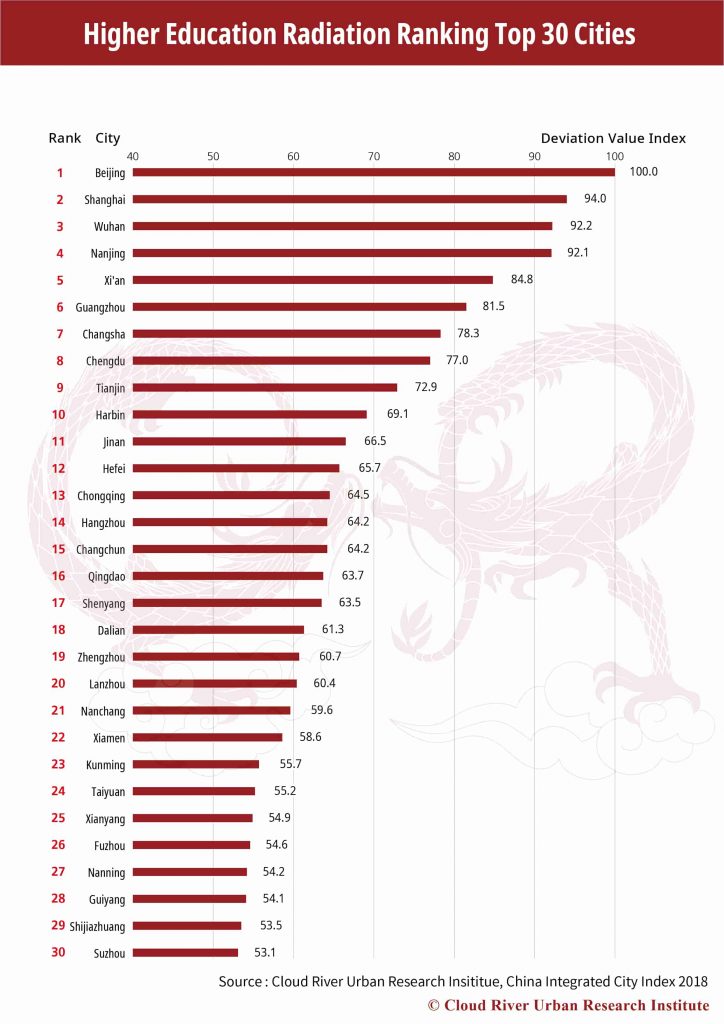
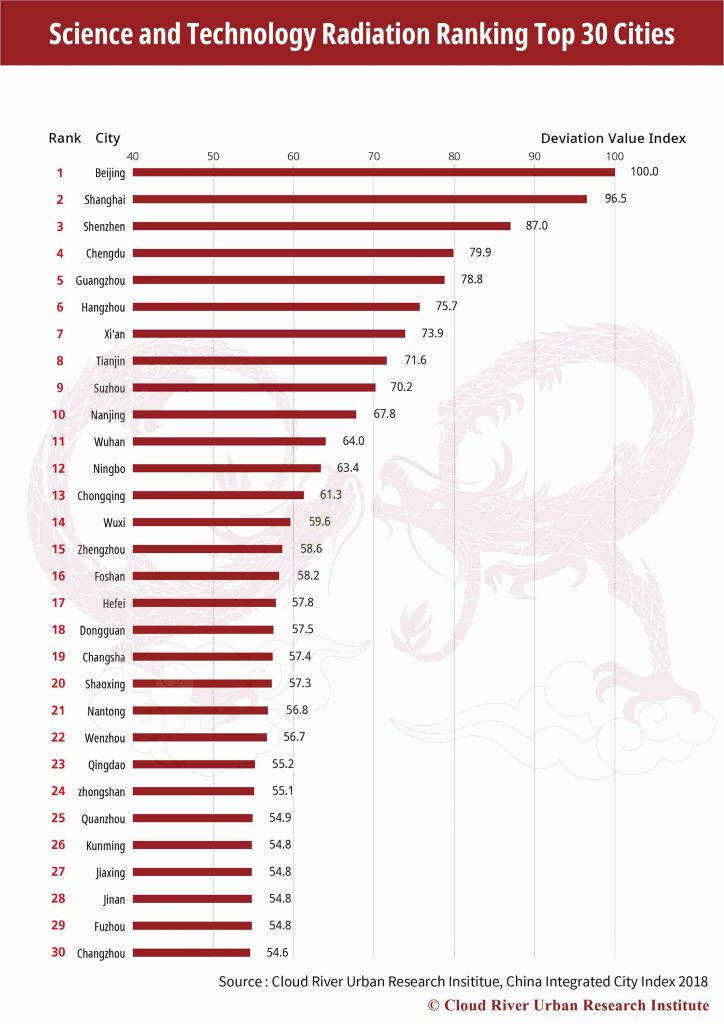
8. Top 30 Cities by Science and Technology Radiation
As to the science and technology radiation, the cities ranking the top 10 are Beijing, Shanghai, Shenzhen, Chengdu, Guangzhou, Hangzhou, Xi’an, Tianjin, Suzhou and Nanjing. These 10 cities account for 36.3% and 33.2% of the country’s human resources in R&D, and patent licenses. The top 30 cities make up 59.8% and 62.6% of the total respectively. It is noticeable that China’s science and technology resources are highly concentrated in the leading cities of the ranking.
It is particularly noteworthy that the top 30 cities also boast higher R&D and commercialization efficiency than other cities.
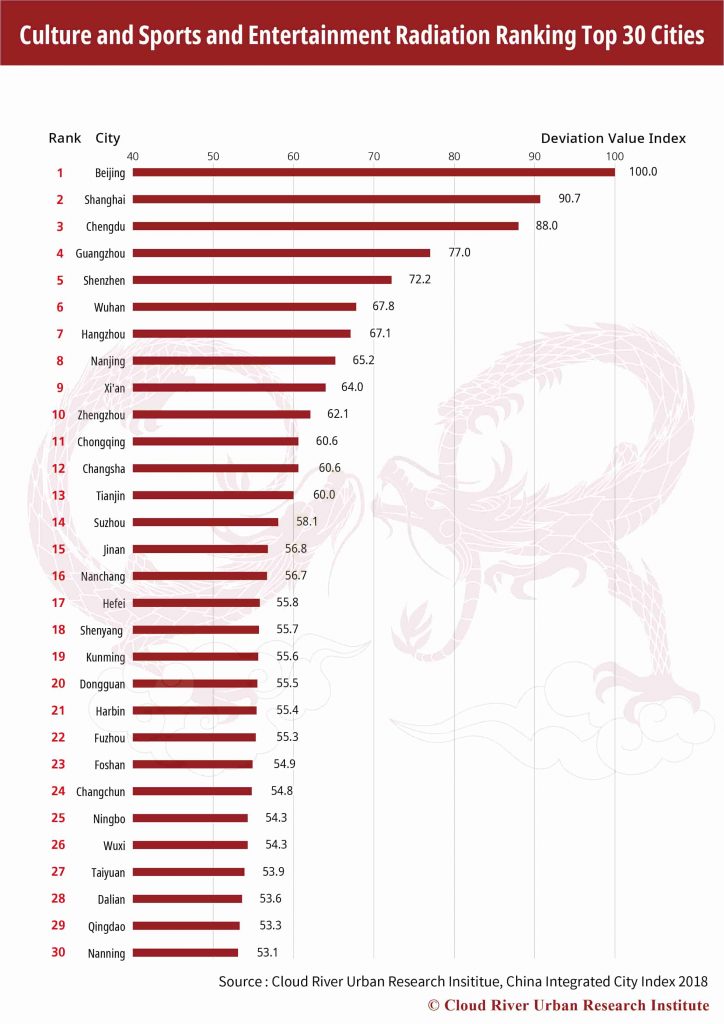
9. Top 30 Cities by Culture, Sports and Entertainment Radiation
The top 10 cities by culture, sports and entertainment radiation are Beijing, Shanghai, Chengdu, Guangzhou, Shenzhen, Wuhan, Hangzhou, Nanjing, Xi’an and Zhengzhou, which take up 34% of national total box office, and 30.6% of movie and theater attendance, while the top 30 cities account for 57.7% and 54.6% of the national total respectively.
The number represents increasing concentration of resources and consumption in culture, sports and entertainment in top ranking cities.
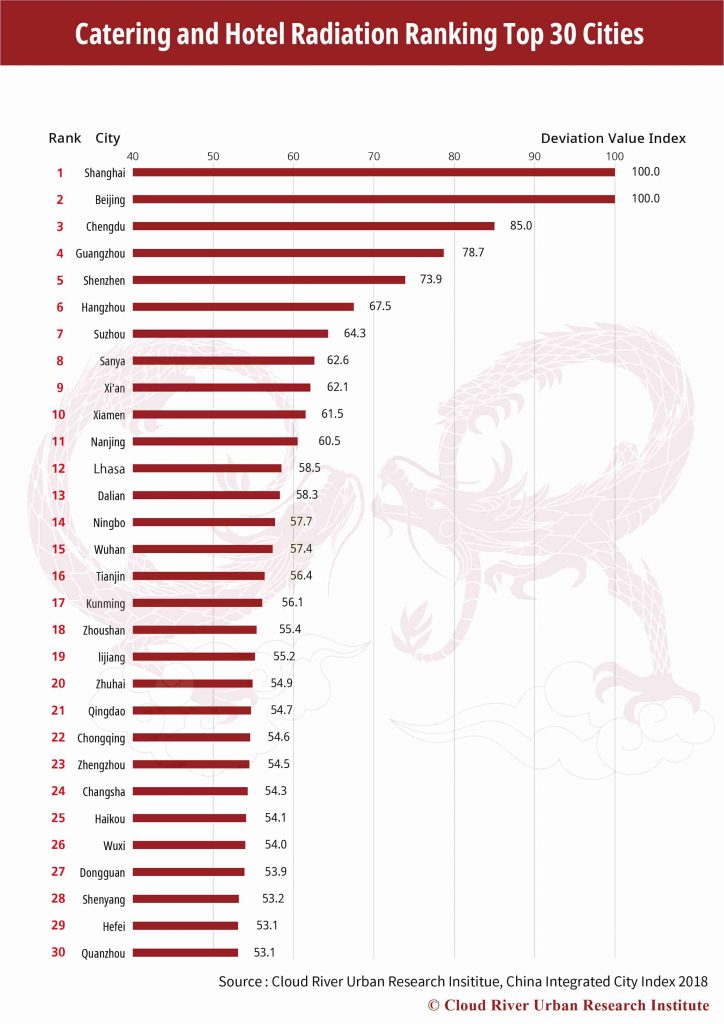
10. Top 30 Cities Catering and Hotel Radiation
Shanghai, Beijing and Chengdu top the catering and hotel radiation ranking, and are followed by Guangzhou, Shenzhen, Hangzhou, Suzhou, Sanya, Xi’an and Xiamen. The top 10 in total house 35.7% and 77.1% of China’s five-star hotels and international luxury restaurants, while the top 30 altogether take 61.1% and 91.8% of the country’s total. Therefore, this also represents a high concentration of luxury restaurants and hotels in higher ranking cities.
Based on studies of the China Integrated City Index 2018, Cloud River Research Institute also found very high correlations between IT industry radiation and catering and hotel radiation, with correlation coefficient at 0.9. This may be explained by the fact that communications among high-income and broad-minded IT professionals are often found at dinner tables.
It may be no coincidence that the top seven cities by IT industry radiation, namely Beijing, Shanghai, Shenzhen, Chengdu, Hangzhou, Nanjing and Guangzhou, are also famous for their food culture, which undoubtedly could contribute to the people’s communications and exchanges.
On the contrary, there is only a 0.68 correlation coefficient between the manufacturing radiation ranking and the catering and hotel radiation ranking, showing smaller gourmet appeal to people in the manufacturing sector compared to those in the IT sector.
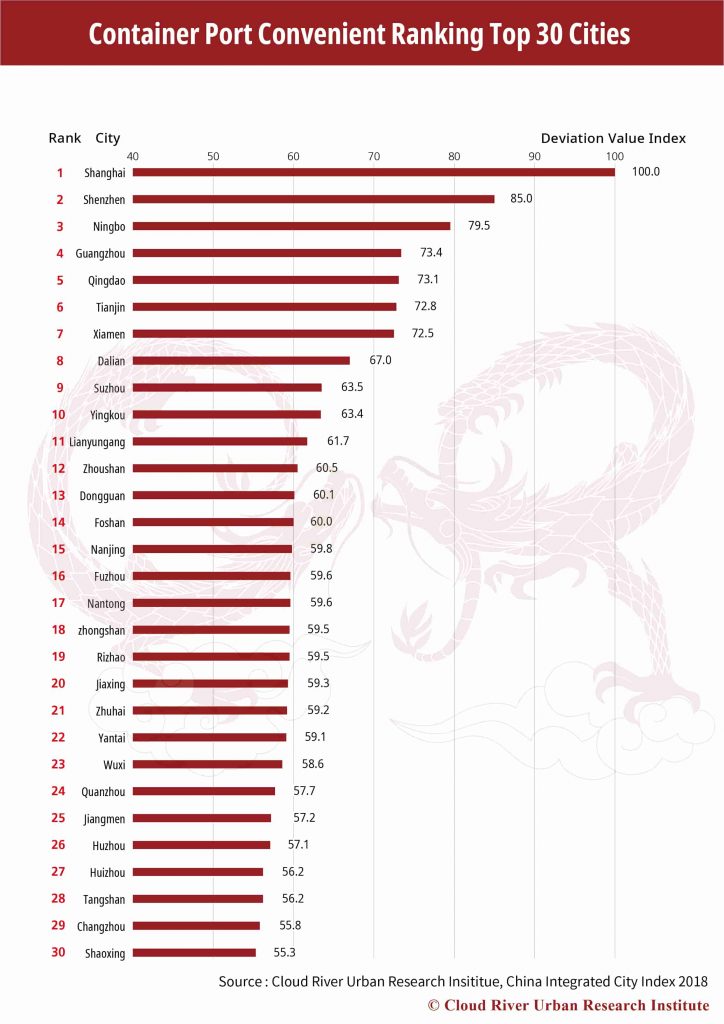
11. Top 30 Cities by Container Port Convenience
The top 10 cities by container port convenience, i.e. Shanghai, Shenzhen, Ningbo, Guangzhou, Qingdao, Tianjin, Xiamen, Dalian, Suzhou and Yingkou, altogether account for 82% of the country’s overall container throughput, while the top 30 take 97.8%. In other words, almost all of the country’s container throughput are handled by the top 10% in the port convenience ranking.
Drawing on research findings of 298 cities at prefecture level and above from China Integrated City Index 2018, Cloud River Research Institute also found high correlations between the city’s export volume in goods and the container port throughput, with correlation coefficient at 0.81. Moreover, 24 of the top 30 cities by manufacturing radiation are also among the top 30 cities by container port convenience. This shows that the manufacturing industry, especially those involved in exporting trade, depends heavily on the port environment. In this sense, China’s export-oriented manufacturing is expected to be increasingly concentrated in well-established port cities.
In view of the high correlations between industrial development and port environment, China needs to learn lessons from the inefficient and decentralized industrial development in the past, and explore new ways for high-quality development in the future.
12. Top 30 Cities by Airport Convenience
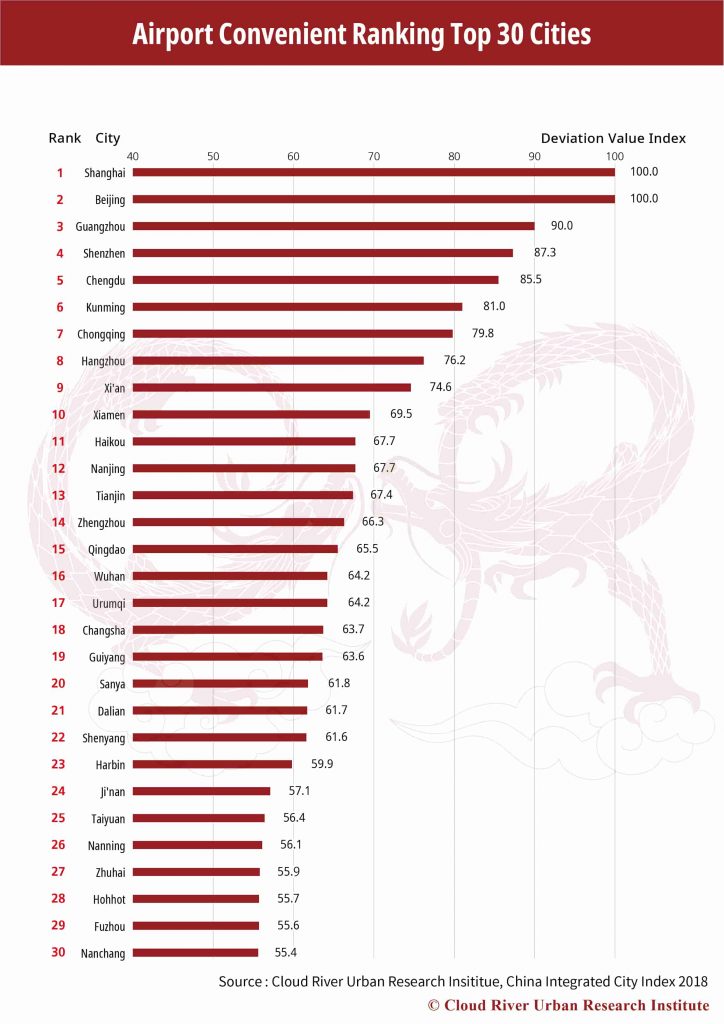
The top 10 cities by airport convenience, i.e. Shanghai, Beijing, Guangzhou, Shenzhen, Chengdu, Kunming, Chongqing, Hangzhou, Xi’an and Xiamen, account for a combined 49.9% of the country’s total passenger throughput and 73.5% the cargo throughput, while the top 30 cities took 81.3% and 92.9% respectively. Therefore, the big majority of China’s passenger and logistic flows is highly concentrated in the top 10% cities by airport convenience.
Again, the institute found a high correlation between a city’s IT industry radiation and airport convenience, with correlation coefficient at 0.82. Moreover, 21 cities among the top 30 cities by the IT industry radiation were also among the top 30 cities by airport convenience. This shows that the development of the IT industry hinges much on highly efficient airport facilities, and the industry is expected to further cluster into cities with more convenient airport networks.
Today, China’s GDP, DID population and various other functions are increasingly concentrated in a handful of big cities, megacities, as well as megalopolises, and the trend is getting stronger. Therefore, improving the economic and space structure of these big cities, megacities and megalopolises is key to China’s high-quality development.
english.scio.gov.cn丨Updated: January 6, 2020
