Quality and challenges of Chinese megalopolises: A look at major environmental rankings of China Integrated City Index 2022

Cloud River Urban Research Institute


Editor’s note:

Chinese cities still face environmental challenges although their increasing wealth. Which Chinese megalopolis enjoys best climate conditions? Which Chinese megalopolis has the highest agricultural productivity? Which megalopolis boasts the best air quality? And which megalopolis faces the most daunting task in reducing carbon emissions? In the environmental rankings of the China Integrated City Index 2022, Cloud River Urban Research Institute has utilized a series of environmental data to analyze the environmental quality and challenges of 19 megalopolises in China.


1. Large cities dominate environmental rankings


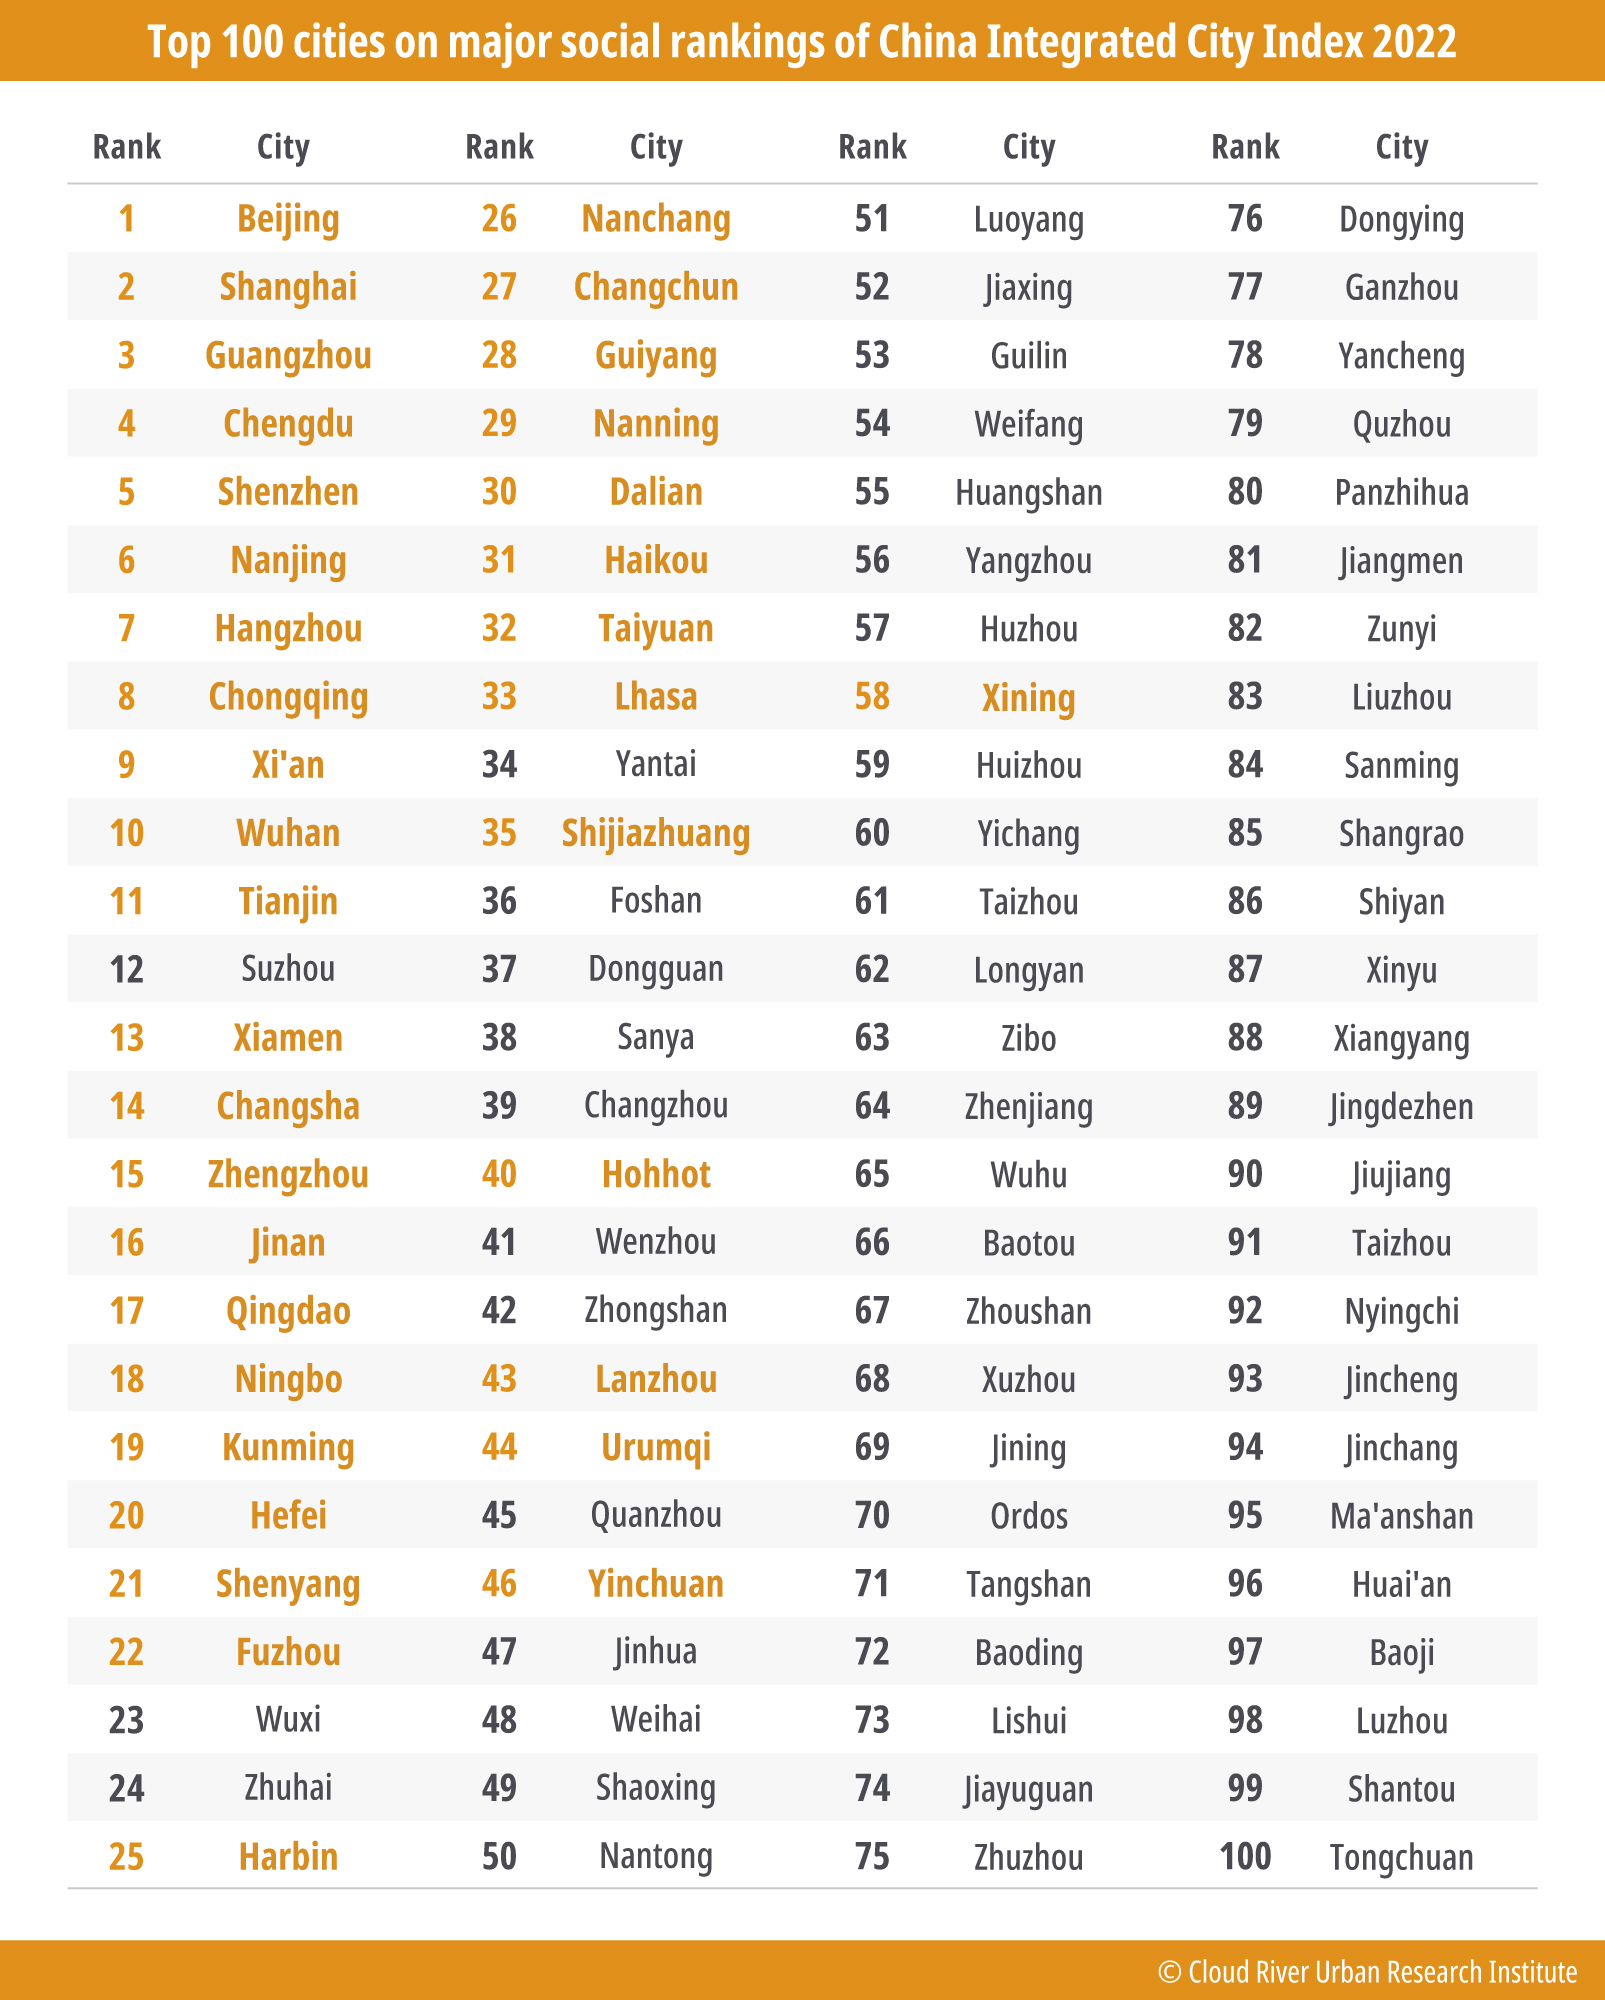
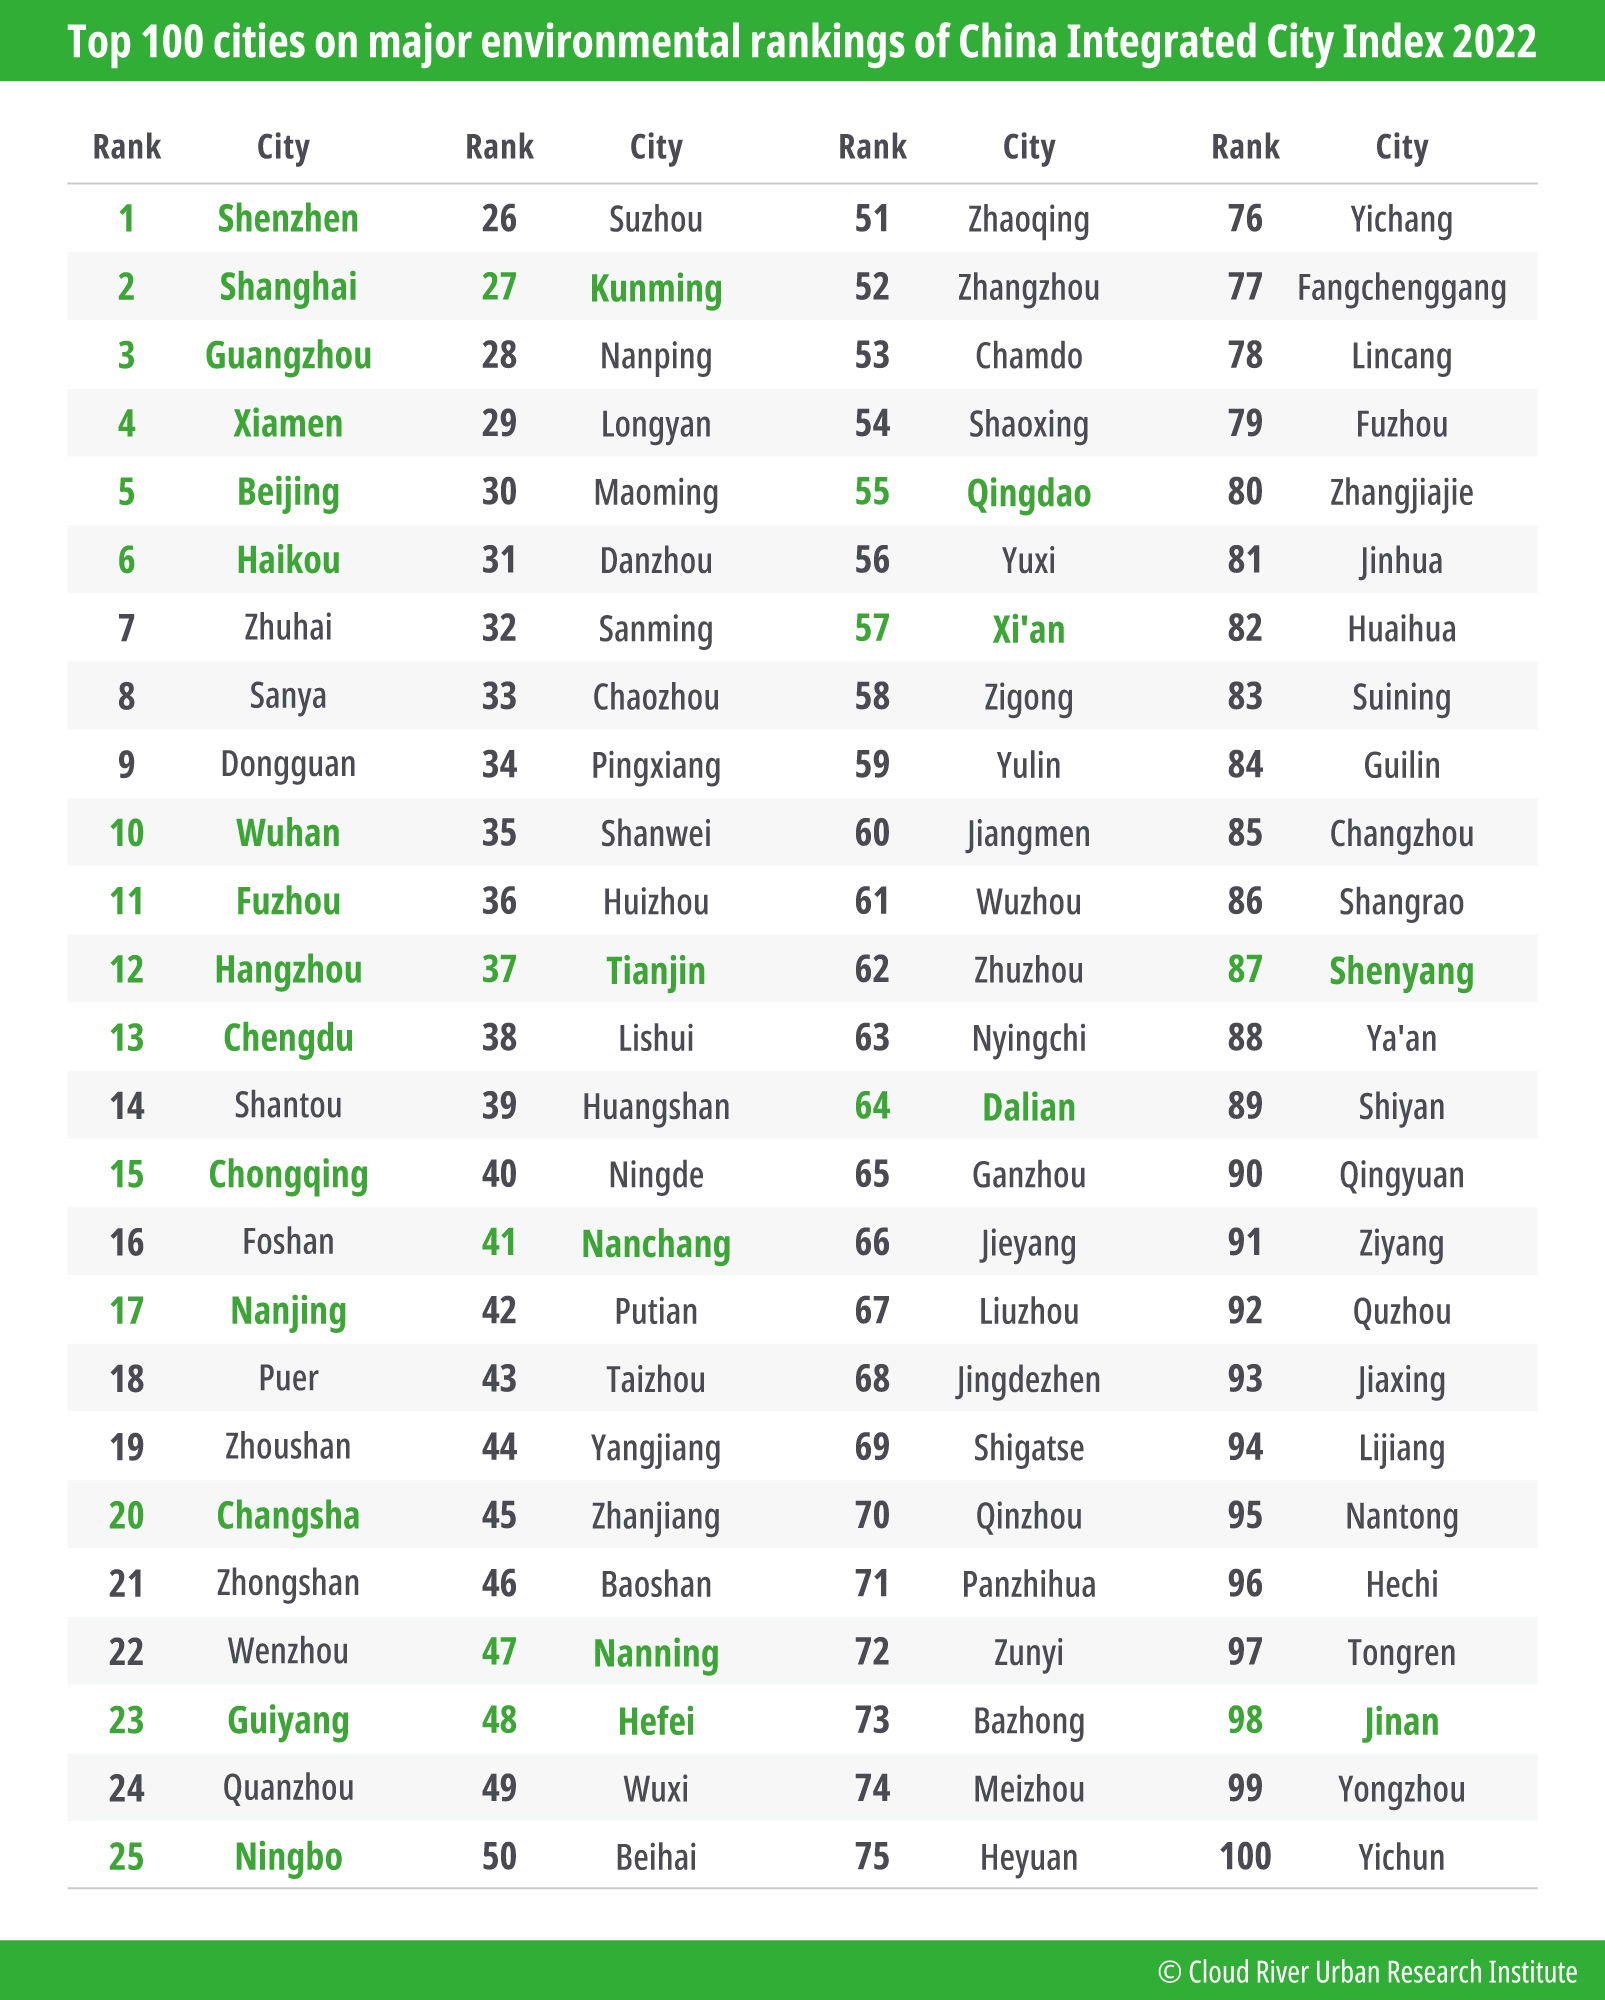
According to the major environmental rankings of the China Integrated City Index 2022 (hereinafter referred to as the Index), the top 10 cities are Shenzhen, Shanghai, Guangzhou, Xiamen, Beijing, Haikou, Zhuhai, Sanya, Dongguan, and Wuhan. Compared to 2021 rankings, economically developed cities have made into the top 10. This is because the 2022 edition puts more emphasis on investment in environmental improvement compared to the 2021 edition.

Huang Weibo, a former senior official of the National Development and Reform Commission, commented, “The environmental rankings of the Index reveal that the top 10 cities, excluding Wuhan, are all located in eastern China. This shows the region’s efforts toward green development. As a national core city, Wuhan has played a leading role in promoting high-quality development in central China in the new era.”

Ming Xiaodong, former first-level inspector of the Department of Development Planning of the National Development and Reform Commission and former minister-counsellor of the Chinese Embassy in Japan, pointed out the environmental rankings of the Index encompasses natural ecology, environmental quality, and spatial structure, includes nine sub-items, namely soil and water endowment, climate conditions, natural disasters, pollution load, environmental efforts, resource efficiency, compact urban areas, transportation networks, and urban facilities, utilizes 452 sets of environmental-related data, and ranks 297 cities at or above the prefectural level and 19 megalopolises. 

He said the results show that economically developed cities and rapidly developing megalopolises have achieved significant success in high-quality development. The top 20 cities include four first-tier cities, six quasi-first-tier cities, and nine second-tier cities. 

He said these cities have their own characteristics, including the most economically developed, those that have experienced rapid development in recent years, and those continuously optimizing their industrial structures. This indicates that improving the ecological environment and achieving China’s dual carbon goals entail not only arduous efforts but also solid economic and technological support.

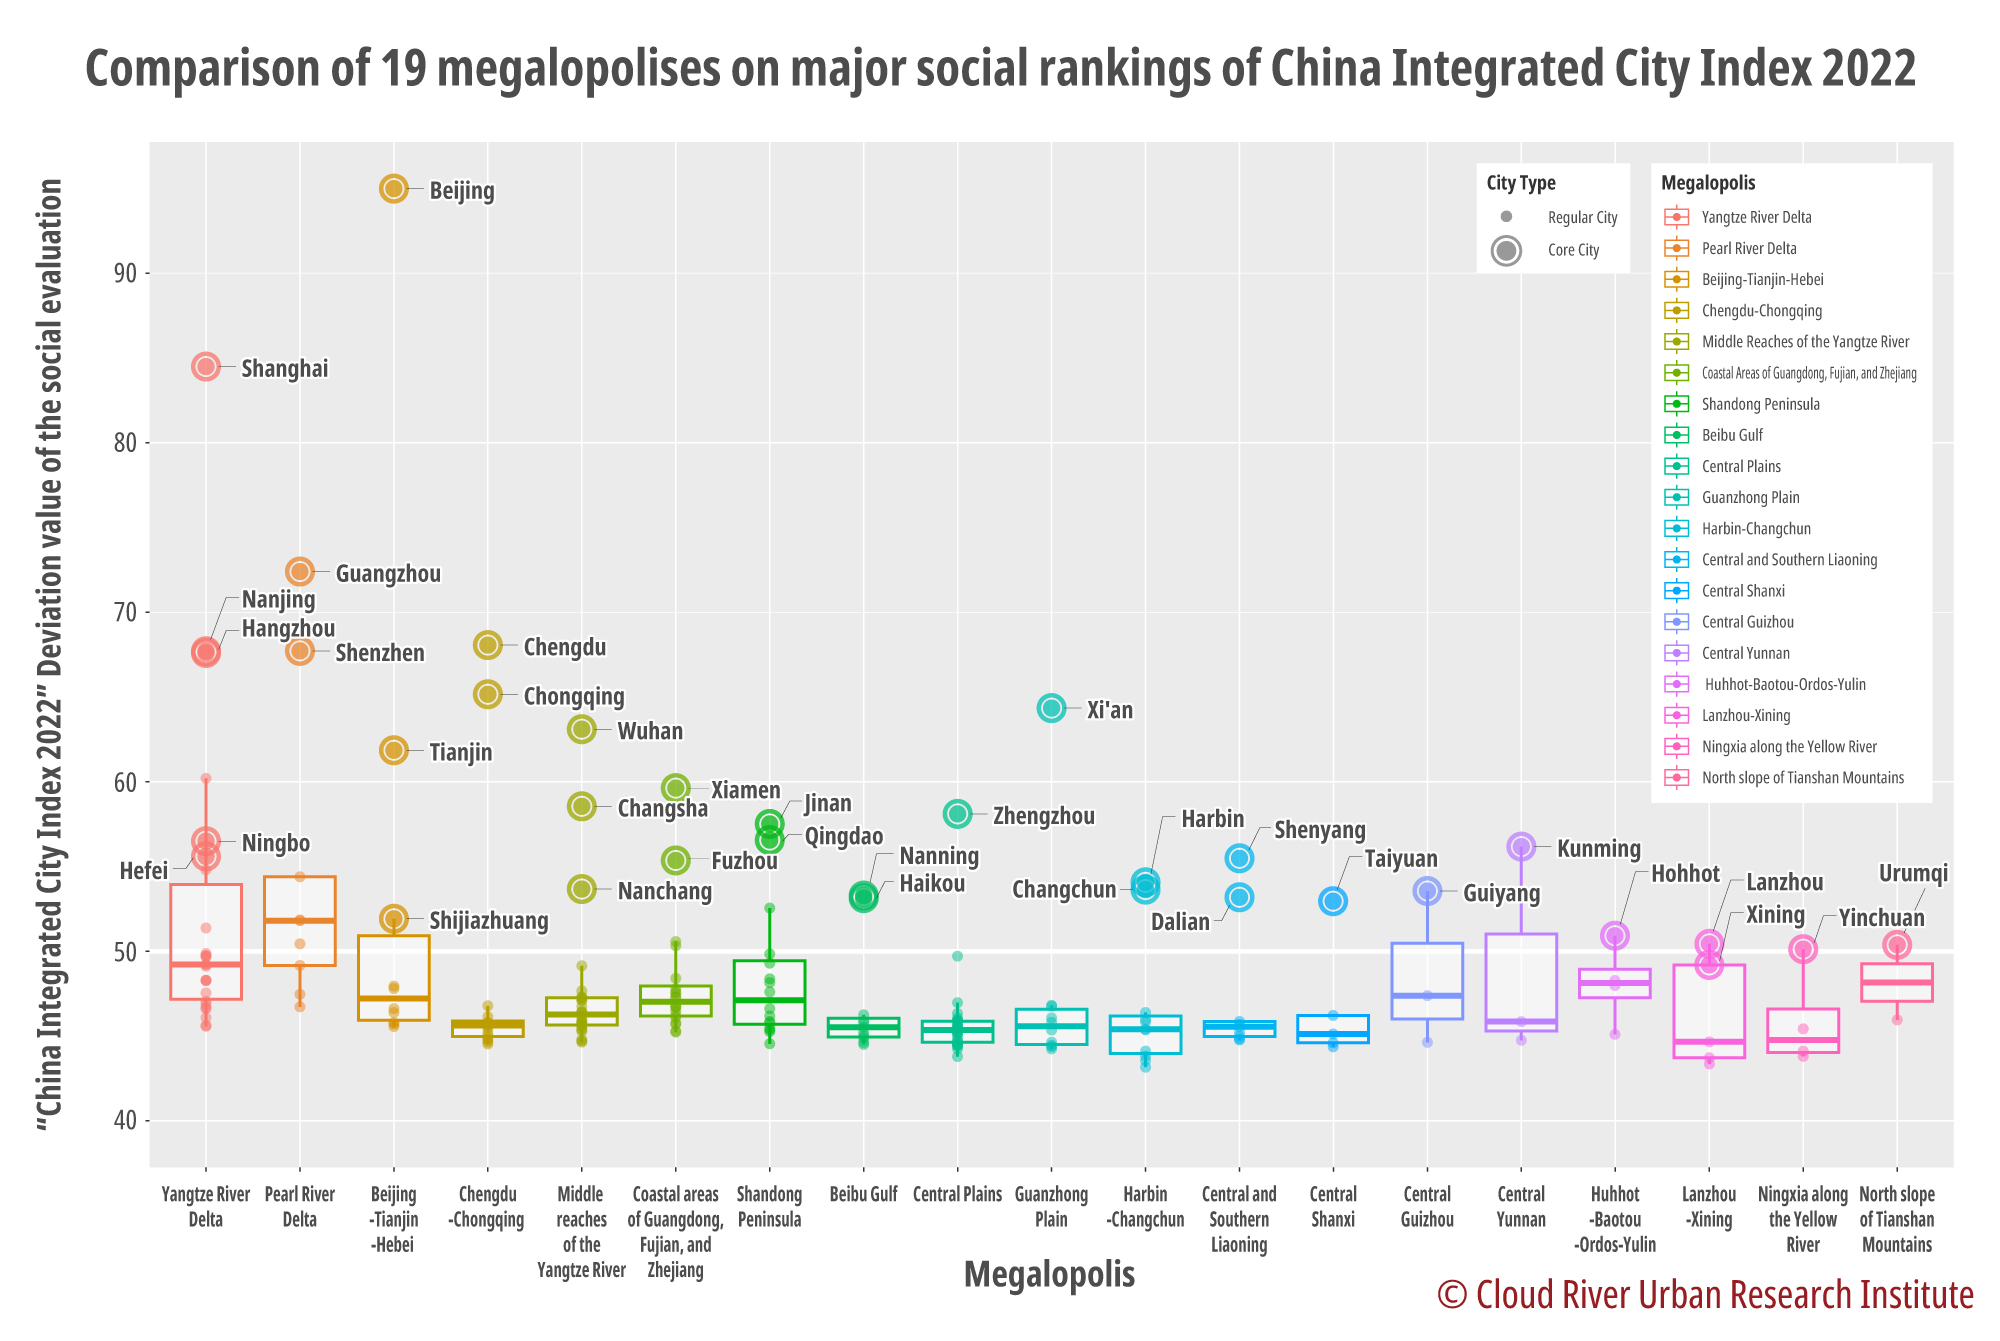
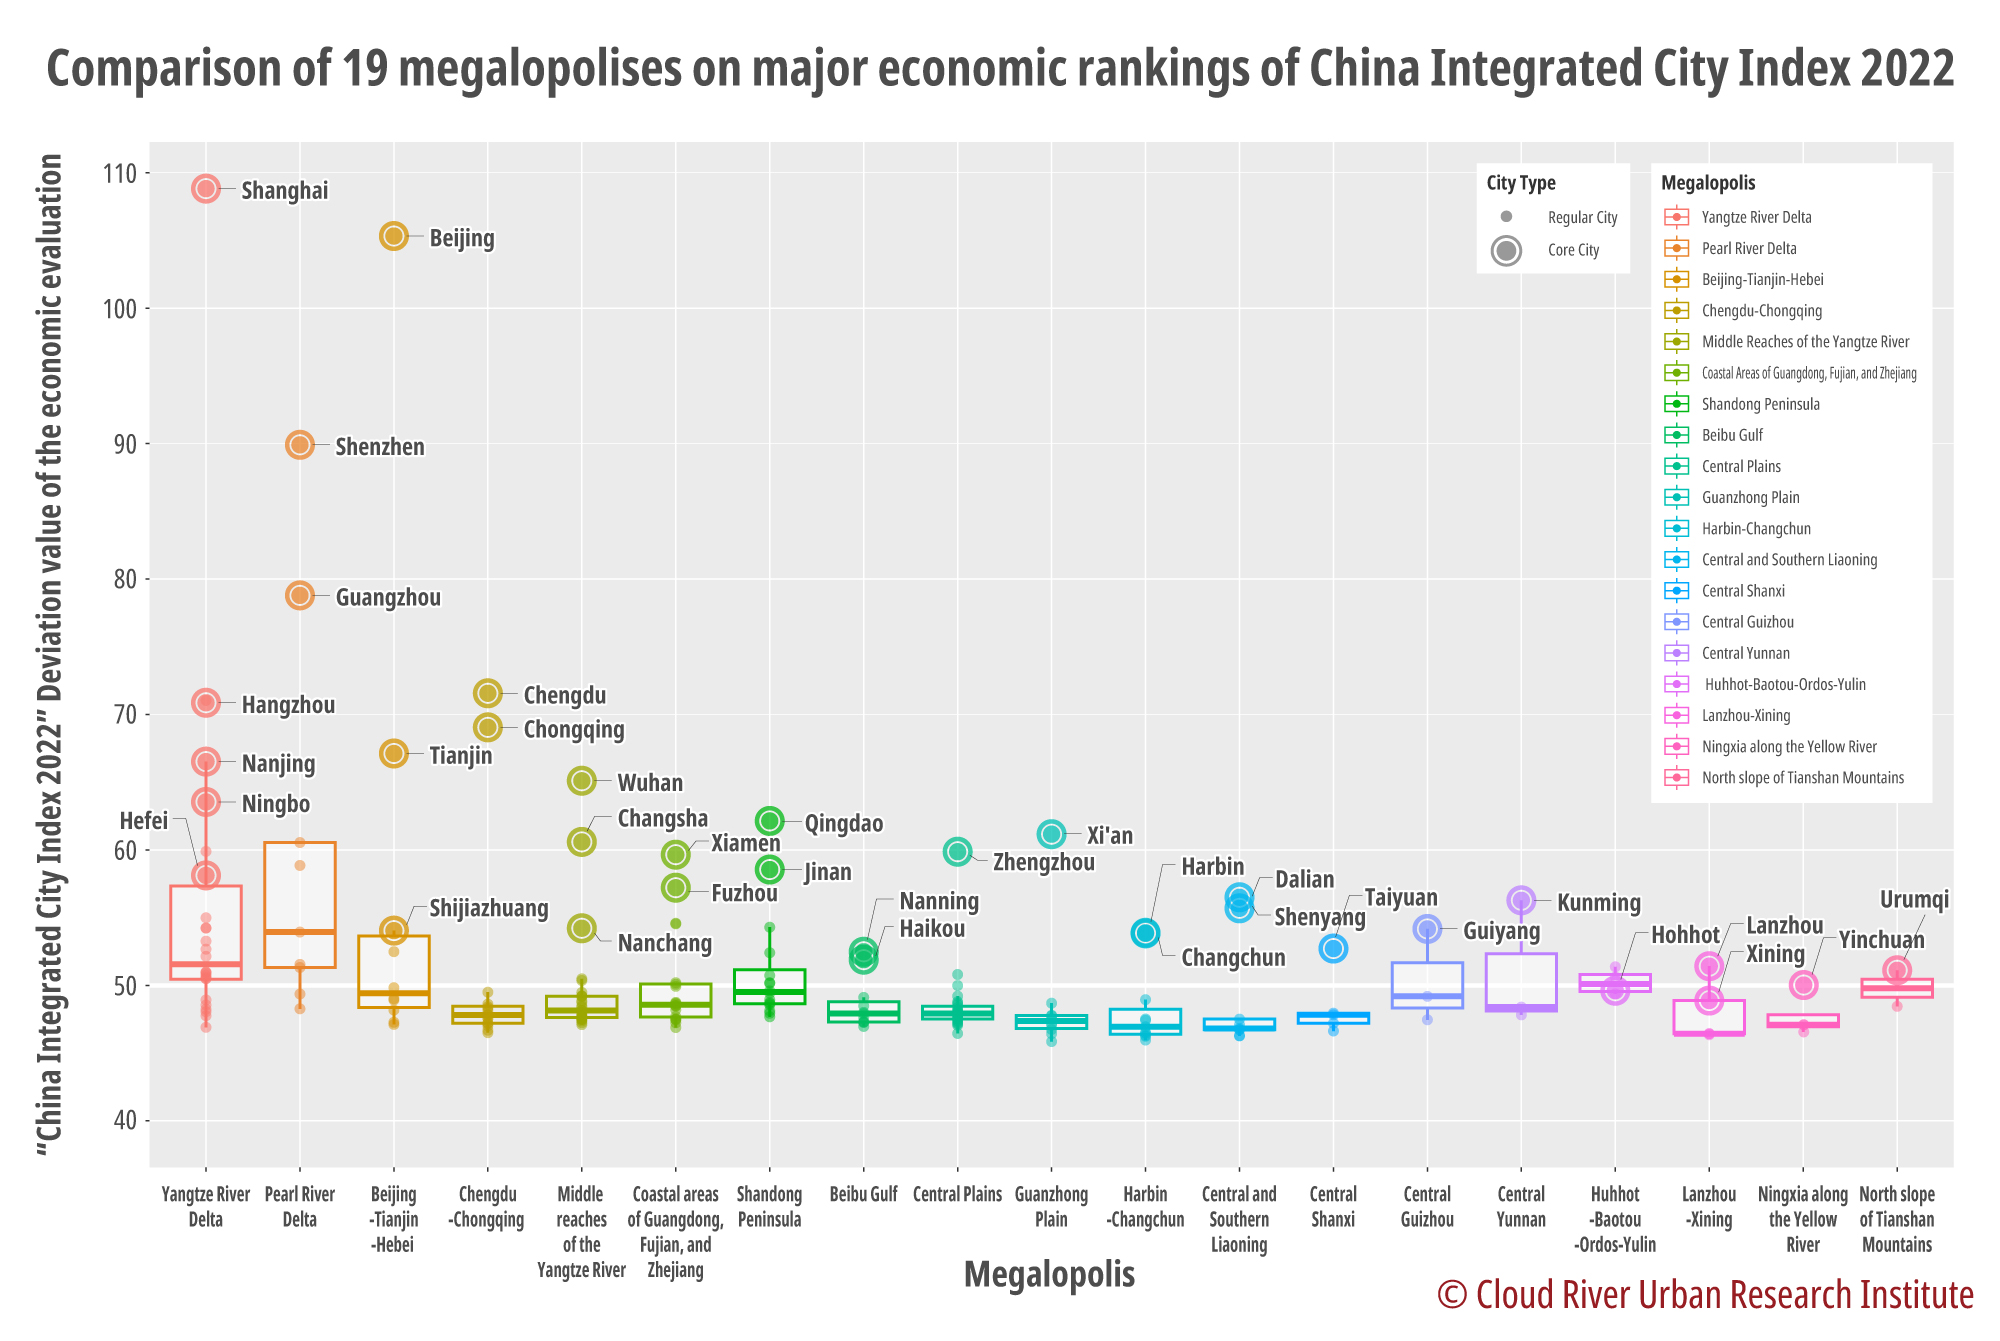
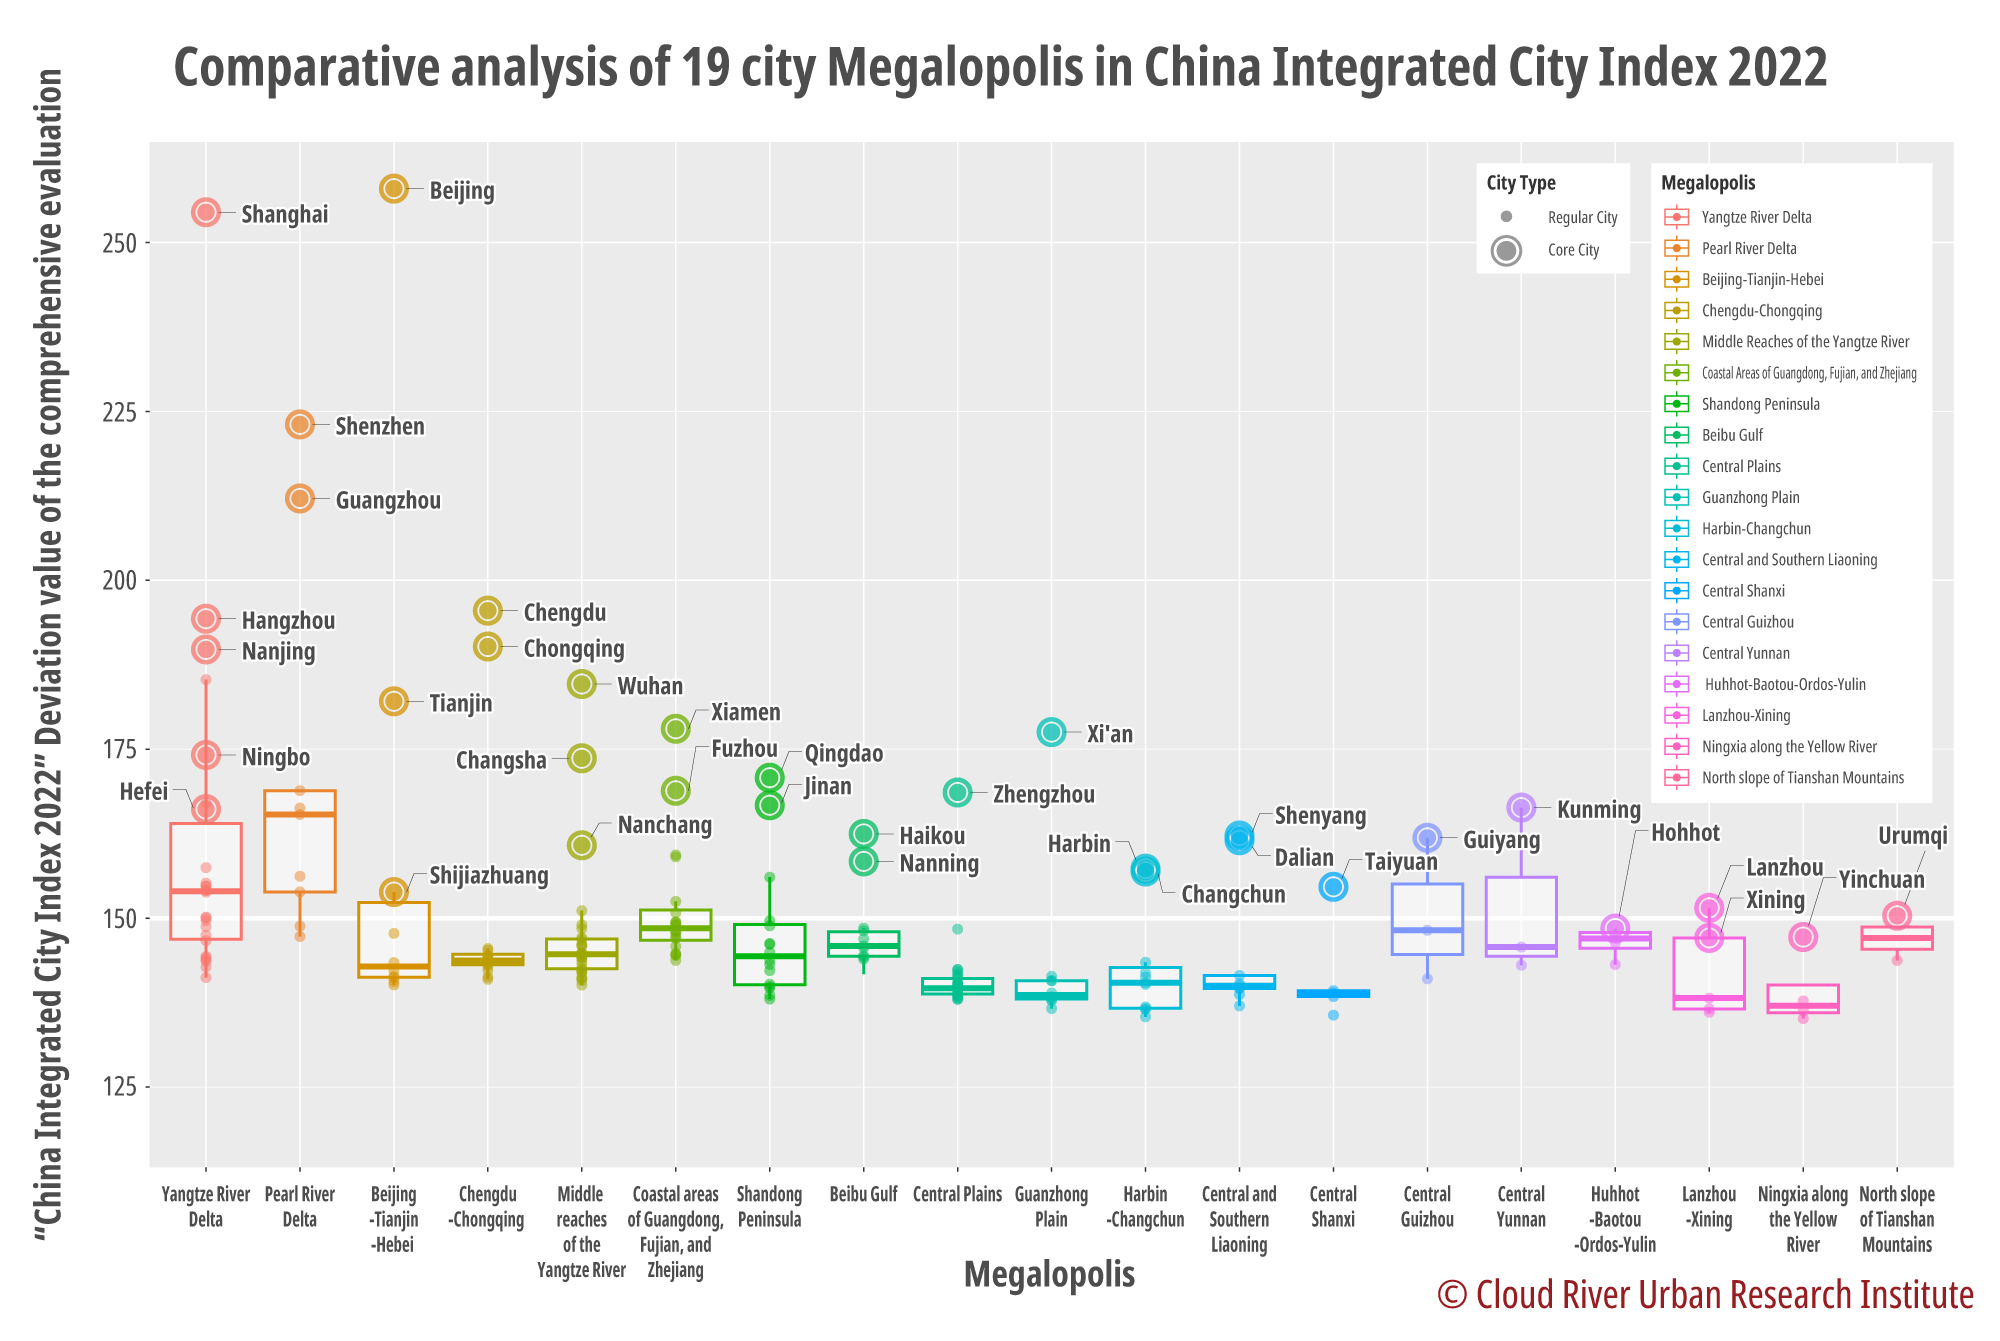
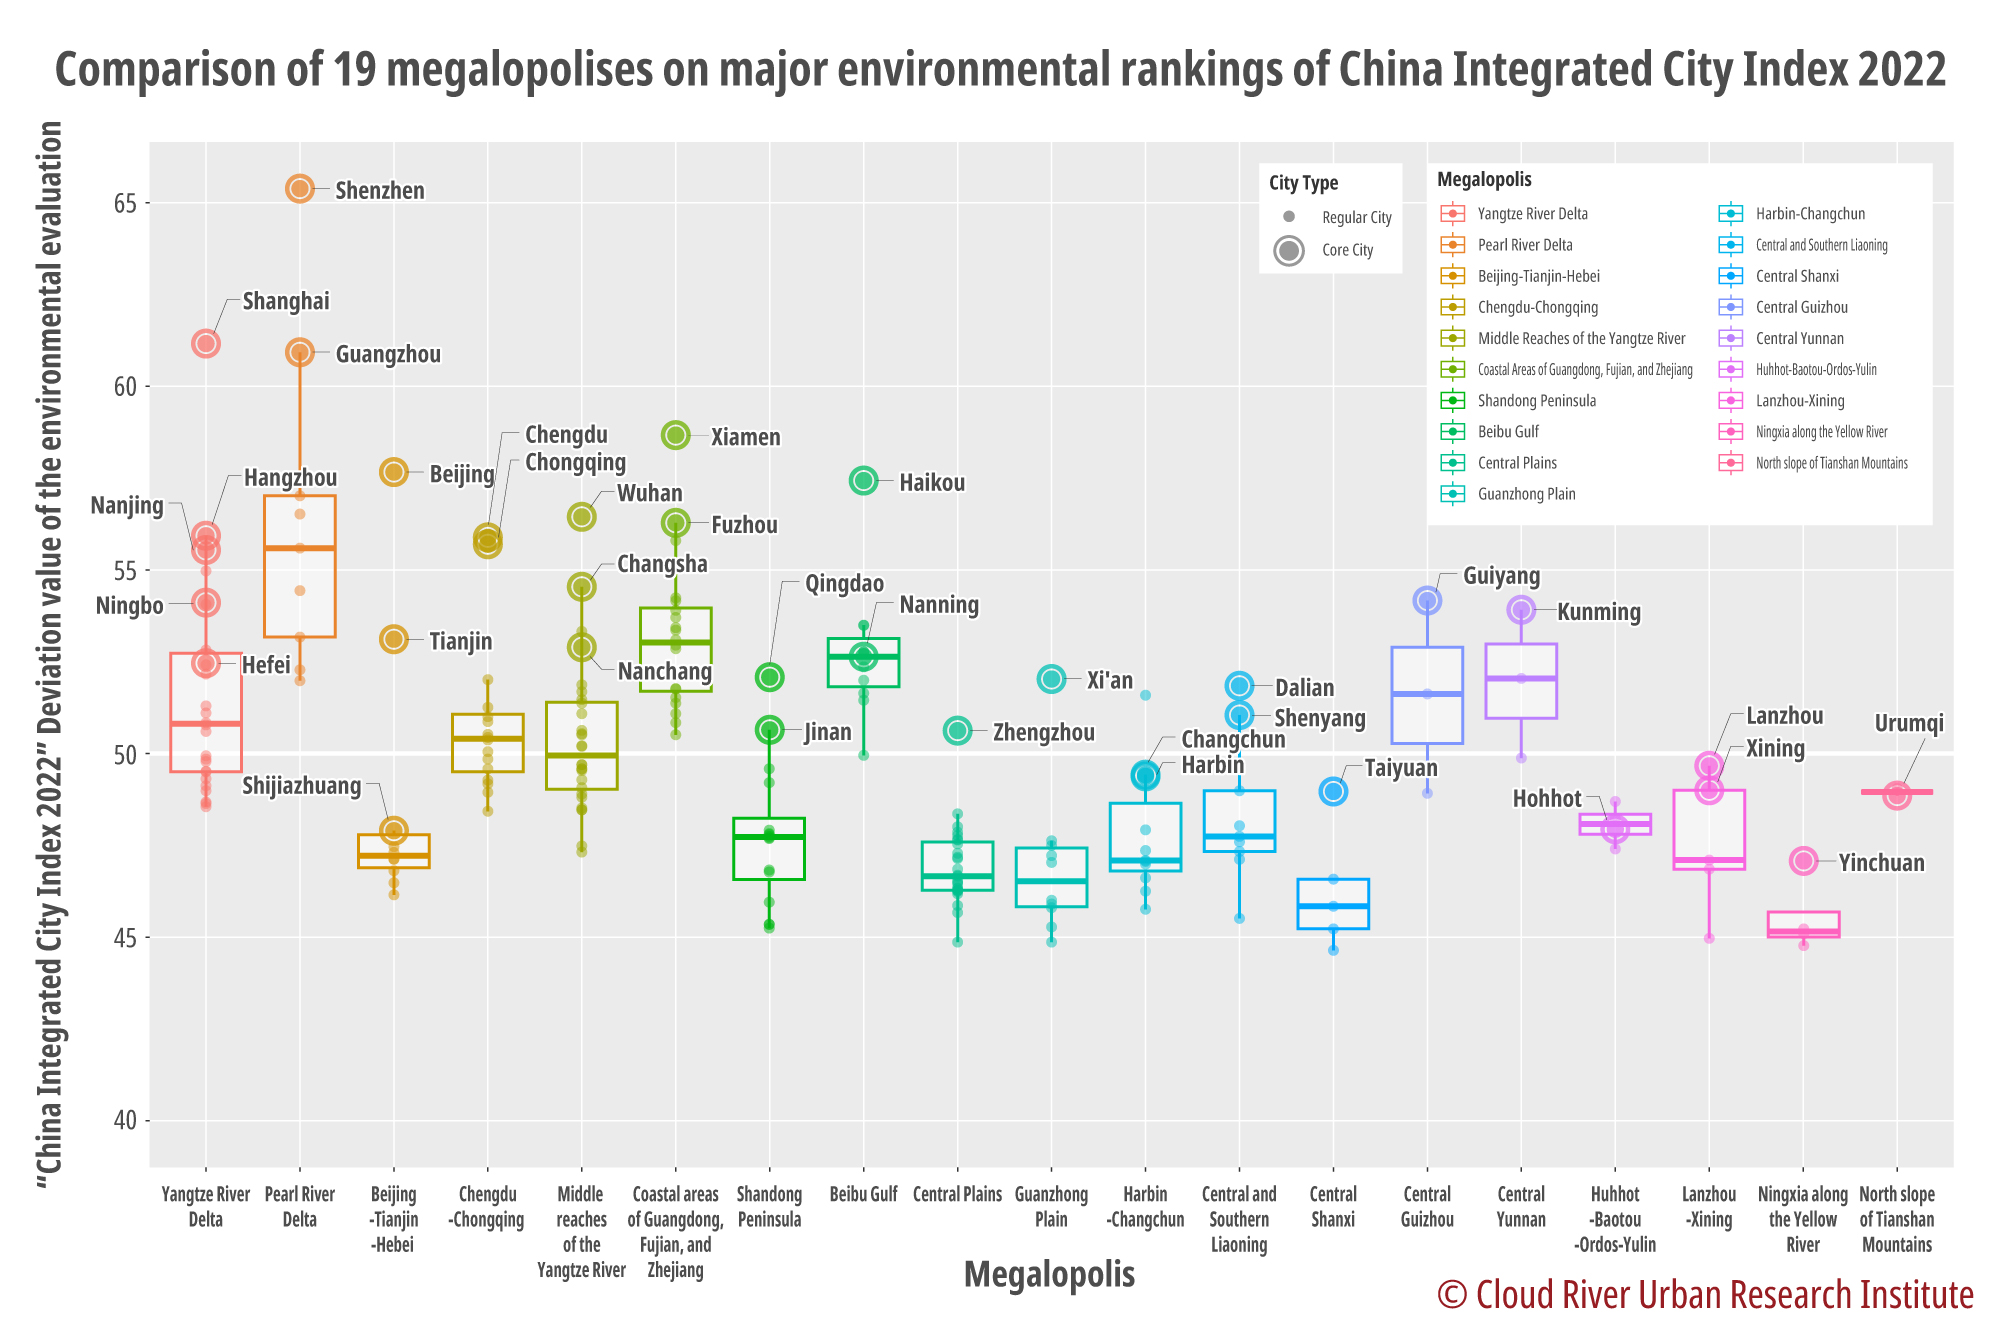
This article focuses on analyzing the performance of the 19 megalopolises in terms of environment in 2022. Using box plots and overlaid bee swarm plots, the article presents the distribution and degree of deviation in the environmental rankings of 223 cities at or above the prefectural level in the 19 megalopolises. The Pearl River Delta fares best, followed by coastal areas of Guangdong, Fujian, Zhejiang provinces, the Beibu Gulf, central Yunnan, central Guizhou, the Yangtze River Delta, and the Chengdu-Chongqing Economic Circle. The remaining 12 megalopolises have their environmental indicators below the national average, with the areas along the Yellow River in northern Ningxia ranked at the bottom.

Ming Xiaodong noted that among the seven megalopolises with environmental indicators above the national average, there are two first-tier megalopolises, two quasi-first-tier megalopolises, and three second-tier megalopolises. Among the 12 megalopolises with their environmental indicators below the national average, there is one first-tier megalopolis, two quasi-first-tier megalopolises, seven second-tier megalopolises, and two third-tier megalopolises. The megalopolises near the top on the rankings mostly have large GDP and favorable natural conditions.

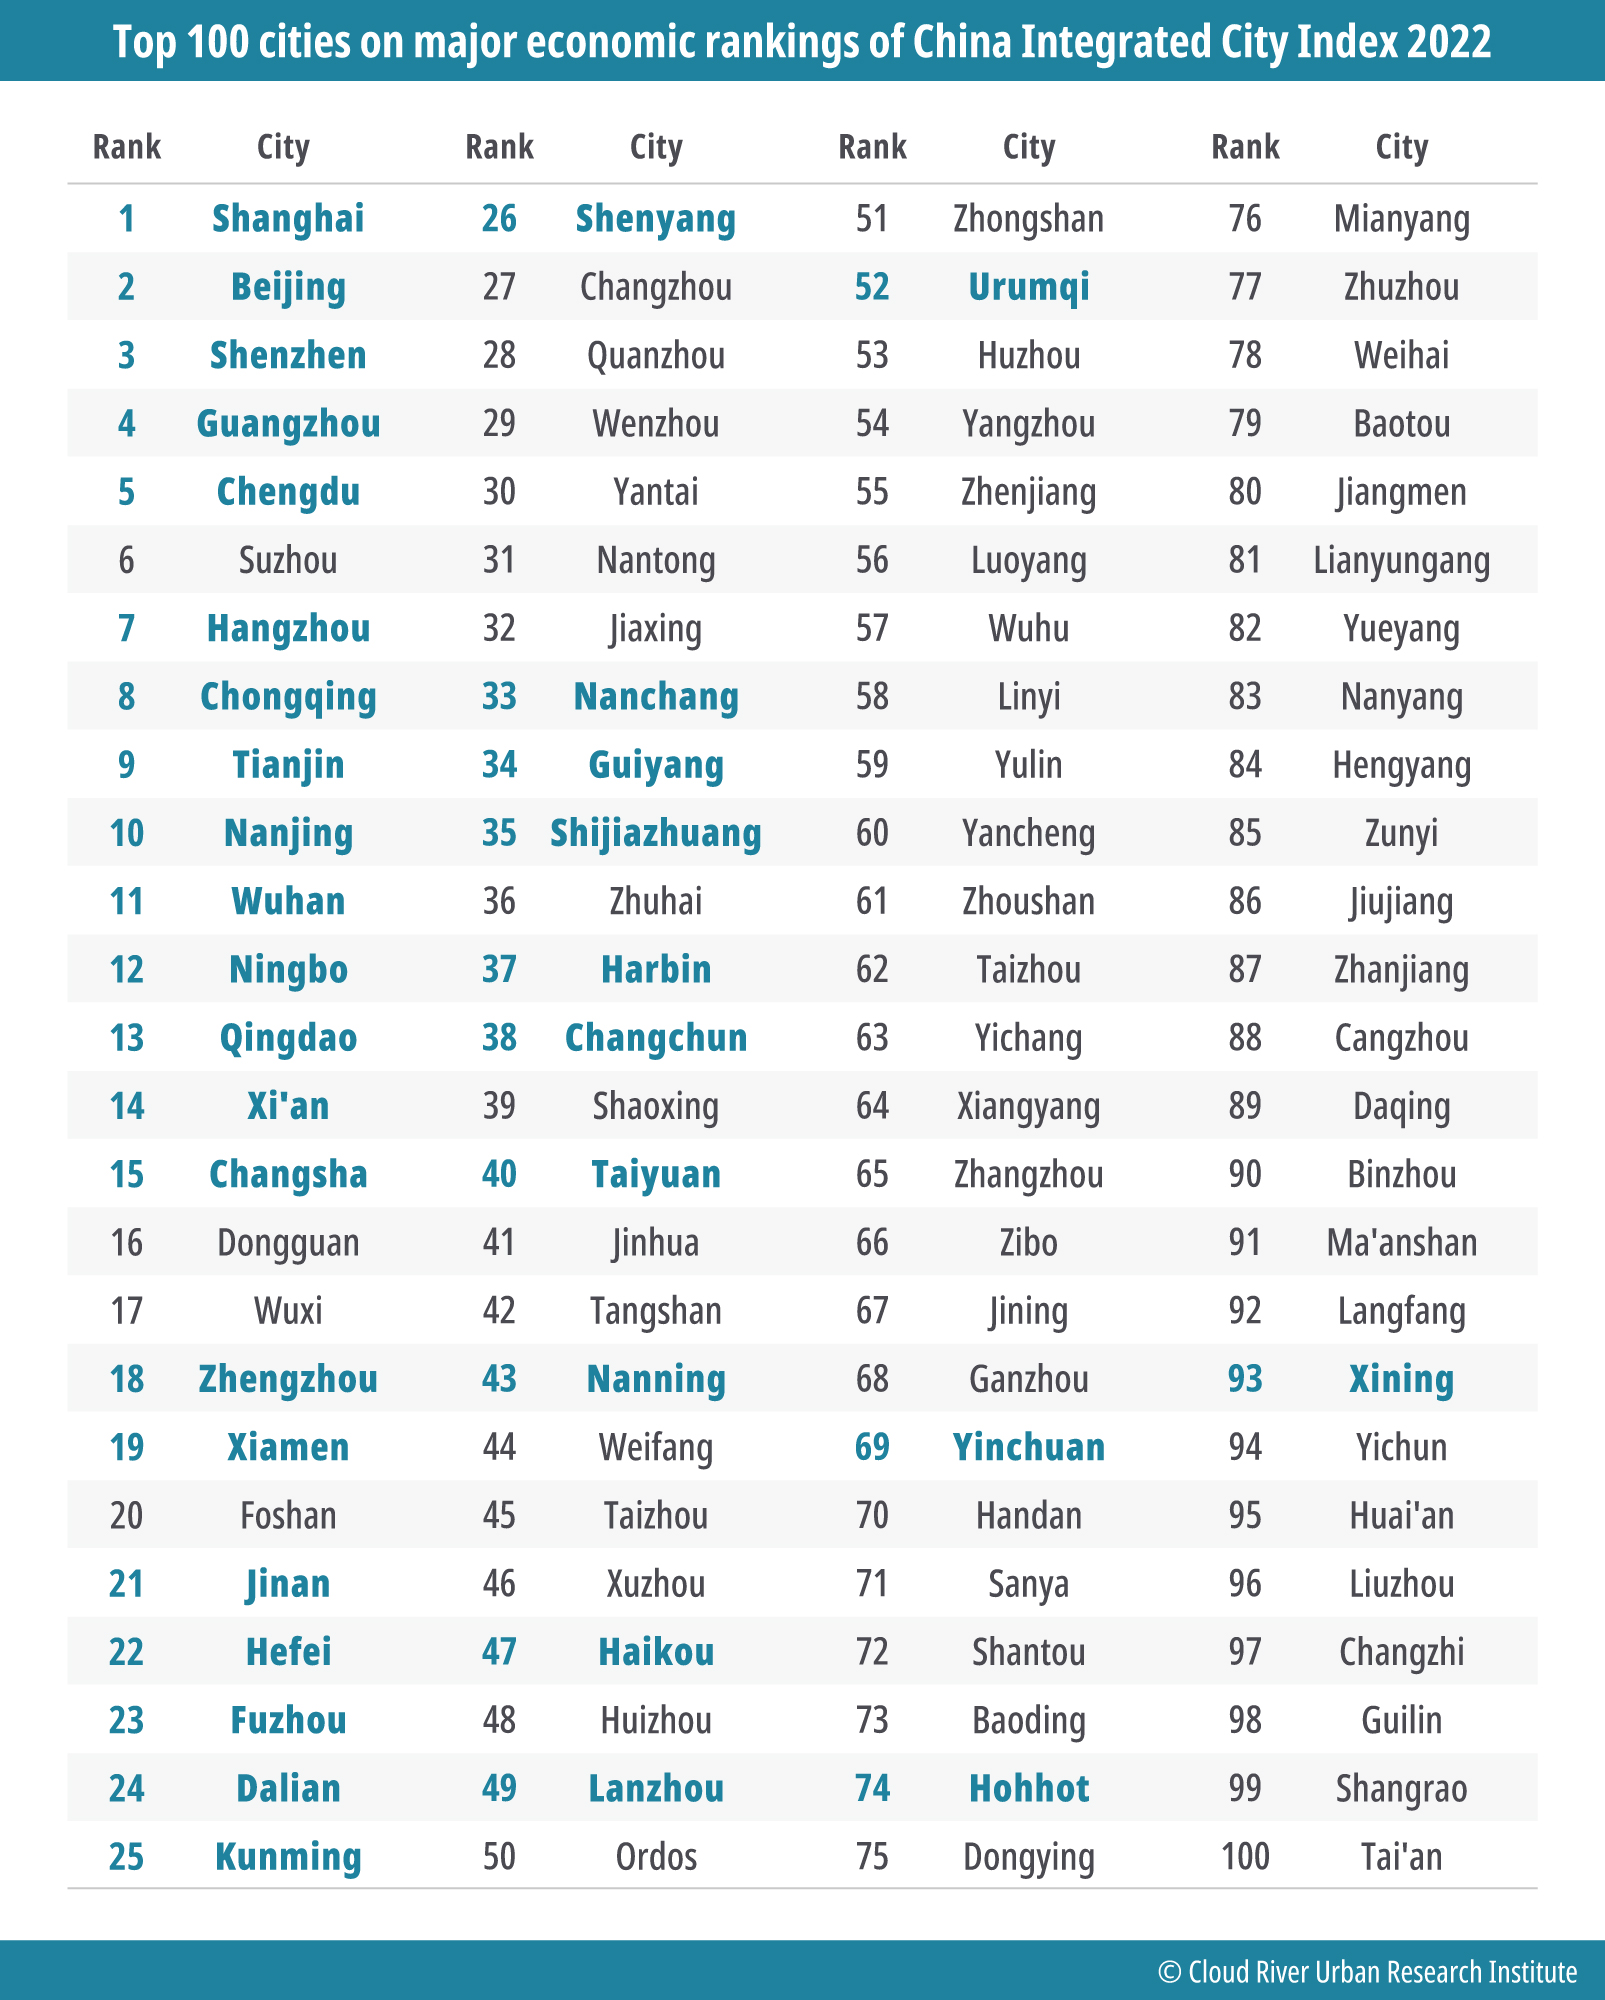
Top 100 cities on major environmental rankings of China Integrated City Index 2022

2. Comfortable climate key to population concentration


Climate is one of the most crucial factors for human habitation. Among the 19 megalopolises, the ones with the best climate are the Pearl River Delta, the Beibu Gulf, central Yunnan, coastal areas of Guangdong, Fujian, Zhejiang provinces, the Chengdu-Chongqing Economic Circle, the middle reaches of the Yangtze River, central Guizhou, and the Yangtze River Delta. These megalopolises are predominantly located in southern China. Approximately 45.5% of China’s population concentrates in these megalopolises which enjoy a good climate.

The climate comfort of the remaining 11 megalopolises is below the national average, among which the Harbin-Changchun region and the northern slopes of the Tianshan Mountains are endowed with the least favorable climate conditions.

3. Most first-tier and quasi-first-tier cities concentrate in areas with higher rainfall


Rainfall is another crucial factor for human habitation. Among the 19 megalopolises, those with the highest rainfall are the Pearl River Delta, coastal areas of Guangdong, Fujian, Zhejiang provinces, and the Beibu Gulf. Other city clusters with above-average rainfall include the Yangtze River Delta, the middle reaches of the Yangtze River, the Chengdu-Chongqing Economic Circle, and central Guizhou. Three out of four first-tier cities and seven out of nine quasi-first-tier cities are concentrated in areas with rainfall above the national average. These seven megalopolises are located in southern China.

The remaining 12 megalopolises have their rainfall levels below the national average, with the areas along the Yellow River in northern Ningxia and the northern slopes of the Tianshan Mountains having the least rainfall, followed by the Hohhot-Baotou-Erdos-Yulin region, and the Lanzhou-Xining region.

4. Agricultural productivity varies from north to south


Agricultural productivity is higher in southern China and lower in northern China. Among the 19 megalopolises, the areas with the largest arable land are the Harbin-Changchun region and the Central Plains, accounting for 11.2% and 10.7% of the national total, respectively. Among the first-tier megalopolises, the Yangtze River Delta, the Pearl River Delta, and the Beijing-Tianjin-Hebei region account for 4.5%, 0.4%, and 3.1% of the national total, with the Pearl River Delta taking the smallest share. Among quasi-first-tier megalopolises, the Chengdu-Chongqing Economic Circle, the middle reaches of the Yangtze River, coastal areas of Guangdong, Fujian, Zhejiang provinces, and the Guanzhong Plain account for 4.8%, 6.6%, 2.1%, and 2.4% of the national total, with the middle reaches of the Yangtze River taking the largest share.

The Pearl River Delta, coastal areas of Guangdong, Fujian, Zhejiang provinces, the Beibu Gulf, the Yangtze River Delta, and the Chengdu-Chongqing Economic Circle have highest agricultural productivity (GDP of the primary industry per unit of arable land), all above the national average. Agricultural productivity of the remaining 14 megalopolises is below the national average, among which Harbin-Changchun region and the Central Plains have the largest arable land.

Professor Zhou Muzhi, head of Cloud River Urban Research Institute, pointed out agricultural productivity is influenced by not only natural factors such as climate, land resources, and water resources, but also investment in agriculture. It can be seen that the five megalopolises with agricultural productivity above the national average are all in southern China, and most of them have strong capabilities for substantial investment in agriculture.

5. Northern China faces bigger carbon reduction challenges than southern China


As the dual carbon goals become China’s national strategy, carbon emissions serve as a significant indicator for assessing low-carbon economic development in different regions. The Yangtze River Delta takes the largest share of China’s carbon emissions with 16%. The Pearl River Delta and the Beijing-Tianjin-Hebei region take 5.6% and 8.6%, respectively. The three regions contribute a combined 30.2%. Among quasi-first-tier megalopolises, the Chengdu-Chongqing Economic Circle, the middle reaches of the Yangtze River, coastal areas of Guangdong, Fujian, Zhejiang provinces, and the Guanzhong Plain take shares of 2.9%, 4.7%, 4.7%, and 3.1%, respectively, totaling 15.4%. Additionally, the Central Plains, the Shandong Peninsula, the Harbin-Changchun region, the Hohhot-Baotou-Erdos-Yulin region, and central and southern parts of Liaoning take 8.8%, 7.8%, 4.9%, 3.3%, and 2.9% of carbon emissions, respectively. The total carbon emissions from the 19 megalopolises account for 80.9% of the national total.

Ming Xiaodong pointed out that megalopolises are densely populated areas and large carbon emitters. They are key to achieving the dual carbon goals and the goal of building a beautiful China. The carbon emissions of the three first-tier and four quasi first-tier megalopolises account for 45.6% of China’s carbon emissions.

He said, “These megalopolises make significant efforts in carbon reduction, and we anticipate continuous improvement in the quality of the development of cities in the megalopolises.”

Carbon intensity, also known as carbon emissions per unit of GDP, is an important indicator for measuring the relationship between the economy and carbon emissions. Among the 19 megalopolises, the Chengdu-Chongqing Economic Circle has the best showing in terms of carbon intensity, followed by the middle reaches of the Yangtze River, central Guizhou, coastal areas of Guangdong, Fujian, Zhejiang provinces, the Beibu Gulf, the Pearl River Delta, and the Yangtze River Delta. These seven megalopolises all exceed the national average and are located in southern China.

Carbon intensity of the remaining 12 megalopolises stays below the national average. Among them, the Harbin-Changchun region has the lowest carbon intensity, followed by the areas along the Yellow River in northern Ningxia, the Hohhot-Baotou-Erdos-Yulin region, the central part of Shanxi, the northern slopes of the Tianshan Mountains, the central and southern parts of Liaoning, the Guanzhong Plain, and the Beijing-Tianjin-Hebei region. These eight megalopolises are all in northern China.

Zhou Muzhi pointed out, “Compared to 2000, carbon intensity in China was reduced over 40%, marking a significant achievement. However, there is still a considerable gap China and developed countries. Currently, China’s carbon intensity is 2.8 times that of the U.S. and Japan, 3.6 times that of Germany, 5.5 times that of the U.K., and 6 times that of France. Therefore, achieving a low-carbon development model is a daunting task for every Chinese city.”

6. Northern China still face dire challenges from air pollution


Air quality is one of the most important gauges of environmental quality in a region. Central Yunnan, central Guizhou, the Pearl River Delta, coastal areas of Guangdong, Fujian, and Zhejiang provinces, and the Beibu Gulf take top spots on the Air Quality Index (AQI), with their indicators all above the national average.

Megalopolises at 7th to 20th places are all below the national average, with the Central Plains logging the poorest air quality, followed by the areas along the Yellow River in northern Ningxia, central Shanxi, the Shandong Peninsula, the Lanzhou-Xining region, the northern slopes of the Tianshan Mountains, and the Beijing-Tianjin-Hebei region. Moreover, these seven regions are all located in northern China. Although China’s air quality has improved significantly in recent years, pressures remains severe in northern China.

7. Green designs concentrate in first-tier and quasi-first-tier megalopolises


Green building designs embody environmental awareness and the endeavor toward environmental protection. The evaluation marks for green building designs are most concentrated in the three first-tier megalopolises — the Yangtze River Delta, the Pearl River Delta, and the Beijing-Tianjin-Hebei region — accounting for 39.1%, 15%, and 17.9% of the national total, respectively. The combined share of these three regions is 72%. Among the quasi-first-tier megalopolises, the Chengdu-Chongqing Economic Circle, the middle reaches of the Yangtze River, coastal areas of Guangdong, Fujian, and Zhejiang provinces, and the Guanzhong Plains are home to 4.7%, 4.1%, 4.7%, and 1.1% of the national total, respectively, 14.6% in total.

Huang Weibo pointed out, “In terms of green building designs, the Yangtze River Delta, the Pearl River Delta, and the Beijing-Tianjin-Hebei region contribute 72% to the national total. The figure reflects the active promotion of green industry development in these regions as part of the implementation of major national strategies, as well as their contribution to achieving dual carbon goals.”

Yang Weimin, former deputy director of the Office of the Central Leading Group for Financial and Economic Affairs of China, summarized, “China’s modernization has multiple goals, including achieving sustained economic growth, fundamental improvement in eco-environment, common prosperity for all, national security and social stability, and peak carbon and carbon neutrality. 

He said the Index provides a comprehensive diagnosis of the environment in Chinese cities and megalopolises, and offers an important perspective on observing the environmental conditions during the modernization process. It is evident that an evaluation from an environmental perspective is not the same as from an economic perspective; some indicators are determined by natural conditions, while others are related to how much effort put. Cities and megalopolises need to coordinate multiple goals. That means they should develop their economy while paying attention to the environment.

Compare 19 megalopolises on major environmental rankings of China Integrated City Index 2022


The article was first published on China SCIO, China.org.cn on Jan. 12, 2024 and reprinted by other news websites.

Social functions gravitate to core cities: A look at social rankings of China Integrated City Index 2022

Cloud River Urban Research Institute


Editor’s note:

Why are the major social rankings of the China Integrated City Index 2022 dominated by Chinese core cities? Which megalopolises have entered an aging society? Which megalopolises have the most medical resources in China? Which megalopolises have the most vigorous consumer spending in China? In the social rankings of the China Integrated City Index 2022, Cloud River Urban Research Institute has utilized a series of social data to analyze the demographics and social functions of 19 megalopolises in China.


1. Core cities dominate top 10 social rankings


The top 10 cities in the social rankings of the China Integrated City Index 2022 (hereinafter referred to as Index) are Beijing, Shanghai, Guangzhou, Chengdu, Shenzhen, Nanjing, Hangzhou, Chongqing, Xi’an, and Wuhan, all of which are core cities in a region or in China. Moreover, among the top 22 cities, except Suzhou at 12th, all others are core cities.

Ming Xiaodong, former first-level inspector of the Department of Development Planning of the National Development and Reform Commission and former minister-counsellor of the Chinese Embassy in Japan, commented, “The social rankings of the Index reflect the level of social development of a city. This is the first time I have observed that social development grows in tandem with the economy and population through objective data. Among the top 20 cities, there are 12 in eastern China, four in central China, and four in western China. Among them, there are 14 cities in southern China and six in northern China. Eastern China contributes most to China’s economy, central China comes at second, and western China third. Furthermore, the economy of southern China is better than that of northern China. Similarly, population mostly concentrates in China’s southern part, with a south-north population ratio of 4:3. Therefore, the 2022 social rankings show that China’s social undertakings are highly correlated with its economic development and population. As China’s economy develops in tandem with its society, the distribution of social services becomes more rational and balanced.”

The social rankings consist of three subcategories, namely status and governance, inheritance and communication, and life quality, and includes nine items, namely city status, population quality, social management, historical heritage, cultural and entertainment, communication, living environment, consumption level, and life services, totaling 199 data sets. This article focuses on analyzing social performances of 19 megalopolises.

This article focuses on analyzing the social performance of the 19 megalopolises in 2022. Using box plots and overlaid bee swarm plots, the article presents the distribution and degree of deviation in the social rankings of 223 cities at or above the prefectural level in the 19 megalopolises. Only the Pearl River Delta has its median value above the national average, while the other 18 megalopolises below the national average.

Professor Zhou Muzhi at Cloud River Urban Research Institute pointed out, “This phenomenon indicates a significant concentration of administrative resources, medical services, higher education, communication, culture and entertainment, as well as other social functions in central cities. It leads to a notable dependence of non-core cities on core cities when it comes to social functions, with the gap between non-core cities and core cities widening. This is a phenomenon that deserves attention.”

2. An aged society on the horizon


In 2022, eight megalopolises in China experienced negative population growth, including central and southern parts of Liaoning, the Harbin-Changchun region, the Chengdu-Chongqing region, the Yangtze River Delta, Central Shanxi, the Guanzhong Plains, the northern slopes of the Tianshan Mountains, and Central Plains. Central and southern parts of Liaoning and the Harbin-Changchun region suffered particularly severe declines in population, with their populations shrinking in the 2015-2022 period on an average basis. This indicates that a declining birthrate is a significant issue that should raise concerns in China.

The Pearl River Delta witnesses the highest population growth rate, followed by central Guizhou, the Beibu Bay, coastal areas of Guangdong, Fujian, Zhejiang provinces, the areas along the Yellow River in northern Ningxia, the Central Plains, the Shandong Peninsula, central Yunnan, the Lanzhou-Xining region, and the middle reaches of the Yangtze River. Their average population growth rates over the 2015-2022 period ranged from 10.1‰ to 4.6‰.

Thanks to its highest natural population growth rate nationwide and a large influx of young people, the population aged 65 and above in the Pearl River Delta is 6.5%, the smallest proportion among the 19 megalopolises, followed by the northern slopes of the Tianshan Mountains, the areas along the Yellow River in northern Ningxia, central Yunnan, the Beibu Bay, central Guizhou, the Lanzhou-Xining region, the Hohhot-Baotou-Erdos-Yulin region, and coastal areas of Guangdong, Fujian, Zhejiang provinces.

In the Chengdu-Chongqing region, 17.4% of its population is at 65 or above, the highest among the 19 megalopolises, followed by central and southern parts of Liaoning, the Harbin-Changchun region, the Yangtze River Delta, the Shandong Peninsula, and the Beijing-Tianjin-Hebei region, at 17.3%, 15.3%, 15.3%, 15.1%, and 14.1% respectively. Some of these megalopolises have slipped into negative natural population growth in recent years, some have had a significant dropping out of prime age adults, and the others have faced a more miserable situation, suffering both population declines and outflows of prime age adults.

Professor Zhou pointed out, the U.N. defines an “aging society” as one where people aged 65 or above constitute more than 14% of the total population. Currently, the proportion of old people in China has reached 13.7%, within a whisker of becoming an aging society. 

Zhou said, the six megalopolises, including the Chengdu-Chongqing region, have already been among the first in China to enter an aging society.

3. Over half of China’s working age population clusters in first-tier and quasi-first-tier megalopolises


The first-tier megalopolises – the Yangtze River Delta, the Pearl River Delta, and the Beijing-Tianjin-Hebei region – account for 12.2%, 6.5%, and 6.2% of China’s working age population, respectively, 24.9% in total. The quasi-first-tier megalopolises, such as the Chengdu-Chongqing region, the middle reaches of the Yangtze River, coastal areas of Guangdong, Fujian, Zhejiang provinces, and the Central Plains account for 7.2%, 8.6%, 6.6%, and 2.9% of the working age population, respectively, totaling 25.3%. The three first-tier city megalopolises and the four quasi-first-tier megalopolises combined make up 50.2% of the national total.

The Yangtze River Delta, the Pearl River Delta, and the Beijing-Tianjin-Hebei region account for 13.7%, 5.8%, and 9.4% of students in general higher education institutions, respectively, 28.9% in total. The Chengdu-Chongqing region, the middle reaches of the Yangtze River, coastal areas of Guangdong, Fujian, Zhejiang provinces, and the Guanzhong Plains account for 7.4%, 12.6%, 4.1%, and 3.7% of students in general higher education institutions, respectively, totaling 27.8%. The three first-tier city megalopolises and the four quasi-first-tier megalopolises combined accommodate 56.7% of China’s college students who are considered as the future high-quality workforce.

4. Medical resources highly concentrate


The Yangtze River Delta, the Pearl River Delta, and the Beijing-Tianjin-Hebei region are home to 13.2%, 6.5%, and 9.5% of China’s third-tier hospitals (hospitals are the most sophisticated with multiple differentiated departments in China), totaling 29.2%. The Chengdu-Chongqing region, the middle reaches of the Yangtze River, coastal areas of Guangdong, Fujian, Zhejiang provinces, and the Central Plains account for 7.1%, 10.2%, 5.6%, and 3.3% of China’s third-tier hospitals, totaling 26.2%.

The Yangtze River Delta, the Pearl River Delta, and the Beijing-Tianjin-Hebei region are home to 13.5%, 5.2%, and 8.6% of China’s licensed (assistant) doctors, respectively, 27.3% combined. The Chengdu-Chongqing region, the middle reaches of the Yangtze River, coastal areas of Guangdong, Fujian, Zhejiang provinces, and the Central Plains take 7.5%, 8.6%, 6.0%, and 3.1%, respectively, totaling 25.2%.

The Yangtze River Delta, the Pearl River Delta, and the Beijing-Tianjin-Hebei region occupy 12.7%, 4.3%, and 6.4% of beds in China’s medical and healthcare institutions, respectively, 23.4% combined. The Chengdu-Chongqing region, the middle reaches of the Yangtze River, coastal areas of Guangdong, Fujian, Zhejiang provinces, and the Central Plains make up 8.8%, 9.6%, 5.7%, and 3.4% of the national total, 27.5% combined.

The three first-tier megalopolises and the four quasi-first-tier megalopolises host 55.4% of the nation’s third-tier hospitals, 52.5% of licensed (assistant) doctors, and 50.9% of beds in China’s medical and healthcare institutions. China’s medical resources, especially high-level medical institutions, significantly concentrate in core cities. With premium medical resources, core cities in the first-tier and quasi-first-tier megalopolises not only serve the needs of local residents for health services but also provide high-end medical services for residents in megalopolises and even the entire country.

5. Theaters concentrate in first-tier and quasi-first tier megalopolises


The Yangtze River Delta, the Pearl River Delta, and the Beijing-Tianjin-Hebei region accommodate 19.1%, 9.9%, and 6.6% of China’s theaters, respectively, 35.6% in total. The Chengdu-Chongqing region, the middle reaches of the Yangtze River, coastal areas of Guangdong, Fujian, Zhejiang provinces, and the Central Plains host 8.1%, 9.3%, 6.2%, and 3.0% of the national total, 26.6% combined.

The Yangtze River Delta, the Pearl River Delta, and the Beijing-Tianjin-Hebei region contribute 20.0%, 10.4%, and 7.2% of film attendances in China, respectively, 37.6% combined. The Chengdu-Chongqing region, the middle reaches of the Yangtze River, coastal areas of Guangdong, Fujian, Zhejiang provinces, and the Central Plains take 8.8%, 10.1%, 6.6%, and 2.4% of China’s film attendances, totaling 27.9%.

The three first-tier megalopolises and the four quasi-first-tier megalopolises host 62.2% of China’s theaters, contribute 65.5% of China’s film attendances, and generate 66.5% of China’s box office.

6. Luxury spending soars


The Yangtze River Delta, the Pearl River Delta, and the Beijing-Tianjin-Hebei region are home to 26.8%, 6.8%, and 16.6% of China’s top brand stores such as Hermes and Louis Vuitton, respectively, totaling 50.2%. The Chengdu-Chongqing region, the middle reaches of the Yangtze River, coastal areas of Guangdong, Fujian, Zhejiang provinces, and the Central Plains make up 9.8%, 6.3%, 2.8%, and 4.3% of China’s top brand stores, totaling 23.2%. A total of 73.4% of China’s top brand stores are located in the three first-tier megalopolises and the four quasi-first-tier megalopolises.

The Yangtze River Delta has the highest number of China’s top brand stores, followed by the Beijing-Tianjin-Hebei region. The Chengdu-Chongqing region, the middle reaches of the Yangtze River, central and southern parts of Liaoning, and the Central Plains also have a booming luxury market. Surprisingly, the Pearl River Delta is three percentage points lower than the Chengdu-Chongqing region in terms of the percentage of China’s top brand stores.

Professor Zhou pointed out, “In the past two decades, globalization has led to rapid growth in global wealth and the luxury market. In 2022, the global personal luxury goods market grew three times compared to 2000. In 2019, China’s share in the global personal luxury goods market reached 33%, and will probably reach 40% by 2030.”

7. Narrow gap in social development


Ming Xiaodong said, “The 19 megalopolises are the main drivers of China’s economic growth, hosting over 80% of China’s labor force, healthcare resources, and over 90% of college students and cultural facilities.”

Ming noted that the top 5 megalopolises in the social rankings are all first-tier and quasi-first-tier megalopolises, and among them, the Yangtze River Delta, the Pearl River Delta, and the Beijing-Tianjin-Hebei region accommodate nearly a quarter of the nation’s labor force and nearly 30% of college students, making them the most dynamic and innovative region in China. 

“The middle reaches of the Yangtze River are home to 12.6% of college students, 10.2% of third-tier hospitals, and 9.3% of cultural facilities in China, second only to the Yangtze River Delta,” Ming said, “The middle reaches of the Yangtze River are a megalopolis where education, healthcare, and cultural resources cluster, indicating that with strong development potential, quasi-first-tier megalopolises in China have surpassed some first-tier megalopolises in some areas.”

Yang Weimin, former deputy director of the Office of the Central Leading Group for Financial and Economic Affairs of China, concluded, “The social rankings of the Index provide a comprehensive evaluation of social development of Chinese cities and megalopolises and indicate that social development is the result of economic development, but it is also influenced by human, historical, regional, and ethnic factors, among others.”

Yang said, social and economic development is not always linear, adding that China’s development is people-centered, as its economic development ultimately aims to improve people’s living standards.

Yang said, “The evaluation of the social rankings to some extent reflects the living conditions and consumption potential of megalopolises. The fact that 75% of top brand stores cluster in first-tier and quasi-first-tier megalopolises indicates that middle and high-income groups with strong purchasing power are concentrated in these megalopolises.”

“The movie attendance in first-tier and quasi-first-tier megalopolises accounts for two-thirds of the national total, indicating that residents in these megalopolises earn more and crave more cultural activities.”

Yang explained that this reflects the significant disparities in social development among Chinese megalopolises. “These disparities provide potential for China as a super-large economy. China not only needs to narrow the economic gap between regions and cities but also needs to narrow the gap in social development,” he asserted.


The article was first published on China Daily, China.org.cn on Jan. 22, 2024 and reprinted by other news websites.

Dynamics of strongest Chinese megalopolises: Economic rankings of China Integrated City Index 2022

Cloud River Urban Research Institute


Editor’s note:

Why do we say affluent Chinese cities are as rich as some countries? Why do we consider megalopolises as the main form to promote urbanization? In the major economic rankings of China Integrated City Index 2022, Cloud River Urban Research Institute utilizes a series of economic data to look into the dynamics of the 10 wealthiest cities and first-tier and quasi-first-tier megalopolises in China.


Top 10 cities on major economic rankings


According to the major economic rankings of China Integrated City Index 2022 (hereinafter referred to as the Index), the top 10 cities are Shanghai, Beijing, Shenzhen, Guangzhou, Chengdu, Suzhou, Hangzhou, Chongqing, Tianjin, and Nanjing. Compared to 2021 rankings, Chengdu moves from 6th to 5th, Suzhou drops from 5th to 6th, Hangzhou advances from 8th to 7th, and Chongqing declines from 7th to 8th.

Ming Xiaodong, former first-level inspector of the Department of Development Planning of the National Development and Reform Commission and former minister-counsellor of the Chinese Embassy in Japan, said the top 20 cities on the rankings include all first-tier cities, quasi-first-tier cities, and seven second-tier cities. 

He noted the rankings are based on nine sub-indicators including economic aggregate, economic structure, economic efficiency, business environment, openness, innovation and entrepreneurship, urban-rural integration, broad hub, and leading power, involving 227 sets of data. 

He said the rankings fully illustrate that first-tier cities are the main growth engines of China’s economy, while quasi-first-tier cities and some second-tier cities are the new driving forces of China’s economic development.

Professor Zhou Muzhi, head of Cloud River Urban Research Institute, pointed out that as the main growth engines and new sources of China’s economic development, these cities can be as wealthy as some nations. 

He said GDP of some cities among the top 10 is approaching or even outstripping that of the countries ranked from 20th to 47th globally, and that the total economy of these top 10 cities accounts for 22.6% of China’s GDP and 4.7% of the world’s GDP, exceeds Germany’s GDP (ranked 4th), and approaches Japan’s GDP (ranked 3rd).

According to the comprehensive deviation values, the Index classifies the 297 cities at the prefecture level and above into first-tier, quasi-first-tier, second-tier, and third-tier cities. Further, it defines 19 megalopolises as first-tier, quasi-first-tier, second-tier, and third-tier megalopolises based on the hierarchical level of leading regional core cities. This article focuses on the analysis of the economic performance of first-tier and quasi-first-tier megalopolises in 2022.

Top 100 cities on major economic rankings of China Integrated City Index 2022

Three major megalopolises lead China’s socioeconomic development


Led by the four first-tier cities — Beijing, Shanghai, Shenzhen, and Guangzhou, the Yangtze River Delta, the Pearl River Delta, and the Beijing-Tianjin-Hebei region are the three major megalopolises driving the socioeconomic development of China.

In 2022, the Yangtze River Delta accounted for 20% of China’s GDP, the Pearl River Delta 8.6%, and the Beijing-Tianjin-Hebei region 7.5%. These three major megalopolises collectively generated 36.2% of the country’s GDP. In 2022, the Yangtze River Delta, the Pearl River Delta, and the Beijing-Tianjin-Hebei region posted a nominal GDP growth rate of 5.1%, 4.1%, and 4.4% year on year, respectively, with the Yangtze River Delta growing fastest.

In 2022, the Yangtze River Delta made up 11.8% of the national population, the Pearl River Delta 5.5%, and the Beijing-Tianjin-Hebei region 6.2%. These three major regions concentrated 23.5% of permanent residents in the country. In 2022, the population with permanent residency in the Yangtze River Delta grew by 0.4% year on year, while the Pearl River Delta and the Beijing-Tianjin-Hebei region decreased by 0.4% and 0.3% year on year, respectively. Such decreases were related to the reduction in the number of permanent residents without local household registrations during the COVID-19 epidemic.

In 2022, the Yangtze River Delta accounted for 35.4% of China’s exports, the Pearl River Delta 21.3%, and the Beijing-Tianjin-Hebei region 5.2%. These three major regions combined accounted for 61.9% of the national exports, with the Yangtze River Delta and the Pearl River Delta serving as the primary engines of China’s export industry. In 2022, the export volume in the Yangtze River Delta and the Pearl River Delta increased by 10% and 5.9% year on year, while the Beijing-Tianjin-Hebei region experienced a 0.3% decline.

In 2022, the Yangtze River Delta contributed 35.4% of the country’s container throughput, the Pearl River Delta 22.6%, and the Beijing-Tianjin-Hebei region 8.8%. These three major regions accounted for 66.8% of the national container throughput.

The vitality of the three major megalopolises comes from their enterprises. In 2022, the Yangtze River Delta accounted for 33.3% of the companies listed on the four major stock exchanges in Shanghai, Shenzhen, Hong Kong, and Beijing, the Pearl River Delta 14.2%, and the Beijing-Tianjin-Hebei region 13.9%. These three regions were home to 61.4% of the companies listed on the main boards in China.

Particularly noteworthy is the concentration of IT enterprises in the three major megalopolises. In 2022, the Yangtze River Delta accounted for 27.4% of the IT companies listed on the four major stock exchanges, the Pearl River Delta 19%, and the Beijing-Tianjin-Hebei region 30.3%. These three regions hosted 76.7% of such companies in China, with the Beijing-Tianjin-Hebei region and the Yangtze River Delta taking the largest shares.

The three major megalopolises have fared well in innovation and entrepreneurship. In 2022, the Yangtze River Delta made up 27.8% of granted patents nationally, the Pearl River Delta 17.9%, and the Beijing-Tianjin-Hebei region 8.6%. These three major regions contributed 54.3% of the national granted patents.

In 2022, the Yangtze River Delta were home to 13.9% of the companies listed on the ChiNext board in Shenzhen and the Growth Enterprise Market in Hong Kong, the Pearl River Delta 37%, and the Beijing-Tianjin-Hebei region 19.9%. These three regions represented 70.8% of such companies.

In 2022, the Yangtze River Delta hosted 29.6% of the companies traded on the National Equities Exchange and Quotations (NEEQ) board, also known as the “new third board”, the Pearl River Delta 29.6%, and the Beijing-Tianjin-Hebei region 17.3%. These three major megalopolises concentrated 60.3% of the NEEQ-listed companies.

In 2022, the Yangtze River Delta accounted for 40.6% of unicorn companies in China, the Pearl River Delta 40.6%, and the Beijing-Tianjin-Hebei region 26.5%. These three regions accounted for 86.3% of the country’s unicorn companies.

Zhou Muzhi pointed out, the total GDP of the three megalopolises is 1.5 times that of Japan, their population with permanent residency is 2.7 times that of Japan, their export volume is 2.9 times that of Japan, and their port container throughput 8.8 times that of Japan. He said these figures highlight the position of the three regions in the current world’s economic landscape.

Comparison of 19 megalopolises on major economic rankings of China Integrated City Index 2022

Quasi-first-tier megalopolises race ahead


The Chengdu-Chongqing Economic Circle, the middle reaches of the Yangtze River, coastal areas of Guangdong, Fujian, Zhejiang provinces, and the Guanzhong Plain are all driven by quasi-first-tier regional center cities and have served as the pillar of China’s socioeconomic development. 

In 2022, the Chengdu-Chongqing Economic Circle contributed 6.6% of China’s GDP, the middle reaches of the Yangtze River 9.2%, coastal areas of Guangdong, Fujian, Zhejiang provinces 6.9%, and the Guanzhong Plain 2.2%. These four regions collectively made up 24.9% of the country’s GDP. In the same year, the nominal GDP growth rates for the Chengdu-Chongqing Economic Circle, the middle reaches of the Yangtze River 9.2%, coastal areas of Guangdong, Fujian, Zhejiang provinces, and the Guanzhong Plain were 5%, 7.2%, 7.8%, and 8.9%, respectively, with the Guanzhong Plain experiencing the fastest growth.

In 2022, the Chengdu-Chongqing Economic Circle contributed 7.4% of China’s population, the middle reaches of the Yangtze River 8.8%, coastal areas of Guangdong, Fujian, Zhejiang provinces 6.7%, and the Guanzhong Plain 2.9%. These four regions concentrated 25.8% of the country’s permanent residents. In 2022, the number of permanent residents in the Chengdu-Chongqing Economic Circle grew by 0.9%, the middle reaches of the Yangtze River and coastal areas of Guangdong, Fujian, Zhejiang both grew by 0.1%, while the Guanzhong Plain logged a 0.6% decline.

In 2022, the Chengdu-Chongqing Economic Circle accounted for 4.7% of China’s exports, the middle reaches of the Yangtze River 5%, coastal areas of Guangdong, Fujian, Zhejiang provinces 7.5%, and the Guanzhong Plain 1.3%. These four regions contributed 18.5% of China’s exports, with coastal areas of Guangdong, Fujian, Zhejiang provinces surpassing the Beijing-Tianjin-Hebei region in share. In 2022, exports of the Chengdu-Chongqing Economic Circle grew by 5.1% year on year, the middle reaches of the Yangtze River saw a 26.4% year-on-year growth rate, and coastal areas of Guangdong, Fujian, Zhejiang provinces and the Guanzhong Plain grew by 15% and 16.4% year on year, respectively.

Thanks to inland waterway shipping, the Chengdu-Chongqing Economic Circle and the middle reaches of the Yangtze River represented 0.5% and 1.8% of China’s container throughput, respectively. Home to many seaports, coastal areas of Guangdong, Fujian, Zhejiang provinces made up 7.2% of China’s container throughput. The four regions accounted for 9.5% of China’s container throughput.

In 2022, the Chengdu-Chongqing Economic Circle hosted 4.9% of the companies listed on the four major stock exchanges, the middle reaches of the Yangtze River 5.5%, coastal areas of Guangdong, Fujian, Zhejiang provinces 6.1%, and the Guanzhong Plain 1.4%. These four regions were home to 17.9% of the country’s mainboard-listed companies.

In 2022, the Chengdu-Chongqing Economic Circle hosted 2.6% of IT companies listed on the four major stock exchanges, the middle reaches of the Yangtze River 3.6%, coastal areas of Guangdong, Fujian, Zhejiang provinces 6.2%, and the Guanzhong Plain 0.7%. These four regions’ mainboard-listed IT companies accounted for 13.1% of the national total, with coastal areas of Guangdong, Fujian, Zhejiang provinces taking the largest shares.

In terms of innovation and entrepreneurship, in 2022, the Chengdu-Chongqing Economic Circle took 4.6% of the grated patents in China, the middle reaches of the Yangtze River 6.8%, coastal areas of Guangdong, Fujian, Zhejiang provinces 6.9%, and the Guanzhong Plain 1.8%. These four regions took 20.1% of the granted patents in China.

in 2022, the Chengdu-Chongqing Economic Circle accommodated 3.9% of the companies listed on the ChiNext board in Shenzhen and the Growth Enterprise Market in Hong Kong, the middle reaches of the Yangtze River 6.2%, coastal areas of Guangdong, Fujian, Zhejiang provinces 5.3%, and the Guanzhong Plain 1.6%. These four megalopolises represented 17% of such companies.

In 2022, the Chengdu-Chongqing Economic Circle represented 3.9% of companies listed on the NEEQ, the Middle Reaches of the Yangtze River 6.3%, coastal areas of Guangdong, Fujian, Zhejiang provinces 6%, and the Guanzhong Plain 1.9%. A total of 18.1% of the NEEQ-listed companies were concentrated in these four megalopolises.

In 2022, the Chengdu-Chongqing Economic Circle hosted 3.8% of China’s unicorn companies, the middle reaches of the Yangtze River 3.8%, coastal areas of Guangdong, Fujian, Zhejiang provinces 1.6%, and the Guanzhong Plain 0.3%. These four regions accounted for 9.5% of China’s unicorn companies.

Continue to develop megalopolis as main form to advance urbanization


Ming Xiaodong pointed out, the Index is based on large amounts of wide-ranging, authoritative, and accurate data. For the first time, it scientifically categorizes 297 cities at or above the prefecture level and 19 megalopolises in China. The classifications are largely consistent with public perception. This provides the first standard for the comprehensive classification of cities and megalopolises in China and reflects China’s economy. The categorization criteria of megalopolises have enriched understanding of them. First-tier megalopolises accommodate one-third of China’s GDP, and nearly one-fourth of its population, and also gather a large number of listed companies and innovative enterprises. Therefore, first-tier megalopolises are not only areas concentrating population and economy in China, but also major hubs for trade and important sources of innovation. Similarly, quasi-first-tier megalopolises provide crucial support for the development of first-tier megalopolises as important economic centers.”

Du Ping, executive vice director of the State Information Center of China, commented that the Index offers a professional insight into the development of major Chinese cities and its concise and clear charts vividly reveal the performances and rankings of Chinese cities in 2022. 

He said, particularly noteworthy is the seven consecutive years of publication, which provides cities with valuable and sequential data for each year. The continuity and objectivity of the Index are instrumental in assessing and comparing cities.

Yang Weimin, former deputy director of the Office of the Central Leading Group for Financial and Economic Affairs of China, noted that the Index distinguishes between first-tier, second-tier, quasi-second-tier, and third-tier cities, and also assesses the development of major megalopolises in China. 

He said the major economic rankings show that the Yangtze River Delta, the Pearl River Delta, and the Beijing-Tianjin-Hebei region have maintained their development momentum, while the Chengdu-Chongqing Economic Circle, the middle reaches of the Yangtze River, coastal areas of Guangdong, Fujian, and Zhejiang, and the Guanzhong Plain have been catching up rapidly. The seven megalopolises concentrate over 60% of China’s economy and nearly 50% of its population and such a trend will continue. 

He added that this fully proves that taking megalopolises as the main form to promote urbanization, which was set forth in the 11th Five-Year Plan (2006-10), conforms with the laws of development and is far-sighted. Departments at all levels across China should follow the laws of urbanization and continue to take megalopolises as the main form to promote urbanization.


The article was first published on China Daily, China.org.cn on Dec. 29, 2023 and reprinted by other news websites.

China Integrated City Index 2022: Core cities lead development of megalopolises

Cloud River Urban Research Institute


Editor’s note:

In China, which city and which megalopolis is most developed? In the recently released China Integrated City Index 2022, Cloud River Urban Research Institute utilizes the comprehensive ranking deviation values to quantitatively define first-tier cities, quasi first-tier cities, second-tier cities, and third-tier cities and conducts a comprehensive evaluation of 19 megalopolises.


Beijing secured the top spot for the seventh consecutive year on the comprehensive ranking of the China Integrated City Index 2022, followed by Shanghai in second place and Shenzhen in third.

Zhao Qizheng, former minister of the State Council Information Office, said, “In 2022, the international climate was complex and volatile and the COVID-19 pandemic repeatedly surged. Despite these challenges, China’s economy achieved stable growth. The China Integrated City Index 2022 puts China’s urban development in the global perspective.”

Ming Xiaodong, former first-level inspector of the Department of Development Planning of the National Development and Reform Commission and former minister-counsellor of the Chinese Embassy in Japan, said, “The year 2022 was an extraordinary year for China, as the Chinese economy achieved stable growth, bucking the adverse effects of the international environment and the COVID-19 pandemic.”

“The China Integrated City Index 2022 profoundly reveals the economic growth trend and the comprehensive development of Chinese cities in 2022. Beijing, Shanghai, Shenzhen, Guangzhou, Chengdu, Hangzhou, Chongqing, Nanjing, and Suzhou maintain their rankings in the top nine, compared to the previous year. This indicates that the growth engine and driving force of the Chinese economy have not changed.”

“These cities, as the backbone of China’s economic growth, maintained sustained economic and social development despite pressures brought by the repeating outbreaks of the pandemic and disrupted supply chains in 2022. Driven by good showings of these cities, China’s economy hit new highs, surpassing the 120 trillion-yuan threshold. Among the top 10 in the comprehensive ranking, only Wuhan, in 10th place, is a newcomer. This demonstrates that Wuhan has overcome the impact of the pandemic and has made its way into the top 10.”

Top 100 cities on comprehensive ranking of China Integrated City Index 2022

1. Who are first-tier, quasi first-tier, and second-tier Chinese cities?


Opinions vary about which cities are considered first-tier and second-tier. There even emerged new first-tier cities in China. However, there is not any clear definition of the hierarchical classification of Chinese cities. Yang Weimin, former deputy director of the Office of the Central Leading Group for Financial and Economic Affairs of China, explained that there is not yet a strict criterion for classifying cities and it is some people who classify cities according to their housing prices.

Given this situation, the China Integrated City Index 2022 (hereinafter referred to as the Index) puts cities across the country into different tiers, comprising 878 data sets based on a comprehensive evaluation of 297 cities at the prefectural level and above in terms of environmental, social, and economic dimensions.

The Index uses the concept of “deviation value” in the evaluation method to look into each city’s position relative to other cities nationwide on each indicator. It converts different units used in different indicators into a unified scale for comparison. The total comprehensive evaluation deviation value consisting of the deviation values of three major categories – the environment, society, and the economy – is 300, with a national average of 150. 

According to the Index, cities with a deviation value above 200 are defined as first-tier cities; cities with a deviation value of 175-200 are defined as quasi first-tier cities; cities with a deviation value of 150-175 are defined as second-tier cities; and cities with a deviation value below 150 are defined as third-tier cities.

According to this criterion, Beijing, Shanghai, Shenzhen, and Guangzhou are first-tier cities, among which Beijing and Shanghai stand out with much higher deviation values.

Quasi first-tier cities include nine cities, namely Chengdu, Hangzhou, Chongqing, Nanjing, Suzhou, Wuhan, Tianjin, Xiamen, and Xi’an. Given that urban development is dynamic, these quasi first-tier cities are the most likely to become first-tier cities in the future.

Second-tier cities include 43 cities, led by 21 core cities. Among them, the deviation values of cities like Ningbo, Changsha, Qingdao, Dongguan, and Fuzhou approach 175 and are expected to enter the echelon of quasi first-tier cities in the near future.

There are a total of 241 third-tier cities with comprehensive evaluation deviation values below the national average. Particularly noteworthy is that three provincial capitals, namely Hohhot, Yinchuan, and Xining, are among them.

Zhao Qizheng argued that using the comprehensive ranking deviation value to quantitatively define first-tier cities, quasi first-tier cities, second-tier cities, and third-tier cities clarifies the classification standards of these four types of cities and avoids the difficulty of comparing different opinions.

2. Three major megalopolises serve as biggest driving force of China’s economy


Megalopolises are the primary form of China’s new type of urbanization. According to the 14th Five-Year Plan (2021-25), 19 megalopolises have been planned nationwide. The plan aims to upgrade megalopolises such as the Beijing-Tianjin-Hebei region, the Yangtze River Delta, the Pearl River Delta, the Chengdu-Chongqing Economic Circle, and the middle reaches of the Yangtze River, develop megalopolises including the Shandong Peninsula, coastal areas of Guangdong, Fujian, and Zhejiang provinces, the Central Plains, the Guanzhong Plain, and the Beibu Gulf, and foster megalopolises like Harbin-Changchun, Central and Southern Liaoning, Central Shanxi, Central Guizhou, Central Yunnan, Huhhot-Baotou-Ordos-Yulin, Lanzhou-Xining, Ningxia along the Yellow River, and the north slope of Tianshan Mountains. These 19 megalopolises encompass 35 national or regional core cities, which contribute 88% of China’s GDP and housing 81.9% of China’s permanent population.

Evaluating the development of megalopolises is of great significance. Compared to the China Integrated City Index 2021 which evaluated the top 10 megalopolises, the 2022 edition expands the evaluation to include all 19 megalopoliseses.

To provide a clear analysis of the development levels of each megalopolis, this article presents box plots and beeswarm plots of the comprehensive evaluation deviation values of 223 cities covered by the 19 megalopolises, categorized by the type of megalopolises. This clearly shows the distribution and degree of differences in the comprehensive evaluation deviation values of cities within each megalopolis

The horizontal line inside the box of a box plot represents the median of the sample, the top of the box represents the upper quartile (75%), the bottom of the box represents the lower quartile (25%), and the box indicates the distribution of 50% of the sample. The beeswarm plot is a statistical chart that illustrates the distribution of individual data points, and mapping a beeswarm on top of a box plot can simultaneously show the position of each sample and the overall distribution of the sample.

Ming Xiaodong said, “Looking at the box beeswarm plot of the comprehensive rankings of the 19 megalopolises, the polarization effect of core cities in the megalopolises is evident. The more developed the region, the higher the ranking of the regional core cities.”

Indeed, core cities are the center of large megalopolises. Analysis of the boxswarm plot shows that the four first-tier cities are concentrated in the Yangtze River Delta, the Pearl River Delta, and the Beijing-Tianjin-Hebei region. These three major megalopolises can be referred to as “first-tier megalopolises.” The three major megalopolises contribute 36.2% of China’s GDP and account for 23.5% of China’s permanent population. The per capita GDP in these three major megalopolises is 1.54 times the national average. These megalopolises have attracted a large inflow of people, with a permanent population without local household registrations reaching 78.02 million. Undoubtedly, the three major megalopolises are the most significant engines leading China’s economic and social development.

Comparative analysis of 19 megalopolises in China Integrated City Index 2022

3. Who are China’s quasi first-tier, second-tier, and third-tier megalopolises?


Megalopolises led by quasi first-tier regional core cities include the Chengdu-Chongqing Economic Circle, the middle reaches of the Yangtze River, coastal areas of Guangdong, Fujian, and Zhejiang provinces, and the Guanzhong Plain, which can be referred to as “quasi first-tier megalopolises.”

These four quasi first-tier megalopolises contribute 24.9% of China’s GDP and make up 25.7% of the permanent population. This means these megalopolises sustain a quarter of China’s economy and population. However, due to the fact that the per capita GDP of these four quasi first-tier megalopolises is only 97% of the national average, they suffer from population outflows totaling 18.01 million people. It’s worth noting that the Guanzhong Plain megalopolis is a single-engine megalopolis with Xi’an serving as the only regional core city.

Megalopolises led by second-tier regional core cities are the Shandong Peninsula, the Beibu Gulf, the Central Plains, Harbin-Changchun, Central and Southern Liaoning, Central Shanxi, Central Guizhou, Central Yunnan, Huhhot-Baotou-Ordos-Yulin, Lanzhou-Xining, Ningxia along the Yellow River, and the north slope of Tianshan Mountains, which can be referred to as “second-tier megalopolises.”

These 10 second-tier megalopolises contribute 24.8% of China’s GDP and account for 31.4% of China’s permanent population. This means they support a quarter of China’s economy and a third of China’s population. Among them, five megalopolises, namely Central and Southern Liaoning, Central Shanxi, Central Guizhou, Lanzhou-Xining, and the north slope of Tianshan Mountains, have absorbed a total of 6.66 million permanent residents without local household registrations. The Shandong Peninsula, the Beibu Gulf, Central Plains, Harbin-Changchun, and Central Guizhou collectively have seen an outflow of 37.15 million people. In the second-tier megalopolises, Central Plains, Central Shanxi, Central Guizhou, Central Yunnan, and the north slope of Tianshan Mountains are all single-engine megalopolises with only one regional core city.

Huhhot-Baotou-Ordos-Yulin and Ningxia along the Yellow River are two megalopolises led by only third-tier regional center cities, and they can be referred to as “third-tier megalopolises.” Although these two third-tier megalopolises are smaller in volume and scale, with GDP and permanent population accounting for only 2% and 1.3% of the national total, respectively, their per capita GDP is close to levels of the three major megalopolises and 1.53 times the national average. They have collectively attracted a mobile population of 2.31 million. Both of these third-tier megalopolises are single-engine megalopolises with only one regional center city.

Professor Zhou Muzhi, head of Cloud River Urban Research Institute, said, “Using the comprehensive deviation value to quantitatively classify cities and further analyze the development of megalopolises is a new attempt in the Index.”

He said he hopes it can help objectively understand the positions and shortcomings of Chinese cities and megalopolises.

Zhao Qizheng lauded comprehensively classifying megalopolises as an innovative attempt.

Ming Xiaodong noted, “We were surprised and happy to find that the Index was released earlier than previous years. It is no longer an index based on the development of Chinese city two years before. Instead, it is review of the previous year’s comprehensive development of Chinese cities.”

“Especially, the application of the Index continues to expand, covering the economy, society, the environment, and other fields. It goes from comprehensive city comparisons to megalopolis comprehensive comparative analysis, from international top brand consumption comparison to carbon dioxide emission analysis, and from industrial structure comparison to global sci-tech cluster comparative analysis.”

“We have reason to believe that as long as brought into good use, the Index has unlimited potential applications.”

Zhao Qizheng emphasized, “The 2021 edition has further leveraged the characteristics of comparative research, not only comparing cities at the same level but also making comparisons of megalopolises. This has provided inspirations for those emerging megalopolises devising plans.”

Yang Weimin summarized, “China’s economy has resilience as a strong economy and such resilience is shown through in its rapidly growing super-large and extra-large cities. Cloud River Urban Research Institute’s China Integrated City Index 2022 proves this resilience.”

“What’s more creative is that the Index for the first time used statistical methods to quantify 878 sets of indicators into a unified dimension – deviation value. It used deviation values to classify first-tier, second-tier, quasi second-tier, and third-tier cities, solving the problem of how to classify first-tier cities, second-tier cities, and third-tier cities in a scientific way.”

“This method is very meaningful. The Index is a ‘health checkup’ for China’s urban development and Chinese cities and megalopolises.”


The article was first published on China SCIO, China.org.cn on Dec. 5, 2023 and reprinted by other news websites.

Will construction industry transform?

Zhou Muzhi
Professor at Tokyo Keizai University


Editor’s note:

What factors contributed to the growing globalization? Why did megalopolises emerge out of a sudden in China? What put the development of the electric vehicle industry on a fast track? In October, Professor Zhou Muzhi from Tokyo Keizai University delivered a speech at the 2023 Changsha International Green Intelligent Construction and Building Industrialization Expo & World Construction Conference held in Changsha. He used the concept of the Moore’s Law Drive to explain the underlying logic of these questions and provided insights into the prospects of the construction industry.


1.  Era driven by Moore’s Law

As a graduate of Hunan University, I am delighted to attend the conference co-hosted by my alma mater today.

I majored in automation at Hunan University. I study economics now, but fundamentally I study IT. In the early 1980s, when I was a student at Hunan University, one book that inspired me was “The Third Wave,” which predicted many scenarios of the information society. Forty years later, most of those predictions became reality.

Self-proclaimed futurist Alvin Toffler’s accurate prediction was backed by Moore’s Law. Coined in 1965, Moore’s Law posited that the number of transistors on a semiconductor could double every 18 months, and the price of semiconductors could halve. Since then, human society has evolved at an unprecedented pace under the influence of Moore’s Law.

The continuous evolution of semiconductors has given rise to numerous products and services. From hardware like computers and phones to network services like email, web pages, search engines, social media platforms like Facebook, WeChat, and Twitter, streaming services like YouTube, Netflix, and TikTok, online shopping platforms like iTunes, Amazon, Taobao, SHEIN, digital currencies like Bitcoin, AI applications like ChatGPT and autonomous driving, all these were products and services that didn’t exist in the past. It’s worth noting that most of the companies creating these products and services are tech startups, and it is these emerging enterprises that are leading global revolutionary development. I define this stage of human development as the “era driven by Moore’s Law.”

2. Three hypotheses of new industrialization and strategies for megalopolis development

Thirty-five years ago, when I studied economics in Japan, my research focused on how to explain the new industrialization in Asia. Many countries had gained independence after World War II, but no third-world country had achieved industrialization after several decades. It wasn’t until the 1980s that the Four Asian Tigers suddenly surged. At that time, economists worldwide were trying to explain this phenomenon from the perspectives of systems and culture, but they couldn’t provide a clear explanation.

However, looking at this phenomenon from my own background in engineering, I believed that this was an exemplar of the influence of Moore’s Law on the industrialization process. Therefore, in my doctoral thesis, I explained the industrialization in East Asia, including China, through three hypotheses.

The first hypothesis is that Moore’s Law was applied to industrial equipment, with a lot of industrial technology and knowledge integrated into the machinery, opening up new paths for industrialization. After I graduated from university, I participated in the construction of the second phase of Baosteel and bore witness to how advanced equipment imports could lead to a leap in the steel industry’s capabilities. In my doctoral thesis, I coined the term “mechatronics,” combining the words “mechanical” and “electronics,” and added the word “revolution” to emphasize its importance. The title of my doctoral thesis was “The Mechatronics Revolution and New International Division of Labor – Asian Industrialization in the Modern World Economy.”

The second hypothesis is the uniqueness of the electronics industry as the first Moore’s Law-driven industry. The electronics industry was quite weak before the advent of semiconductors, but by the 1980s, it had become the fastest-growing and the largest industry in the world. I also discovered that the electronics industry has the highest level of trade. It was the expansion of the electronics industry supply chain that facilitated the industrialization of the Four Asian Tigers and other East Asian countries.

The third hypothesis is that with the penetration of semiconductors, there will be an increasing number of industries with a rising relevance to Moore’s Law, transforming into high-trade-rate global supply chain industries, much like the electronics industry. Today, when we analyze the correlation between Moore’s Law and global exports in goods, we can see a “perfect correlation” between the two. In other words, as the cost-effectiveness of semiconductors continues to improve, more and more industries are being driven by Moore’s Law, leading to a continuous acceleration of global trade volume. We can observe that 70% of today’s global trade has been generated since 2000, and this is the underlying logic of globalization.

Based on the three hypotheses mentioned above, in 2001, I made a prediction that the Pearl River Delta, the Yangtze River Delta, and the Beijing-Tianjin-Hebei region would become three large industrial clusters that serve global supply chains. These clusters would develop into the three major megalopolises driving China’s economic and social development. In 2001, at the China Urbanization Forum jointly organized by the National Development and Reform Commission, the Japan International Cooperation Agency, China Daily, and the China Association of Mayors, scholars suggested that China should embrace the development of big megalopolises. It marked a significant breakthrough during an era when the focus was primarily on small towns and grand strategies for urbanization.

Since 2001, China’s urban population has doubled, its actual built-up area has increased by three fold, and its GDP has grown eleven times. As a significant number of people have moved to the Pearl River Delta, the Yangtze River Delta, and the Beijing-Tianjin-Hebei region, megalopolises have already been created in China.

3. Three evolutions of electric vehicles

In 2009, I wrote an article for Xinhua News Agency’s Global magazine titled “Japan: The Collapse of the Electronic Kingdom?” In that article, I predicted the impending collapse of Japan’s booming electronic industry at the time. Today, we can see that industries like semiconductors, home appliances, personal computers, mobile phones, LCDs, and solar cells, which used to be Japan’s leading industries, have declined and even disappeared in the country.

In 2010, I wrote another article for the Global magazine titled “Toyota’s Real Crisis,” predicted that Toyota, which had reached its peak under the old industrial environment and production model, would face challenges from emerging electric vehicle manufacturers like Tesla and BYD. My prediction has become a reality 13 years later today.

What is the current status of electric vehicles? In the first half of 2023, among the top 20 best-selling electric vehicle models globally, 13 were from Chinese companies, accounting for 57% of total sales. Among the top 20 electric vehicle manufacturers with the highest sales worldwide, China had 8 companies, making up 49% of total sales. Electric vehicles have completely transformed the landscape of the automotive industry, and this year, China has become the world’s largest exporter of automobiles.

In terms of market value, the most eye-catching electric vehicle makers are Tesla and BYD. Tesla locates its flagship factory in China and BYD is a Chinese automaker. Tesla is the world’s most valuable automaker and BYD is the third, the two accounting for 41% of the market value of 62 large automakers.

Electric vehicles have triggered three major revolutions. The first is the energy revolution, which not only replaced traditional combustion engines but also allowed for the seamless integration of renewable energy with vehicles. The second is the AI revolution, with some estimating that the market value of Tesla’s autonomous driving technology alone could exceed $10 trillion in the future. The third is the manufacturing revolution. Traditional internal combustion engine vehicles have approximately 30,000 components, and electric vehicles eliminated about a third of them by doing away with the engine. Tesla then further reduced the remaining components by over half. This represents a profound revolution in the automotive manufacturing process.

4. Led by tech start-ups

All of this is because Moore’s Law has extended into the automotive field. So, can Moore’s Law extend into the construction industry? That depends on whether the construction industry can give rise to powerful technology and innovation-driven enterprises. As mentioned earlier, it’s the tech startups that are leading the Moore’s Law-driven era today, and the key constitutes in the combination of technology and entrepreneurship. Both Tesla and BYD, two companies revolutionizing the automotive industry, are tech startups.

In 1989, when Japan’s economy was on the crest of a wave, there were seven Japanese companies among the global top 10 by market capitalization, but there was no sci-tech company. The most technologically advanced company on the list was IBM, founded in 1911 and nearly 100 years old back then. Now, looking at today’s global top 10 companies by market capitalization — Apple, Microsoft, Google, Amazon, NVIDIA, Tesla, Facebook, TSMC — eight of them are innovation-driven companies. Among them, the oldest is Microsoft, founded in 1975, and the youngest is Facebook, established in 2004.

The rules for companies’ arena have changed, as tech start-ups have ushered in a new era.

5. Three fundamental problems facing construction industry

So, what challenges does the construction industry face today? I believe there are three fundamental problems that need to be addressed. The first is high energy consumption in buildings, the second is short building lifespans, and the third is low efficiency and high costs in the construction process. One of the reasons for the high costs is the low level of industrialization.

Prior to the COVID-19 pandemic, China’s three-year concrete consumption was 1.5 times that in the U.S. over the past 100 years. In 2017, China’s annual cement production was1.4 times that of all other countries combined in the world. China’s construction industry has been a global leader in terms of scale.

Because of short lifespans, there are a lot of buildings and also a lot of demolitions. In 2020, China generated an astonishing 3 billion metric tons of construction waste, equivalent to 30% to 40% of the total urban waste in the country. Moreover, the resource utilization rate of construction waste in China is very low, at only 5%.

The experience of Tokyo points to another issue. In 2010, among carbon dioxide emissions in Tokyo, 53% came from buildings, 33.7% from the transportation sector, and 10.9% from the industrial sector. Tokyo is a poster child for energy efficiency and emissions reduction. By 2021, after a decade of efforts, the proportion of carbon emissions from the transportation sector and the industrial sector had been reduced to 16.5% and 7.2%, respectively. In contrast, the proportion of emissions from buildings had risen to 73%. Buildings, as major energy consumers, have seen slow progress in energy efficiency and emissions reduction.

6. Construction industry set to transform into a Moore’s Law-driven industry

At present, there are 98 large-scale listed construction companies globally, but their share in the total market capitalization of global companies listed on main boards is only 0.7%. In the market capitalization of these 98 construction companies, Chinese enterprises account for only 13%, ranking behind the U.S. at 30% and France at 15%. This is a peculiar phenomenon: China is the world’s largest construction market, yet it has not created any top construction companies. In Japan, surprisingly, there are no construction companies among the country’s top 50 companies by market capitalization.

The figures above illustrate that the construction industry, one of the largest industries globally, has lost its luster in the capital market due to a lack of revolutionary innovation.

There are no construction companies among the 1,178 global unicorns, and it seems that there is no tech startups in the construction sector.

There is a long way ahead for the construction industry, and it must significantly reduce construction costs, substantially lower energy consumption, achieve energy self-sufficiency, and, of course, provide people with more comfortable and better living environments.

Finally, I want to share another prophecy. I believe that the construction industry will also become a Moore’s Law-driven industry. The low-carbon revolution, material revolution, and industrial and trade revolution will open up new prospects for the construction industry. I hope that this prophecy can be realized first in China, and I also hope that Hunan University, which is renowned for civil engineering and construction, can spearhead this revolution.


The article was first published on China.org.cn on Nov. 15, 2023 and reprinted by other news websites.

Who is feeding China?

Zhou Muzhi
Professor at Tokyo Keizai University


Editor’s note:

The Russia-Ukraine conflict has caused significant fluctuations in global food prices, bringing the issue of a potential food crisis back into the spotlight. In October 2023, Professor Zhou Muzhi from Tokyo Keizai University delivered a speech at the 4th World Shiology Forum in Haikou, Hainan province, where he addressed crucial questions such as “Who feeds the world?” and “Who is feeding China?” He also examined the paradoxes within global food trade and identified the regions in China with the most productive agricultural output. His speech also explored potential strategies for China to effectively tackle its food challenges in the future.


1. Who feeds the world?

About 50 years ago in 1972, the Club of Rome released a report titled “The Limits to Growth,” issuing a warning about the global population explosion that had occurred after World War II. This report, which argued that the Earth could not support continuous population growth, garnered significant worldwide attention.

However, contrary to these warnings, over the past half-century, the global population has doubled due to sustained growth in Asia and Africa. Surprisingly, the issue of food supply has not spiraled into a crisis as predicted in that report. In fact, when it comes to the overall quantity of food produced, not only does it suffice to feed the current global population, but there is also a surplus.

So, who and what are responsible for the continuous growth in global food production? If we look at the data from the past 60-plus years, from 1961 to now, we can find that the global area of arable land for grain has increased by merely 14%. Expanding cultivated land has not been a significant factor. However, during this period, the global population has grown by 158%, while the total grain production has increased by a staggering 250%. It is the faster growth rate of grain production compared to the population growth rate that ensures the Earth can feed the growing population.

So, what has contributed to this continuous increase in global grain output. Since it is not the expansion of arable land, it must be the yield per unit of land. Over the past 60 years, global grain yields per unit have increased by 207%.

So, what has contributed to such a significant increase in per unit crop output? It includes substantial inputs of pesticides and fertilizers, the widespread adoption of agricultural infrastructures like irrigation and roads, the organization and mechanization of agriculture, and, of course, improved crop varieties and advancements in agricultural technology. All of these factors collectively are known as the “Green Revolution.” It is the Green Revolution that has increased crop yields and enabled the Earth to support the vast population we have today.

2. The paradoxes of global food trade

The problem is, the Green Revolution, while increasing global food production, has exacerbated the disparity in agricultural productivity between developed and developing nations. The World Bank categorizes global economies into four groups: low income, lower middle income, upper middle income, and high income. According to studies by Cloud River Urban Research Institute, countries with higher incomes tend to exhibit higher agricultural productivity. This has resulted in a staggering 49-fold difference in agricultural productivity between high-income and low-income countries. The Green Revolution has transformed agriculture from a sector reliant on natural factors into one that requires significant capital and technological investments. Only countries capable of making substantial agricultural investments can achieve high returns. This is something we need to look into when addressing global food challenges.

The disparity in food production capacity between the Global North and the Global South has led to a surprising phenomenon — developed countries exporting food to developing nations. Currently, the largest agricultural exporter in the world is the United States, followed by the Netherlands at third place and Germany at fourth place. Meanwhile, the largest agricultural importer is China. Many of the developing countries represented at today’s World Shiology Forum are purely reliant on food imports. The advantage in agricultural trade depends not only on natural factors like arable land, soil, and climate but also significantly on agricultural productivity.

For developing countries with lower agricultural productivity, food imports partially help alleviate hunger, but at the same time, the influx of cheap agricultural products can undermine and even devastate their own agricultural sectors. Currently, nearly 800 million people worldwide face hunger issues, predominantly in countries with low agricultural productivity that are also vulnerable to food dumping by developed nations. Many African countries are typical examples of nations suffering from this situation.

3. Who will feed China?

In 1995, American scholar Lester Russel Brown published a report titled “Who Will Feed China?” raising a sharp question about who would feed China’s large population and pointing out that China’s massive food demand could threaten global food supply.

This report garnered much attention from the Chinese government at the time. However, in hindsight, China’s food supply did not encounter major issues. Today, China is nearly self-sufficient when it comes to essential foods, particularly rice and wheat.

So, who is feeding China? If we look at the data over the past 60-plus years since 1961, China’s grain cultivation area has only increased by 12%, and land reclamation has not contributed significantly to increased food production. During this period, China’s population has grown by 118%. Thanks to the Green Revolution, China’s food production has increased by 491%, significantly outpacing the rate of population growth.

Throughout this period, relative to per unit global grain yields, which increased by 207%, China’s per unit grain yields increased by 430%, a much higher improvement compared to the global average. In other words, China is one of the top performers of the Green Revolution. However, the heavy reliance on pesticides and fertilizers has led to significant environmental pollution, soil contamination, and health hazards that remain serious issues even today.

In 1960, China had the lowest per capita daily calorie intake, but today, this number is 2.3 times higher than that in that year. Domestic staple foods have fed China, which is a remarkable achievement.

4. The world’s largest importer of animal feed grains

Having enough to eat is not the only concern; the quality of food matters too. For Chinese people, good food often means meat. A Chinese consumes 62 kilograms of meat per year, significantly surpassing the global average of 42 kilograms and even exceeding Japan’s 54 kilograms. Since China’s reform and opening-up policies, meat production has surged nearly eightfold. From this perspective, it’s fair to say that Chinese people are enjoying a diverse and rich diet.

However, the production of meat in China heavily relies on imported animal feed grains. As I mentioned earlier, China stands as the world’s largest importer of agricultural products, with a particular emphasis on feed grains like soybeans, corn, sorghum, and barley. For example, China’s soybean imports constitute nearly 80% of the global total, with 60% of these imports originating from Brazil and 32% from the United States. Similarly, China’s corn imports account for nearly 22% of the world’s total, with 72% sourced from the United States and 26% from Ukraine, despite the ongoing conflict in the latter.

One major issue in agricultural trade revolves around price fluctuations, especially when conflicts and disputes, such as the Russia-Ukraine conflict, impact grain trade. Developing countries often bear the brunt of these price swings. It’s noteworthy that during the Russia-Ukraine conflict, many African leaders embarked on diplomatic missions to Ukraine and Russia, seeking mediation to resolve the conflict swiftly to ensure a stable grain supply for their nations.

5. Which region in China boasts the highest agricultural productivity?

What should China do to address its food security challenges in the future? For the time limit, I’ll offer just two recommendations. In China, there are 297 cities at the prefecture level or above, and Cloud River Urban Research Institute has conducted a comparative analysis of agricultural productivity in these cities. This productivity is measured by GDP of the primary sector per unit of arable land. We found out that the top 30 cities in China with the highest agricultural productivity are as follows: Sanming, Longyan, Fuzhou, Ningde, Zhoushan, Shantou, Nanping, Zhangzhou, Leshan, Lishui, Maoming, Putian, Chaozhou, Changsha, Zhuzhou, Sanya, Taizhou, Zhaoqing, Haikou, Bazhong, Danzhou, Pingxiang, Hangzhou, Shaoxing, Ningbo, Huangshan, Jieyang, Quanzhou, Guangzhou, and Foshan. Interestingly, all of them are located in the southern part of China. Among these, cities like Fuzhou, Changsha, Haikou, Hangzhou, and Guangzhou are economically prosperous metropolitan areas.

As I mentioned earlier, the North-South disparity in agricultural productivity is a result of the Green Revolution, where regions capable of making substantial investments in funds and technology outperform others. The ranking of agricultural productivity clearly illustrates that this phenomenon is highly noticeable in China as well. While climate, land resources, water resources, and crop varieties also play roles in determining agricultural productivity, it’s crucial not to overlook the fact that southern cities have more significant resources to invest in agriculture compared to their northern counterparts.

On the flip side, this implies that there is significant room for increasing rural income and agricultural production in northern China. Using what I call the concept of the “New Green Revolution,” which emphasizes smart, technology-driven methods over excessive reliance on pesticides and fertilizers, agriculture in China’s northern areas can thrive.

Although China has achieved self-sufficiency in staple foods, it still needs to substantially increase the production of animal feed grains to reduce pressure and dependence on global food trade. Therefore, I recommend investing heavily to transform agriculture into a high-tech industry characterized by high yields, high quality, and high returns. More importantly, through the New Green Revolution, we can ensure that the Chinese people have enough to eat but also eat safely and healthily.

6. Prioritizing develop-for-import policy

Twenty-five years ago, I was involved in an international cooperation project that stretched across the Eurasian continent, which was then known as the “Eurasian Land Bridge” concept. After the Cold War, substantial resources in Central Asia became accessible for exploitation. We proposed a collaboration between China and Japan to construct a railway and oil and gas pipelines across the Eurasian continent, facilitating the transportation of energy and grain from Central Asia to Shanghai and Lianyungang. These resources would then be shared with other East Asian countries like Japan and South Korea.

This initiative garnered favorable responses from both governments and received endorsements from the then Chinese and Japanese leaders. On April 1, 1999, I published an article titled “Euroasian land bridge carries great promise” on Nikkei, introducing the project to the world.

Despite China primarily being an exporter of grain and energy at the time, we foresaw that China’s rapid development would eventually make it the world’s largest importer of these commodities. Pitifully, Japan withdrew from the project for various reasons. Nevertheless, China built upon this project and developed the west-to-east gas transmission plan. Initially, the pipeline was constructed domestically before being gradually extended into Central Asia. Today, the Belt and Road Initiative has transformed the idea of a railway and oil and gas pipelines spanning the Eurasian continent into reality.

One key concept within the original proposal was “develop-for-import policy.” We believed that whether in grain or energy trade, the primary challenge was how to minimize volatility. The concept of “develop-for-import policy” meant that both importing and exporting countries would invest together, engaging in long-term cooperation for mutual benefit and stability.

I am pleased to observe that many projects under the Belt and Road Initiative operate with this “develop-for-import” mindset. Among the friends present today from more than 40 countries, some come from grain-importing nations, while others represent exporting countries. I hope that you can work together around this concept and genuinely address the challenge in global food supply.


The article was first published on China.org.cn on Nov. 15, 2023 and reprinted by other news websites.

Lessons from Japan’s ‘Lost Decades’: Development trajectories of China and Japan

Zhou Muzhi
Professor at Tokyo Keizai University


Editor’s note:

The ongoing discussions about Japan’s “Lost Decades,” a period of prolonged economic stagnation spanning 30 years, have sparked debates on whether Japan indeed lost momentum for three decades, the reasons behind it, and the potential takeaways for China. In June 2023, Professor Zhou Muzhi from Tokyo Keizai University delivered a lecture in Shanghai, offering a novel and comprehensive perspective on how Japan missed out on the prosperity driven by Moore’s Law. The fourth segment of his lecture compared China and Japan’s economic development and made a comparative analysis of the two country’s development trajectory.


1. Comparing the similarities and differences in China-Japanese economies

Returning to my discussion with professor Ezra F. Vogel, one of the topics we delved into was the comparison of similarities and differences in the economies of China and Japan. At that time, I highlighted the “similar” aspects, which referred to both countries’ reliance on exports and their rise driven by urbanization. On the other hand, the “different” aspects referred to China’s dependence on the global supply chain, while Japan excelled with a comprehensive industrial chain.

My doctoral dissertation focused on explaining the phenomenon of new industrialization in Asia. After World War II, most developing countries gained independence, but struggled to successfully achieve industrialization. Their attempts and experiments mostly ended in failure. It wasn’t until the 1980s that the Four Asian Tigers emerged, achieving export-driven industrialization.

The emergence of Four Asian Tigers triggered numerous explanations and debates internationally. Some attributed it to the Confucian heritage shared by these nations, while others suggested it was due to authoritarian development strategies. The explanations were varied and diverse. Given my engineering background and subsequent study of economics, I approached this issue from a technical perspective and proposed three explanatory angles.

Mechanical-Electronic Revolution: The advancement of semiconductor technology, driven by Moore’s Law, allowed for the integration of information and mechanical technology in equipment. This greatly expedited the industrialization process. After graduating from university, I participated in the construction of Baosteel Phase II, the largest project since the founding of the nation, and was responsible for automated control equipment. I personally experienced how industrialization could be rapidly achieved through the introduction of advanced equipment from developed countries, which was unprecedented in China. In my doctoral dissertation, I coined the term “Mechanical-Electronic” and emphasized its significance by adding the word “Revolution.” Both the title of my dissertation and its later published book were titled “Mechanical-Electronic Revolution and the New International Division of Labor.”

Rapid development of the electronic industry: Unlike the electrical industry, which deals with energy conversion machinery, the electronic industry produces equipment related to information. The semiconductor is its core element. In the 1980s, propelled by Moore’s Law, the electronic industry boomed, becoming the fastest-growing global industry. Through my research, I found out that its global layout set it apart from traditional heavy industries. It tended to have a global layout from the very beginning. It was this characteristic that made the electronic industry the dominant sector of Asia’s new industrialization.

Modular production brought transformations to the supply chain: To catch up with Apple, IMB adopted the modular production model for personal computers and made the designing rules for personal computers widely available around the world. Whether software or hardware, manufacturers could participate in the computer production supply chain as long as they followed IBM’s publicly available design rules. This was a massive change that completely altered the mechanism of industrial production. As this production method spread across the entire industrial sector, developing countries could easily participate in supply chains, which were becoming increasingly globalized.

In contrast, the characteristics of Japan’s manufacturing supply chain are quite different. Taking the example of automobile manufacturing, Japan has a pyramid-shaped division of labor system consisting of vehicle manufacturers and tiered levels of component suppliers. The relationship between vehicle manufacturers and these suppliers requires long-term technical, interpersonal, and capital integration, forming a relatively closed system. Academically, this type of supply chain is referred to as a comprehensive industrial chain.

2. Globalization driven by Moore’s Law

The open global supply chains facilitated by the modular production approach have brought unprecedented opportunities for developing nations. The explosive growth of the electronics industry has further fueled the reshaping of global industries. It’s through these intertwined factors that we predicted over two decades ago the emergence of the world’s largest new industrial clusters in the Pearl River Delta and the Yangtze River Delta, which would in turn foster megalopolises.

In 2007, I authored a book titled “The Chinese Economy: Mechanism of its Growth,” which was later translated into Chinese and published by the People’s Publishing House the following year. This book utilized the revolution in mechanical electronics, the rapid advancement of the electronics industry, modular production methods, and the global supply chain to explain China’s rapid economic growth. I firmly believe that the ongoing advancement of semiconductor computational power, following Moore’s Law, is propelling the evolution of human specialization and global trade – an essential cornerstone of modern globalization.

Comparing the evolution of semiconductor computational power under Moore’s Law with the development of global trade, a highly correlated relationship becomes evident. In essence, as semiconductor technology advances, global specialization becomes tighter, and trade relations expand, which is an embodiment of today’s logic of globalization.

China stands as both the primary beneficiary and driver of this wave of globalization, serving as its essential growth engine. On the contrary, as we look at the sweeping waves of globalization over the past few decades, it is clear that Japan struggles to keep up with the times.

What’s more, China’s emerging innovative companies and Japan’s traditional enterprises belong to different categories.

From this perspective, it’s unlikely that the Chinese economy will follow the path of Japan to experience the “Lost Decades.”

3. Embracing globalization is the key

During my talk with Shinji Takeda and Masatoshi Suzuki, we discussed an intriguing phenomenon: in movies released worldwide, less than 5% had production costs exceeding $100 million, yet these high-budget films accounted for 51% of the total box office revenue. This phenomenon illustrates the rarity of achieving both low production costs and substantial box office success. While exceptions exist, relying on miracles might not always be a sustainable strategy.

So, who can invest in massive productions surpassing the $100 million mark? It’s those companies with the ability to effectively penetrate the international market. Disney, with its exceptional prowess in integrating into global markets, leads the pack in producing high-budget films. In contrast, Japan has yet to produce a film with a budget exceeding $100 million, and few film and television projects are designed with international audiences in mind.

During our discussion, a Korean drama, “Crash Landing on You,” gained massive popularity in Japan. It was produced by the South Korean company Studio Dragon, which was established in 2016 and exclusively creates content for Netflix. Leveraging the global streaming platform Netflix, Studio Dragon’s television exports now exceed Japan’s by eightfold.

In Japan’s TV drama sector, NHK’s historical dramas represent the largest investments, yet the budget for one of these shows is approximately only one-twentieth of Studio Dragon’s.

This phenomenon underscores the point that substantial returns are only achievable when the international market is prioritized – an essential cycle for supporting large-scale productions.

Although TBS, led by Mr. Takeda, has managed to create immensely popular TV dramas like “Naoki Hanzawa,” if it doesn’t actively explore the international market or embrace globalization, its full potential cannot be unleashed.

Regrettably, over the past three decades, conservative Japanese enterprises have often lacked the capacity to fully embrace globalization.

4. China’s three 30 years versus Japan’s two 30 years

In 2010, Mr. Yang Weimin and I co-authored a book titled “The Third Thirty Years: A New Direction for China,” which divided China’s development from 1949 to 2009 into two thirty-year periods, and looked ahead to the third thirty years starting in 2010. While others might have employed the method of analyzing China’s history in thirty-year segments earlier than us, I have yet to come across such an approach myself. Nonetheless, this method has become widely used today.

Using 1990 as a marker, if we divide Japan into two thirty-year periods, we can observe that from 1960 to 1990, during the initial thirty-year period, Japan’s share of the global economy grew from 5.4% to 10%. However, in the subsequent thirty years from 1990 to 2020, Japan’s share dropped from 10% to 5%.

In these later thirty years, the Japanese government was not idle. To stimulate the economy, they pushed fiscal and monetary policies to their limits.

To implement a proactive fiscal policy, Japan issued bonds and accumulated debt, leading to a national debt-to-GDP ratio of 261%, making it the most indebted developed nation. Monetary policy became increasingly lenient, transitioning from low interest rates to zero rates, and even venturing into negative rates. Remarkably, the Bank of Japan, responsible for currency issuance, acquired significant amounts of government bonds to provide support. They not only obtained 70% of newly issued government bonds but also held half of the bonds available in the market. In a more unconventional move, the Bank of Japan purchased a considerable volume of stocks to bolster the stock market, becoming the largest single purchaser in Japan’s stock market.

Although Japan’s government and central bank had taken substantial risks in terms of national debt and currency with these unconventional stimulus policies, they were still unable to breathe new life into the Japanese economy. This underscores the significant negative impact of three detrimental factors: small constituency system, the consumption tax, and risk-averse thinking.

Throughout modern history, the trajectories of China and Japan have often moved in opposite directions. In China’s initial thirty years since the founding of the People’s republic of China, its share of the global economy plummeted from 5.2% to 1.7%. In the second thirty years, the implementation of the reform and opening up policy boosted China’s share to 9.2%, and today, this share has surged to 18.2%. China’s economic scale is poised to soon exceed Japan’s by fourfold.

Zooming out on the timeline to the pre-Opium War era of 1800, China commanded an impressive 33% share of the global economy, while Japan’s share was a modest 3.6%. By 1990, Japan’s share peaked at 10%, but China’s share hit a nadir at 1.7%. From that pivotal point, China’s share in the world economy has consistently risen, while Japan’s has steadily fallen, a trend that persists even today.

5. Is China a risk or opportunity?

How should we perceive China’s rise? Japan needs to think from a broader and forward-looking perspective.

During the G7 summit held in Hiroshima this May, a consensus was reached on mitigating the risks associated with China’s economic rise. Remarkably, the fact that this “de-risk” mindset are extended into relations with China has, in part, underscores the reason why I’ve been consistently emphasizing the dangers inherent in overly risk-averse thinking.

Over the years, I’ve often emphasized to my friends in Japan that China isn’t a risk for Japan. Instead, it represents Japan’s most significant opportunity. Failing to seize this opportunity could spell irreparable consequences for Japan’s economy.

Allow me to conclude my speech with another story. Adjacent to this conference venue stands the Shanghai World Financial Center, a location many of you may have visited. At one point, it was China’s tallest skyscraper. It was invested by the Japanese company Mori Building. President Minoru Mori, along with his father, established the firm. His father had also studied and taught at Tokyo Keizai University. Minoru Mori possessed both a visionary understanding of urban development and unwavering faith in China’s progress. At the onset of Pudong’s development, Mr. Mori, under the encouragement of Mr. Zhao Qizheng, committed substantial resources to construct this building in Pudong New Area. The pressure was intense at that time, as many advised against such a sizable investment in China. Nevertheless, he remained steadfast in his conviction about China’s promising future, weathering various disruptions and challenges during the construction phase.

On Nov. 18, 2009, during the opening forum of the Shanghai World Financial Center, Mr. Mori, Mr. Heizo Takenaka – who had once overseen Japan’s Cabinet economic policy – and I discussed and forecasted the future of Asian urban development. The opening coincided with the aftermath of the global financial crisis triggered by the U.S., leading to widespread economic uncertainty and causing numerous international clients to back out. The challenges were immense. Yet, Mr. Mori’s foresight paid off. China’s rapid economic growth quickly reversed the situation, and the building has since become a valuable asset for their company.

This story underscores that China presents a remarkable opportunity for Japan. It’s regrettable if Japan’s political and industrial sectors fail to adopt a broad and forward-thinking perspective to grasp this reality.

Of course, Japan’s economy is currently strong, society is stable, and citizens lead relatively well-off lives.


The article was first published on China Daily, China.org.cn on Sep. 13, 2023 and reprinted by other news websites.

Lessons from Japan’s ‘Lost Decades’: Woes of single-seat constituency system

Zhou Muzhi
Professor at Tokyo Keizai University


Editor’s note:

The ongoing discussions about Japan’s “Lost Decades,” a period of prolonged economic stagnation spanning 30 years, have sparked debates on whether Japan indeed lost momentum for three decades, the reasons behind it, and the potential takeaways for China. In June 2023, Professor Zhou Muzhi from Tokyo Keizai University delivered a lecture in Shanghai, offering a novel and comprehensive perspective on how Japan missed out on the prosperity driven by Moore’s Law. In the third part of his lecture, he analyzed the dangers brought about by Japan’s electoral system reforms.


1. Importance of macroscopic imagination

Twenty-two years ago, I made a prediction and also made a call to action, urging China to embrace urbanization, promote the development of large cities, and foster the growth of urban clusters. On Sept. 3, 2001, an international symposium titled “China Urbanization Forum – Strategies for the Development of Metropolitan Clusters” was jointly organized by the National Development and Reform Commission’s Regional Economic Development Department, the Japan International Cooperation Agency, China Daily, and the China Association of Mayors in Shanghai. This symposium was first held in Nanjing, then moved to Beijing, further to Shanghai, and finally to Guangzhou on Sept. 7. At the time, during the era of “small towns, big strategy,” discussing urbanization was considered a taboo. However, our series of conferences on the strategy for the development of metropolitan clusters gathered numerous renowned scholars and officials, including Yu Guangyuan, Ren Zhongyi, Chen Jinhua, Tao Siliang, Zhu Yinghuang, Lin Shusen, Li Ziliu, Yang Chaoguang, and Du Ping.

The media also provided strong support. On Sept. 3, China Daily dedicated an entire page to my opinion on metropolitan clusters. Economic Daily published my article titled “Embrace Small Towns and Large Urban Circles” on nearly an entire page. Following the symposium, People’s Daily published a full-page report under the title “Metropolitan Clusters: China’s Opportunities and Challenges,” offering comprehensive coverage of the event. Particularly in Guangdong province in southern China, local media showed extraordinary enthusiasm. Suddenly, media outlets nationwide began discussing two questions: What are metropolitan clusters? And why do we promote large urban clusters? This conference marked a beginning of discussions on urbanization, megalopolises, and metropolitan clusters.

This is how macroscopic imagination began and received enthusiastic responses. In fact, we collaborated with the National Development and Reform Commission to present this prediction and a series of policy recommendations based on years of research. In 2001, we foresaw that China would create the world’s largest new industrial agglomerations and metropolis clusters in the Yangtze River Delta, the Pearl River Delta, and the Beijing-Tianjin-Hebei region, which would bolster China’s future.

The year 2001 was a watershed as two major events took place in the year: the 9/11 terrorist attacks and the ensuing U.S. launch of war in Afghanistan, as well as China’s accession to the WTO. Undoubtedly, these two events significantly accelerated the materialization of the prophecy of metropolis clusters, and today, this prophecy has become a reality.

Why were we able to accurately predict the future back then? The underlying logic is akin to Toffler’s prophecy — it’s the Moore’s Law. With an engineering background and years of research on industrial agglomeration, I firmly believed that the globalization of supply chains would swiftly take place. From this, I deduced that it would trigger a global industrial reshuffling, with China’s Pearl River Delta and Yangtze River Delta being the wisest choices. The key to such large agglomerations is rapid urbanization and the growth of urban clusters.

To put it another way, Moore’s Law not only fosters microscopic imagination but also fuels macroscopic imagination. Macroscopic imagination often has the power to stimulate a nation’s developmental potential.

2. Japan once imagined big

During the aforementioned China Urbanization Forum, I invited many renowned Japanese scholars to participate in discussions. Among them were Tadao Kiyonari, president of Hosei University and a leading figure in Japan’s industrial policy; Shinyasu Hoshino, former vice minister of the Economic and Fiscal Policy Bureau and a key figure in Japan’s land planning; Shigeru Ito, a professor at Waseda University and head of Japan’s National Land Planning Review Council; Yuji Masuda, a professor at the University of Tokyo and a strategist in Japan’s information industry policy; Shuhei Konno, professor at Osaka Sangyo University and a land planning expert who led the Tokyo Bay Comprehensive Development Plan, among others. They are heavyweights in Japan’s land planning.

Japan’s National Comprehensive Development Plan stands out as the most important national plan in Japan. Experts and officials responsible for the plan, represented by the abovementioned individuals, have provided Japan with numerous grand imaginations. For example, high-speed railways have transformed the perception of time and the pace of life for in China. The idea of high-speed railways, known as the Shinkansen in Japan, was actually created by Japanese people. The concept of the Shinkansen was proposed in Japan’s land planning. As early as the 1960s, Japan introduced the concepts of informatization and high-speedization in land planning, using the Shinkansen and expressways to reorganize the country’s land utilization.

The coastal industrial zone is another significant concept advocated by Japan’s land planning. After World War II, Japan aimed to take advantage of global peace dividends and promoted the construction of new industrial bases in coastal areas, forming a Pacific industrial belt. By capitalizing on cheap global resources and a vast international market, Japan pursued large-scale imports and exports, resulting in its emergence as a major industrial exporter and achieving rapid growth.

Japan’s land planners not only put forth initiatives such as the “Doubling of National Income Plan” and the “Remodeling of the Japanese Archipelago,” but also introduced innovative spatial concepts like new industrial cities, watershed circles, and a one-day exchange circle in East Asia. It advocated for broad living areas, rural urbanization, and a multipolar decentralized land configuration as future land development ideas, laying the foundation for Japan’s post-war development.

From Japan’s land planning, it’s evident that Japan used to be a country that didn’t lack macroscopic imagination. However, why is it grossly lacking macroscopic imagination today? This is another toxin, an ailment bred by political reforms, wreaking havoc on the nation.

3. Single-seat constituency system strangles macroscopic imagination

Looking back at history, we will find that not all reforms lead to progress or correctness; many times, the outcome of reform is worse — a harmful change. The reform of Japan’s electoral system in the 1990s serves as a typical example of such a harmful change.

Japan used to carry out the multi-seat constituency system that could elect multiple representatives. With competition in elections not very fierce, there was ample room for opposition parties to survive. This led to an incredibly stable “man-based” political landscape. In 1993, a group of young politicians from the Liberal Democratic Party, led by Ichiro Ozawa, rebelled against the veteran leadership and collaborated with opposition parties to establish a new regime under the leadership of Morihiro Hosokawa. In 1994, leveraging the newfound popularity of their regime, this group, under the guise of political reforms, changed the electoral system from multiple-member constituency to single-seat constituency.

However, the single-seat constituency system has begotten numerous ills. One of them is to make competition very brutal. Each constituency could only elect one representative, and even a slight vote swing could alter a politician’s fate drastically. As a result, all representatives have lost their sense of security and have to go all out to win hearts of voters in their constituencies.

Imagine when politicians are solely preoccupied with their own constituencies, what room remains for the country’s macroscopic imagination?

The single-seat constituency system has made vote seeking the most crucial daily task for politicians, turning frequent public appearances into a virtue. Current Prime Minister Fumio Kishida, who was the longest-serving foreign minister in Japanese history, used to visit his constituency of Hiroshima every week to seek support. After he became prime minister, his first major task was to relocate the G7 summit to Hiroshima.

Another drawback of the single-seat constituency system is that it has centralized the allocation of political funds at parties, intensifying the influence of party politics. This has not only weakened factions within parties but also prevented representative from demonstrating their personalities, further strangling macroscopic imagination.

4. Single-seat constituency system destructs social correction mechanisms

More critically, over the past two decades, the strengthening of party politics under the single-seat constituency system has not only eroded the rights and individuality within political parties but has also taken toll on opposition parties, the administration, media, academia, and other domains.

Under the single-seat constituency system, the popularity of parties largely determines their success. Election somewhat resembles the “Five in a Row” game, where it’s either an all-win or all-lose outcome. The post-election political landscape often becomes one-sided, with the power of opposition parties dwindling and their ability to balance political power diminishing.

In the past, to ensure the neutrality and independence of the administration, political intervene in the appointment and removal of administrative officials is forbidden. However, today, we all know that appointments of high-ranking administrative officials are determined by the prime minister’s office. Political interference in administrative appointments has severely undercut the independence of the entire administrative sphere.

The erosion of power has also become overtly visible in the media. For instance, today, the government’s political motives behind appointing president of NHK, Japan’s national public broadcasting organization, are apparent. The critical power of Japan’s media toward politics is far from what it was 30 years ago.

Academia is not exempt either. On Nov. 21, 2020, during an academic symposium commemorating the 120th anniversary of Tokyo Keizai University, I invited Professor Takashi Onishi, former president of the Japan Academy Council, and Tokuo Nakai, vice minister of environment, to weigh in with their views in a dialogue. During the conversation, Onishi expressed strong dissatisfaction with the interference of higher authorities in academic appointments. Not too long ago, Prime Minister Yoshihide Suga, without providing any specific reasons, rejected the appointment of six members nominated by the Japan Academy Council, triggering a strong backlash from the academic community.

The spillover of political erosion hasn’t just killed macroscopic imagination but has also severely damaged Japan’s social correction mechanisms. This is also why consecutive increases in the consumption tax rate under the Abe administration did not evoke the same kind of backlash threatening the stability of the regime as before.


The article was first published on China Daily, China.org.cn on Sep. 13, 2023 and reprinted by other news websites.

Lessons from Japan’s ‘Lost Decades’: An underdog in the era of innovation and entrepreneurship

Zhou Muzhi
Professor at Tokyo Keizai University


Editor’s note:

The ongoing discussions about Japan’s “Lost Decades,” a period of prolonged economic stagnation spanning 30 years, have sparked debates on whether Japan indeed lost momentum for three decades, the reasons behind it, and the potential takeaways for China. In June 2023, Professor Zhou Muzhi from Tokyo Keizai University delivered a lecture in Shanghai, offering a novel and comprehensive perspective on how Japan missed out on the prosperity driven by Moore’s Law. The second part of his lecture addressed Japan’s failure to seize the era of innovation and entrepreneurship.


1. The era driven by Moore’s Law

Although I am an economist, I have an engineering background with a bachelor’s degree in automation. Moore’s Law is one of the fundamental concepts in automation. Alvin Toffler’s “The Third Wave” back in the early 1980s filled me with excitement. He depicted numerous scenes in the future Information Age and proclaimed himself a “futurist.” Toffler’s audacity was backed by his predictions, fueled by the source of imagination: Moore’s Law. Decades later, many of Toffler’s prophecies have become reality.

Moore’s Law, coined in 1965, posited that the number of transistors on a semiconductor chip would double every 18 months, leading to a halving of semiconductor prices. This trend opened up immense possibilities fueled by imaginations.

After 1970, as semiconductors evolved in accordance with Moore’s Law, they gave rise to numerous products and services. From hardware like computers, smartphones, and iPads to network services like email, web pages, and search engines, as well as social media platforms like Facebook, WeChat, and Twitter, streaming services like YouTube, Netflix, and TikTok, e-commerce platforms like iTunes, Amazon, Taobao, and SHEIN, digital currencies like Bitcoin, AI applications like ChatGPT and autonomous driving — the proliferation of products and services has been unprecedented and continues to evolve.

It’s worth noting that many of these products and services are provided by sci-tech companies. It’s these nascent enterprises that have led the global transformative development over the past three to four decades. I define this phase of human development driven by the evolution of semiconductors as the “era driven by Moore’s Law.”

2. L-shaped development model

NVIDIA’s shares have surged this year and surpassed Intel and TSMC in market value, catapulting into the top 10 globally. The trajectory of NVIDIA’s market value resembles an L-shaped curve, having endured an extended period of low stock value before skyrocketing. Let’s term this type of development “L-shaped development.”

Why could NVIDIA persist for so long without giving up? Co-founder Jensen Huang has attributed NVIDIA’s persistence to Moore’s Law. He knew that his GPUs would become faster and cheaper over time, and even if there weren’t customers now, he believed there would be a vast market.

Being imaginative is a shared trait among sci-tech companies, and the L-shaped development is built upon the imagination of the future.

For individuals or enterprises aiming to succeed in the era driven by Moore’s Law, imagination is crucial. If a country wants to win, it requires a grand macroscopic imagination. Yet, attempting to eliminate all unpredictability through risk-averse management stifles imagination. In the era driven by Moore’s Law, eliminating risk and imagination might equate to squandering opportunities.

Emphasizing risk avoidance could be considered an inherent toxin for an island nation like Japan. Japanese society emphasizes stability and tradition, with a strong aversion to risks. To flourish with the L-shaped development is challenging amid such a social mentality. The collective risk-averse thinking mentality clashes with the rapid changes of the world under the influence of Moore’s Law.

3. Three key elements of L-shaped development

In 2020, Tokyo Keizai University celebrated its 120th anniversary with an academic symposium. The university is closely connected with China. During the anniversary forum, I invited TBS Television’s Chairman Shinji Takeda and one of the founders of NTT DoCoMo, Masatoshi Suzuki, to discuss the digital transformation of industries.

We talked about Over-the-Top (OTT) streaming’s impact on movies and television. The outbreak of the COVID-19 pandemic in 2020 led to the closure of movie theaters. ByteDance moved the major Chinese New Year film “Lost in Russia” to streaming platforms. This was the first time that a blockbuster film was shifted to streaming without premiering in theaters, marking a significant exemplar of commercial model innovation in China.

In the same year, Disney’s blockbuster “Mulan” and Christopher Nolan’s “Tenet,” each costing around $200 million, directly hit streaming platforms. While these films attempted at theater releases, they eventually ended up on streaming platforms due to the pandemic. The ability of streaming platforms to handle and accommodate blockbuster films had been accelerated by the evolution of networks under Moore’s Law. Just three years later, the trend of premiering major films directly on streaming platforms has become commonplace.

Represented by Netflix, streaming platforms have undergone an L-shaped development, transitioning from DVD rentals to streaming and further into content production. The company’s stock experienced an extended period of stagnation before soaring.

Three crucial elements are essential for L-shaped development: imagination, leadership, and teamwork. Without these three factors, enduring prolonged periods of pain and struggle is out of the question. These three are challenging to maintain in large, bureaucratized corporations; most of the successful instances of L-shaped development occur in sci-tech companies. Only startups bosting state-of-the-art technologies have the potential to combine imagination, leadership, and teamwork.

4. Japan overshadowed in sci-tech age

In 1989, when Japan’s corporations were on the crest of a wave, there was no sci-tech company among the global top 10 by market capitalization. The most technologically advanced company on the list was IBM, founded in 1911 and nearly 100 years old back then. Now, looking at today’s global top 10 companies by market capitalization — Apple, Microsoft, Google, Amazon, NVIDIA, Tesla, Facebook, TSMC — 8 of them are innovation-driven companies. Among them, the oldest is Microsoft, founded in 1975, and the youngest is Facebook, established in 2004.

Over the past three decades, the dynamics of corporate competition have completely changed. The emergence of innovation-driven companies has turned them into the most influential leaders shaping and changing the world.

It is surprising that no sci-tech company made today’s list of Japan’s top 30 companies. The average founding year of the top 30 companies is 1919, with an average age above 100. Only one company, SoftBank, was founded after the 1980s. The company could not be considered a sci-tech company, despite its investment in sci-tech companies. Even with SoftBank included, there are only three companies founded after the 1960s.

Many of these aged Japanese corporations have become heavily bureaucratized and find it difficult to produce leaders with strong personalities and foresight.

Unlike American companies, Japanese companies do not hire professional managers to run their businesses. Instead, they cultivate executives from within. Those who have worked their way up the corporate ladder from ordinary employees to CEOs are often those who haven’t made mistakes at every career stage. Such company leaders are naturally risk averse.

These aging corporations lacking strong leadership are unlikely to invest in new ventures that involve risk, and even when confronting difficulties, they are unlikely to undertake “dirty work” such as making their company slim. Nissan’s revival during a management crisis serves as an example. Without the bold actions of Carlos Ghosn, including significant layoffs, Nissan’s resurgence wouldn’t have been possible.

5. Collapse of electronic kingdom and challenges of automotive powerhouse

Over a decade ago, I made two predictions — Japan’s electronic kingdom would collapse and Japan’s leadership in the auto industry would face severe challenges.

Japan was the earliest beneficiary of Moore’s Law and a dominator in the electronics industry. There was a time when Japan’s electronic products were a global household product and the country positioned itself as a big electronic manufacturer. In 2009, my book “Move into Cloud Era” was published. The book includes an article titled “Japan: The Collapse of the Electronic Kingdom,” once published by the Global magazine, a publication of Xinhua News Agency.

Unfortunately, one of my predictions has become a reality today. Industries such as semiconductors, home appliances, computers, smartphones, LCDs, solar panels — most of Japan’s former leading industries — have either dwindled or disappeared. Few people today remember that Japan was once the world’s top semiconductor producer.

In March 2010, I wrote a column for the Global magazine titled “Toyota’s Real Crisis,” clearly pointing out that Toyota, which had reached its peak under the old industrial environment and production model, would face challenges from emerging electric vehicle manufacturers like Tesla and BYD. How to navigate the electric vehicle era would be a challenge that determines Toyota’s survival.

Clearly, Toyota hasn’t handled this challenge well, and it currently finds itself stuck in a dilemma. In July 2020, Tesla’s market capitalization surpassed Toyota to become the world’s most valuable automaker. However, Tesla’s vehicle sales were only a thirtieth of Toyota’s, and its revenue was just an eleventh of Toyota’s. Despite being the global leader in both vehicle sales and profit, Toyota was surpassed in market value. Why? This is perhaps the most puzzling question for the Japanese to comprehend and one they are most reluctant to confront.

A decade ago, when I researched modular production methods, I contended that automotive manufacturing would one day become a supply chain based on modular production. Some Japanese scholars disagreed, stating that automotive production differed from electronics production and required more coordination. They argued that behind this coordination, there should be a high level of trust, capital convergence, and long-term personnel interactions. In other words, the Japanese-style pyramid hierarchy is most suitable for automotive manufacturing. However, Moore’s Law is relentless. With the evolution of semiconductor computing power, automotive manufacturing has also evolved into an industry characterized by modular production, and the emergence of electric vehicles has accelerated the evolution.

Tesla is totally different from Toyota. After enduring prolonged sufferings, it has finally gained recognition and achieved the L-shaped development. Today, Tesla’s market capitalization far exceeds that of Toyota.

The L-shaped development entails a trial-and-error phase that is quite painful, and this process can be quite prolonged. The promising future lies ahead, but when it arrives remains uncertain, leading to enduring hardship. Whether it’s Tesla, BYD, NVIDIA, or Netflix, every poster child of the L-shaped development has inevitably gone through this ordeal.

However, Japan’s social environment and corporate logic are ill-equipped to endure such struggles. Therefore, it’s hard for sci-tech companies to achieve the L-shaped development in Japan.

As a backup to L-shaped development, Japan’s unicorn companies are also few and far between. Only six of the 1,678 unicorn companies worldwide are Japanese. This number is grossly disproportionate to Japan’s standing as the world’s third-largest economy.


The article was first published on China Daily, China.org.cn on Sep. 13, 2023 and reprinted by other news websites.

Lessons from Japan’s ‘Lost Decades’: The pitfalls of consumption tax

Zhou Muzhi
Professor at Tokyo Keizai University


Editor’s note:

The ongoing discussions about Japan’s “Lost Decades,” a period of prolonged economic stagnation spanning 30 years, have sparked debates on whether Japan indeed lost momentum for three decades, the reasons behind it, and the potential takeaways for China. In June 2023, Professor Zhou Muzhi from Tokyo Keizai University delivered a lecture in Shanghai, offering a novel and comprehensive perspective on how Japan missed out on the prosperity driven by Moore’s Law. The initial segment of his lecture focused on analyzing the adverse impact of the consumption tax.


1. Japan as No. 3

The title “Lessons from Japan’s ‘Lost Decades’ for China” encompasses three key points. Firstly, there’s the debate over whether Japan truly experienced the “lost decades” spanning 30 years. Some argue that this notion is misleading, asserting that Japan didn’t actually lose three decades, whereas more people believe that Japan not only lost three decades but might also continue to face challenges in the future. Secondly, the discussion revolves around the factors that contributed to Japan’s “lost decades,” leading to a wide range of viewpoints. Lastly, there has been a heated discussion on whether China could potentially find itself in a situation of prolonged economic stagnation similar to Japan’s.

From 2007 to 2009, I was in Boston, where I had frequent talks with professor Ezra F. Vogel of Harvard University. He was then working on the book, “Deng Xiaoping and the Transformation of China,” which made him famous among the Chinese readers. Actually, he was also well-known in Japan, largely due to his book “Japan as Number One: Lessons for America,” which heightened Japanese confidence following a period of rapid economic growth.

In 2009, Xinhua News Agency organized a dialogue between Professor Vogel and me, and subsequently published an article on the event. Notably, the Japanese edition of Newsweek magazine later featured a cover story titled “Japan as No. 3.” This emphasis on our dialogue stemmed in part from the significant news of China surpassing Japan to become the world’s second-largest economy.

A decade later, coinciding with the abdication of Emperor Akihito and the conclusion of the Heisei era in 2019, Newsweek produced a special issue titled “Looking at Heisei Through Newsweek.” The Heisei era spanned from 1989 to 2019, encompassing 30 years. Over this extensive period, Newsweek published a total of 1,500 issues. This special edition meticulously selected representative articles from this vast archive, offering insights into and defining Japan’s Heisei era.

2. Lessons from Heisei Era: The Japanese concept of impermanence

This special edition is structured into three segments, representing the three decades of the Heisei Era. In the final decade, only three articles were selected. Among them was our dialogue with Professor Vogel titled “Japan as No. 3,” another delved into the aftermath of the “3.11” earthquake and nuclear disaster, while the third explored the enduring cultural legacy left by Hayao Miyazaki on the global stage. As a concluding note, the chief editor penned a thought-provoking commentary titled “Unveiling the Notion of ‘Impermanence’ in the Heisei Era.”

The chief editor believed that a series of unforeseen events marked the beginning of the Heisei Era – ranging from the bursting of the economic bubble to shifts in political power, the “3.11” earthquake and its nuclear aftermath, and the gradual loss of Japan’s economic prominence to China. These unprecedented events, accompanied by their resulting catastrophes, upheavals, and a prevailing sense of loss, underscore the profound “impermanence” that defined the Heisei Era.

The changes in the global corporate market values rankings further underscores Japan’s decline over the Heisei Era. At the dawn of Heisei Era, seven Japanese companies were among the top 10 in market capitalization, with the top five being all Japanese enterprises – a period of remarkable Japanese economic supremacy.

Yet, by the year 2019, as Japan transitioned out of the Heisei Era, none of Japan’s companies remained in the top 10 global corporate market value rankings, and instead, two Chinese firms, Alibaba and Tencent, took their place among the top contenders.

The top 50 global corporate market values ranking reveals a startling statistic: in 1989, a total of 32 Japanese companies were featured. However, by 2019, only Toyota maintained a presence in the top 50, while eight Chinese companies had surged into the ranks. As of today in 2023, five Chinese companies have secured spots in the global corporate market values ranking. Meanwhile, Toyota, which is the sole representative from Japan, has fallen in the rankings and is at risk of dropping out of the top 50.

Considering these changes, it’s clear that Japan has indeed felt a significant sense of decline.

3. Japan has truly experienced three decades of decline

If we divide the past 60-plus years since 1960 into two 30-year periods, with 1990 as the dividing point, we can see distinct shifts in Japan’s trajectory. The first 30 years, from 1960 to 1990, were characterized by consistent growth. Japan’s economic expansion consistently outpaced the average of the OECD, a group of developed countries. During this period, Japan’s share of the global GDP doubled from 5.4% to 10%, reaching its peak.

However, the subsequent 30 years was a complete different story. In 1992, Japan transitioned from being an exemplary performer within the OECD to a lagging player. Its economic growth rate consistently fell below the OECD average. In other words, Japan’s stagnation stood out starkly among developed nations, representing a prolonged and structural challenge that persisted for three decades without a turnaround. Over the past 30-plus years since 1990, Japan’s global GDP share dwindled from 10% to today’s 5.1%, even dipping below levels from 60 years ago. This downward trend still continues.

Without a doubt, Japan’s later three decades can be labeled as “lost decades,” debunking any notion that it’s a false premise. So, what are the reasons behind this prolonged stagnation? Many have offered explanations, some more convincing than others. From the vantage point of someone who has lived in Japan for over 30 years, continuously observing its socio-economic landscape from both broad and intricate perspectives, if I were to highlight three key reasons, they would be the consumption tax, the small constituency system, and a prevalent aversion to taking risks.

4. Consumption tax has drained vitality from Japan’s economy

This tax has been a subject of contention among Japanese leaders spanning several generations since 1970, and its implementation came at the cost of multiple administrations, gradually increasing the tax rate to 10%.

In 1979, Prime Minister Masayoshi Ohira first introduced the concept of “consumption tax,” which resulted in the Liberal Democratic Party’s defeat in the elections and compelled the abandonment of the proposal. In 1987, Prime Minister Yasuhiro Nakasone attempted to introduce the concept of “sales tax” but faced strong opposition and setbacks. In 1989, the forceful Prime Minister Noboru Takeshita imposed a 3% consumption tax, only to resign a month later due to mounting pressure. Five years later, in 1994, Prime Minister Morihiro Hosokawa, buoyed by immense popularity, proposed the concept of “National Welfare Tax” to raise the consumption tax rate. However, the proposal encountered much greater opposition than expected, leading to its withdrawal and his resignation. In 1997, Prime Minister Ryutaro Hashimoto raised the consumption tax rate to 5%, eventually costing him his position. In 2009, the Democratic Party came to power with the pledge of “no increase in consumption tax for four years,” marking a change in administration. The consumption tax rate was increased to 8% in 2014 and further raised to 10% in 2019 under Prime Minister Shinzo Abe’s administration. The reasons behind Abe’s ability to raise the consumption tax twice without losing power will be discussed in subsequent sections.

What force compelled successive generations of Japanese politicians to champion the implementation of the consumption tax? This tax was strongly advocated by the Ministry of Finance. Without the backing of this powerful government agency, no political leader could maintain the continuity of their administration.

The name “consumption tax” itself was a “Trojan horse conspiracy.” Having spent time as a visiting researcher at the Institute for Fiscal and Economic Policy in the Japanese Ministry of Finance, I gained insights into the ministry’s dynamics. In my perspective, the Ministry of Finance’s greatest post-war blunder was the introduction of consumption tax. The term “consumption tax” should rightly be referred to as a “transaction tax.” Unfortunately, the misleading name led people to believe it is only related to purchasing. While generating public resentment, it seems to have little negative effect on production. Actually, the consumption tax applies not only to consumption but also to transactions within the production process. So, I’d rather call it a transaction tax.

The misleading “consumption tax” have led the Japanese society to underestimate its harmful impact.

The first chapter of the economics classic “The Wealth of Nations” discusses division of labor. Adam Smith considered division of labor the foundation of modern society and a key factor in boosting productivity. Today, it’s universally acknowledged that advancing a society hinges on expanding, refining, making fairer, and globalizing its division of labor. Yet, Japan’s consumption tax has cast a shadow on the development of division of labor within its society. Achieving a 10% profit in business is no simple feat, and the substantial consumption tax levied on each transaction severely impedes the growth of Japan’s division of labor and social vitality.

Indeed, the consumption tax could be likened to a “tumor” that systematically hinders Japan’s economic growth. Since its introduction in 1989, the Japanese economy has been on a downward trajectory.

5. Excessive emphasis on risk aversion constitutes the biggest risk

Another factor that has contributed to the prolonged stagnation of the Japanese economy is an excessive emphasis on risk aversion. I have had extensive interactions with the Japanese business community and have served as an independent director and advisor for companies listed on the main board in Japan. If I were to define the operating style of Japanese companies in one phrase, it would be “risk avoidance.”

Japanese corporate leaders often seek to thoroughly understand, eliminate, or mitigate all potential risks before making decisions. Compared to entrepreneurs in China and the U.S., Japanese business leaders have a particularly strong risk-averse mindset.

This mindset is not limited to business leaders but is also prevalent in the Japanese government. However, things often turn out to be counterproductive.

Reflecting on the first year of Heisei Era, or the year 1989, we can see that among the top 10 global companies by market value, there were five Japanese banks: the Industrial Bank of Japan, Sumitomo Bank, Fuji Bank, Dai-Ichi Kangyo Bank, Mitsubishi Bank. These banks were among the highest-valued financial institutions globally at that time. Despite this, the Japanese government was concerned that their size was insufficient to cope with future global financial competition. They insisted on expanding the scale of these banks to make them capable of standing firm in the face of global financial storms.

As a result, an unprecedentedly massive wave of bank mergers was initiated by the government. Every bank on the top 10 list underwent these forced mergers. However, the outcome after 30 years was that Japanese banks not only vanished from the top 10 global market value list but were also absent from the top 50 list.

These forced mergers, often involving mismatched corporate cultures and personnel factions, resulted in internal conflicts outweighing the benefits of synergies. For instance, the Mizuho Bank, which was formed after the merging of the Industrial Bank of Japan, Fuji Bank, and Dai-Ichi Kangyo Bank in 1999. Since the merging, it has encountered frequent system failures even today due to the inability to effectively integrate their systems.

Therefore, excessive emphasis on risk aversion can ironically become the greatest risk itself.


The article was first published on China Daily, China.org.cn on Sep. 13, 2023 and reprinted by other news websites.