Cloud River Urban Research Institute
Editor’s note:
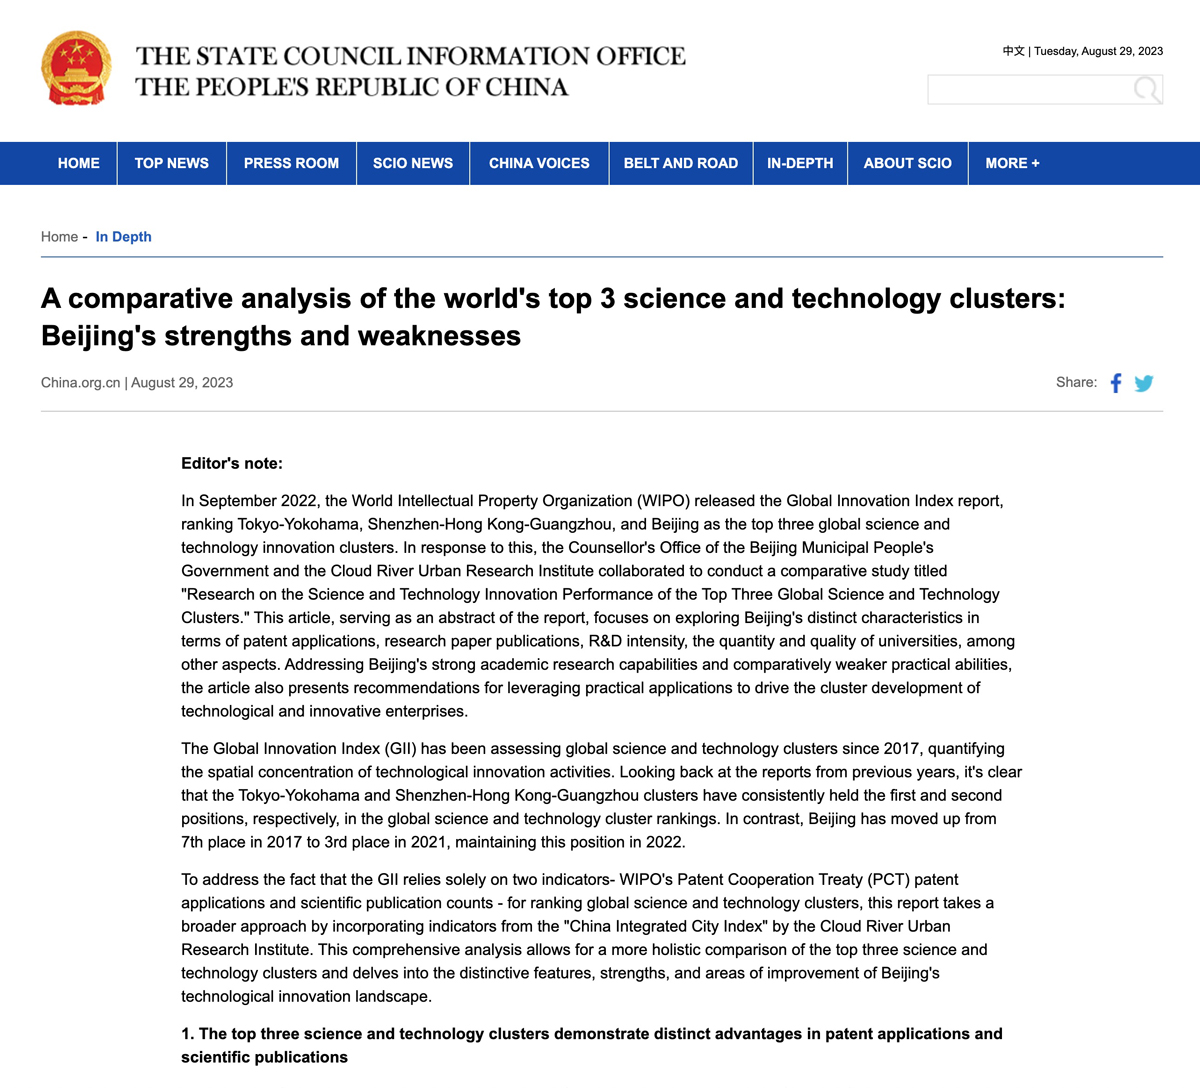
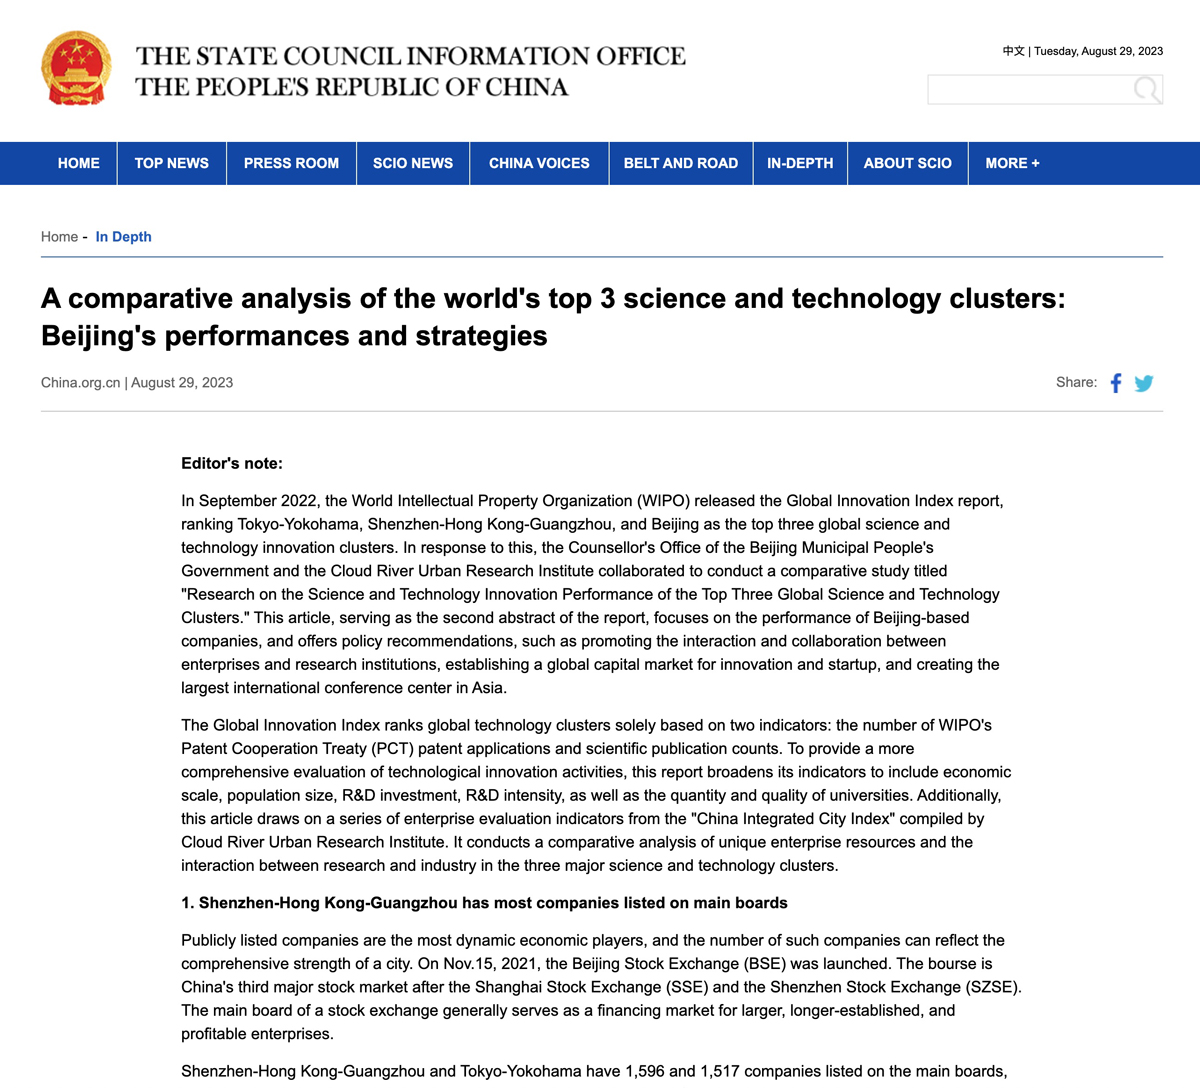
In September 2022, the World Intellectual Property Organization (WIPO) released the Global Innovation Index report, ranking Tokyo-Yokohama, Shenzhen-Hong Kong-Guangzhou, and Beijing as the top three global science and technology innovation clusters. In response to this, the Counsellor’s Office of the Beijing Municipal People’s Government and the Cloud River Urban Research Institute collaborated to conduct a comparative study titled “Research on the Science and Technology Innovation Performance of the Top Three Global Science and Technology Clusters.” This article, serving as the second abstract of the report, focuses on the performance of Beijing-based companies, and offers policy recommendations, such as promoting the interaction and collaboration between enterprises and research institutions, establishing a global capital market for innovation and startup, and creating the largest international conference center in Asia.
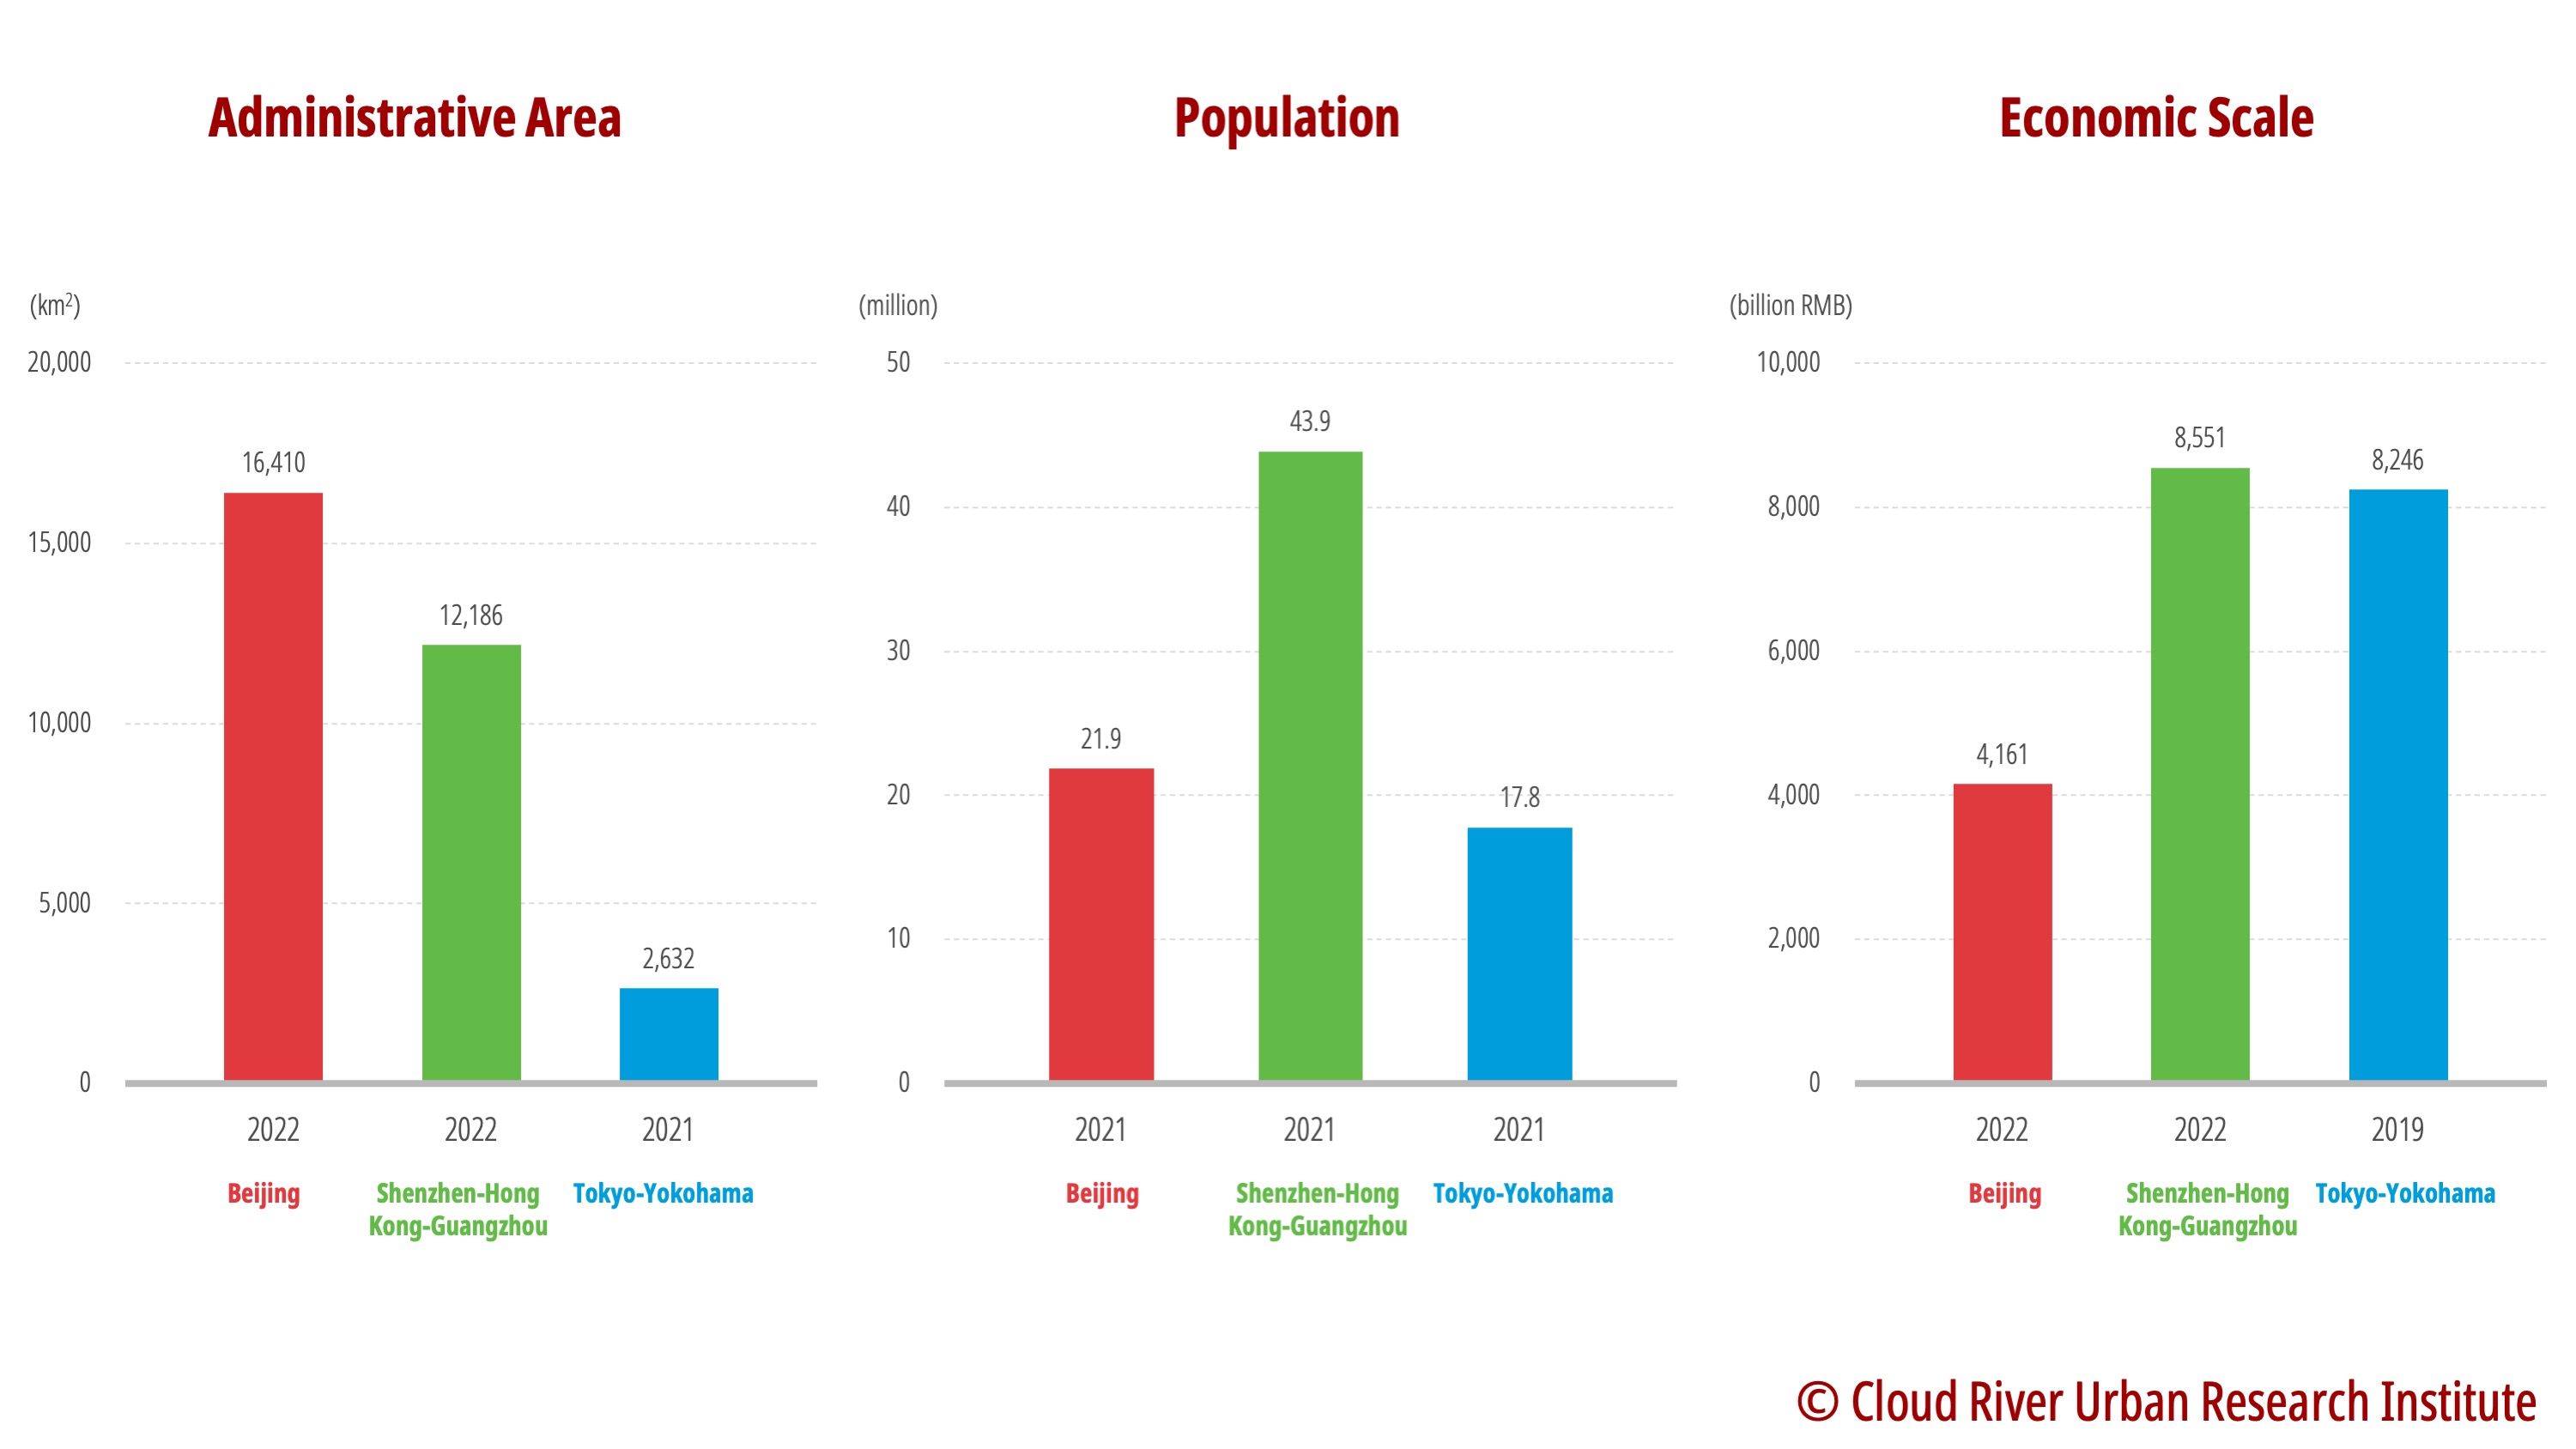
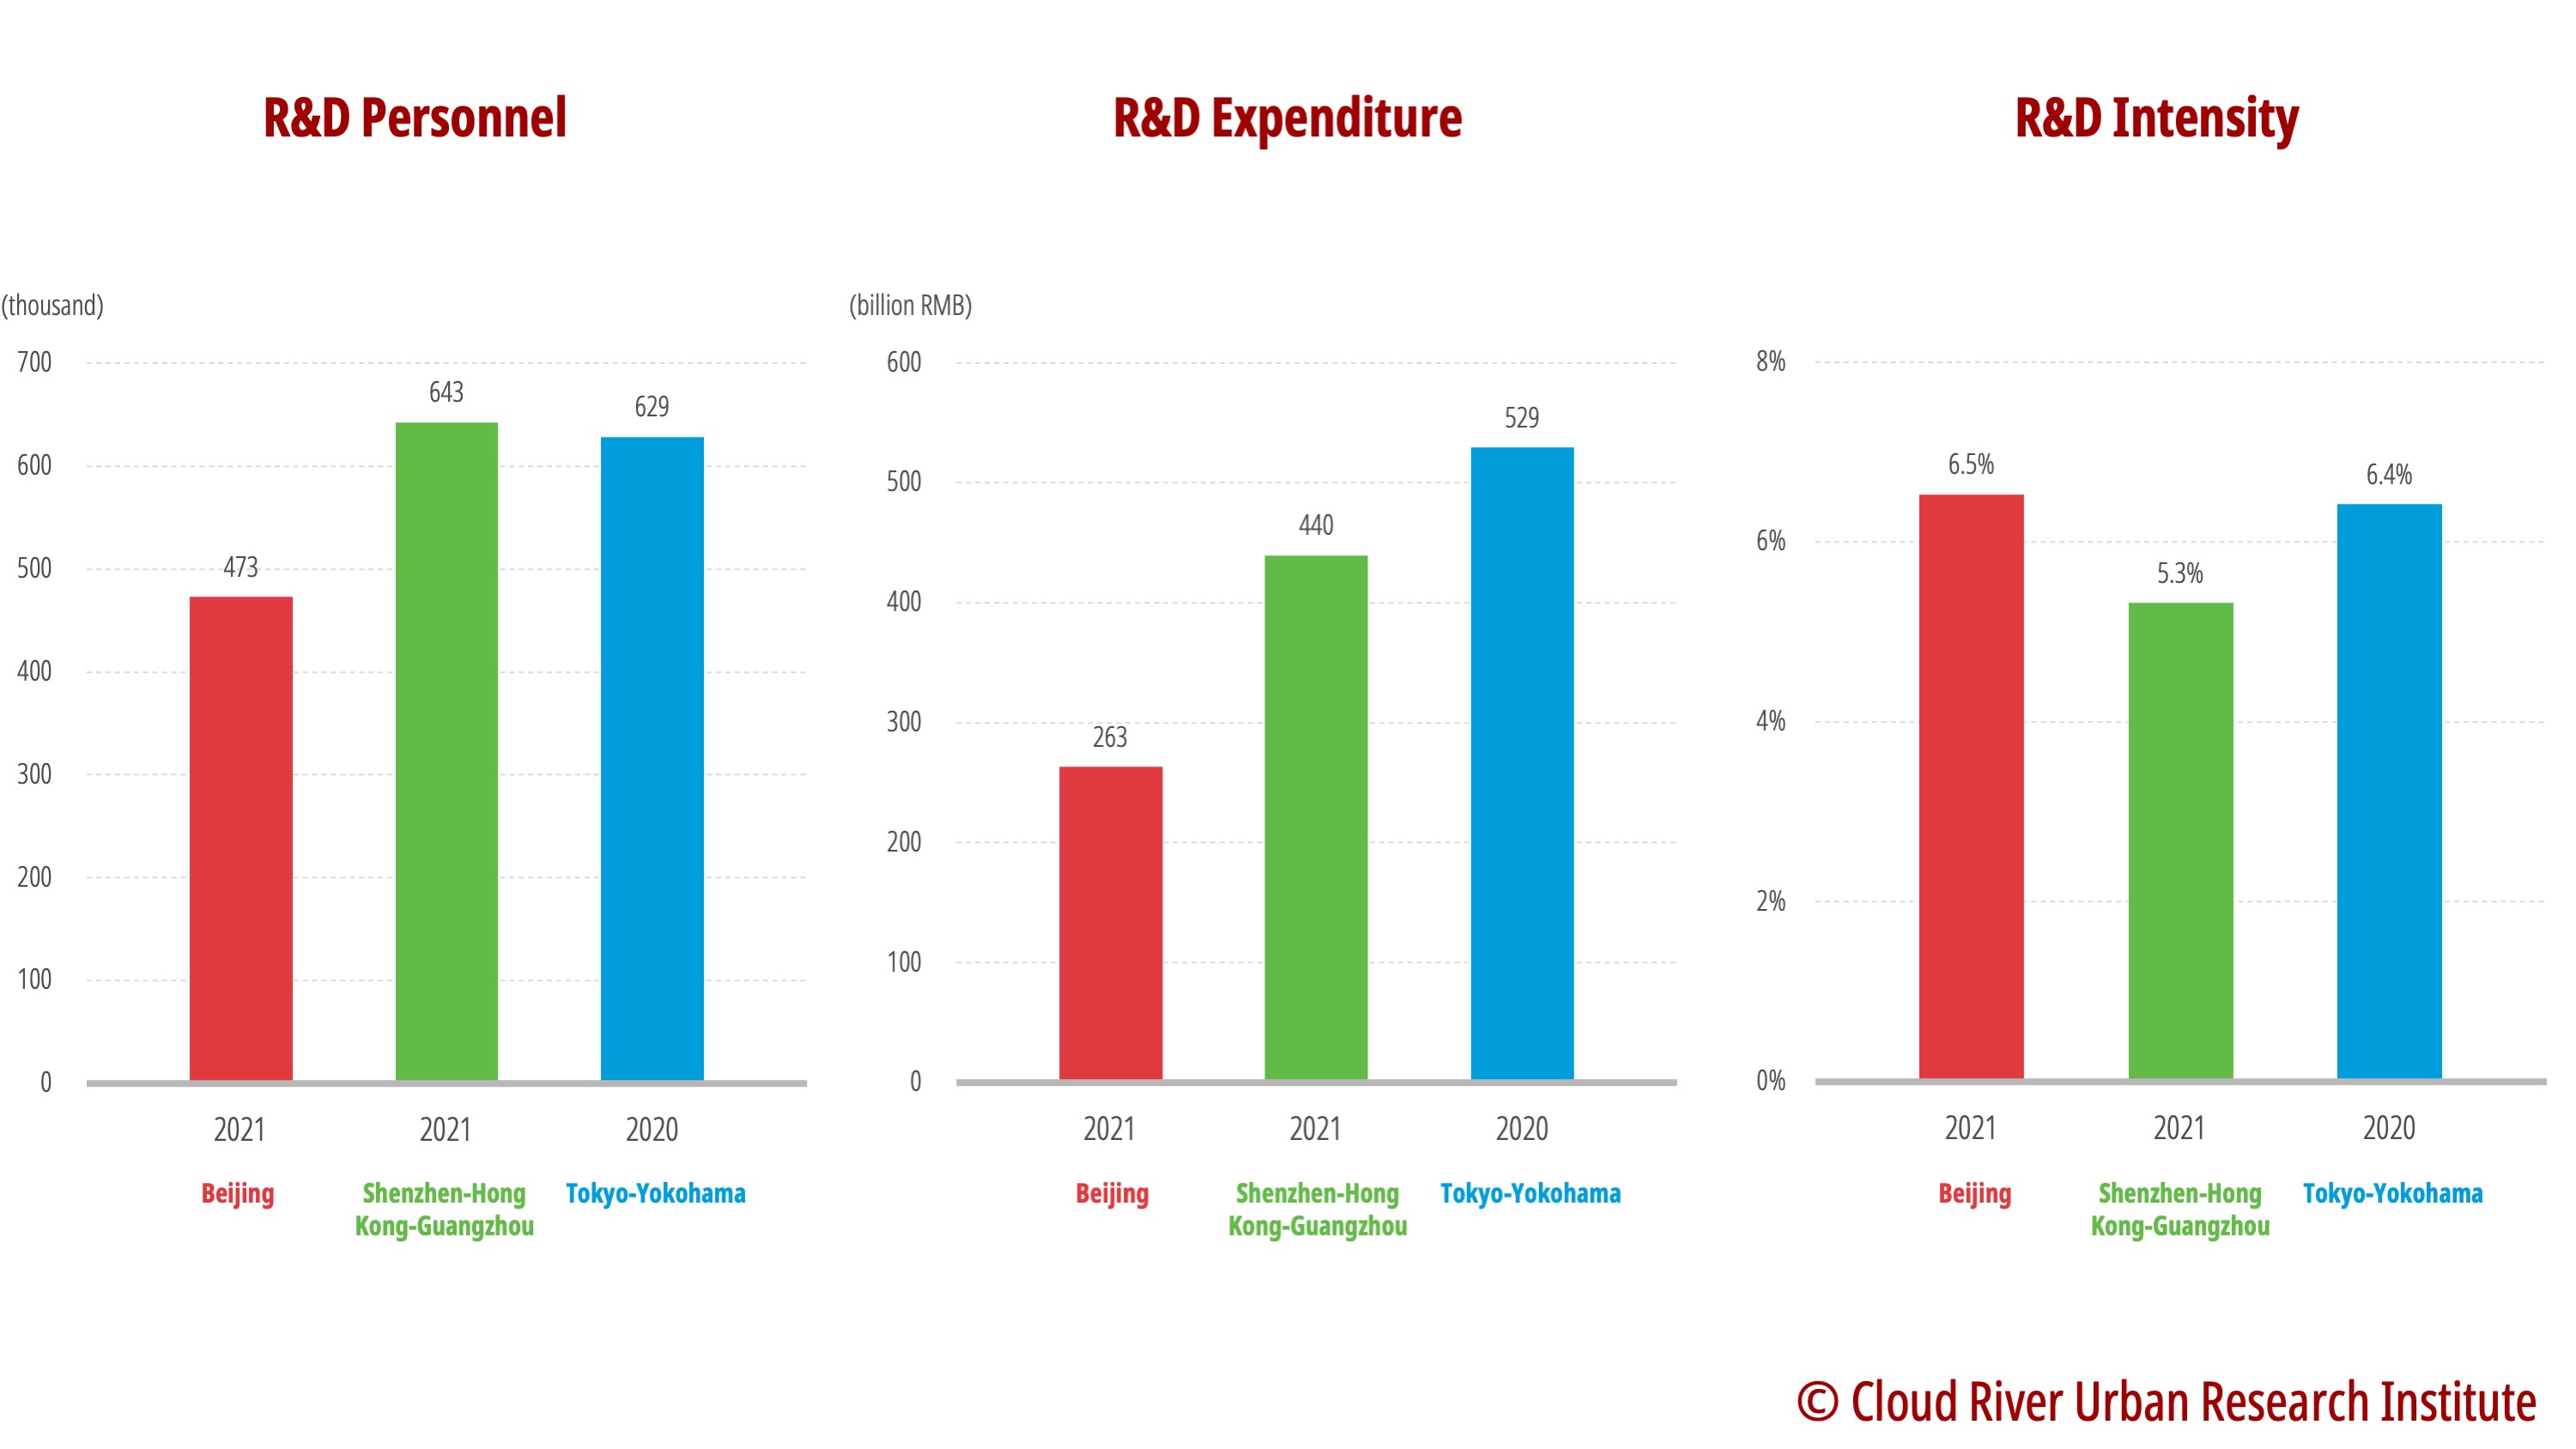
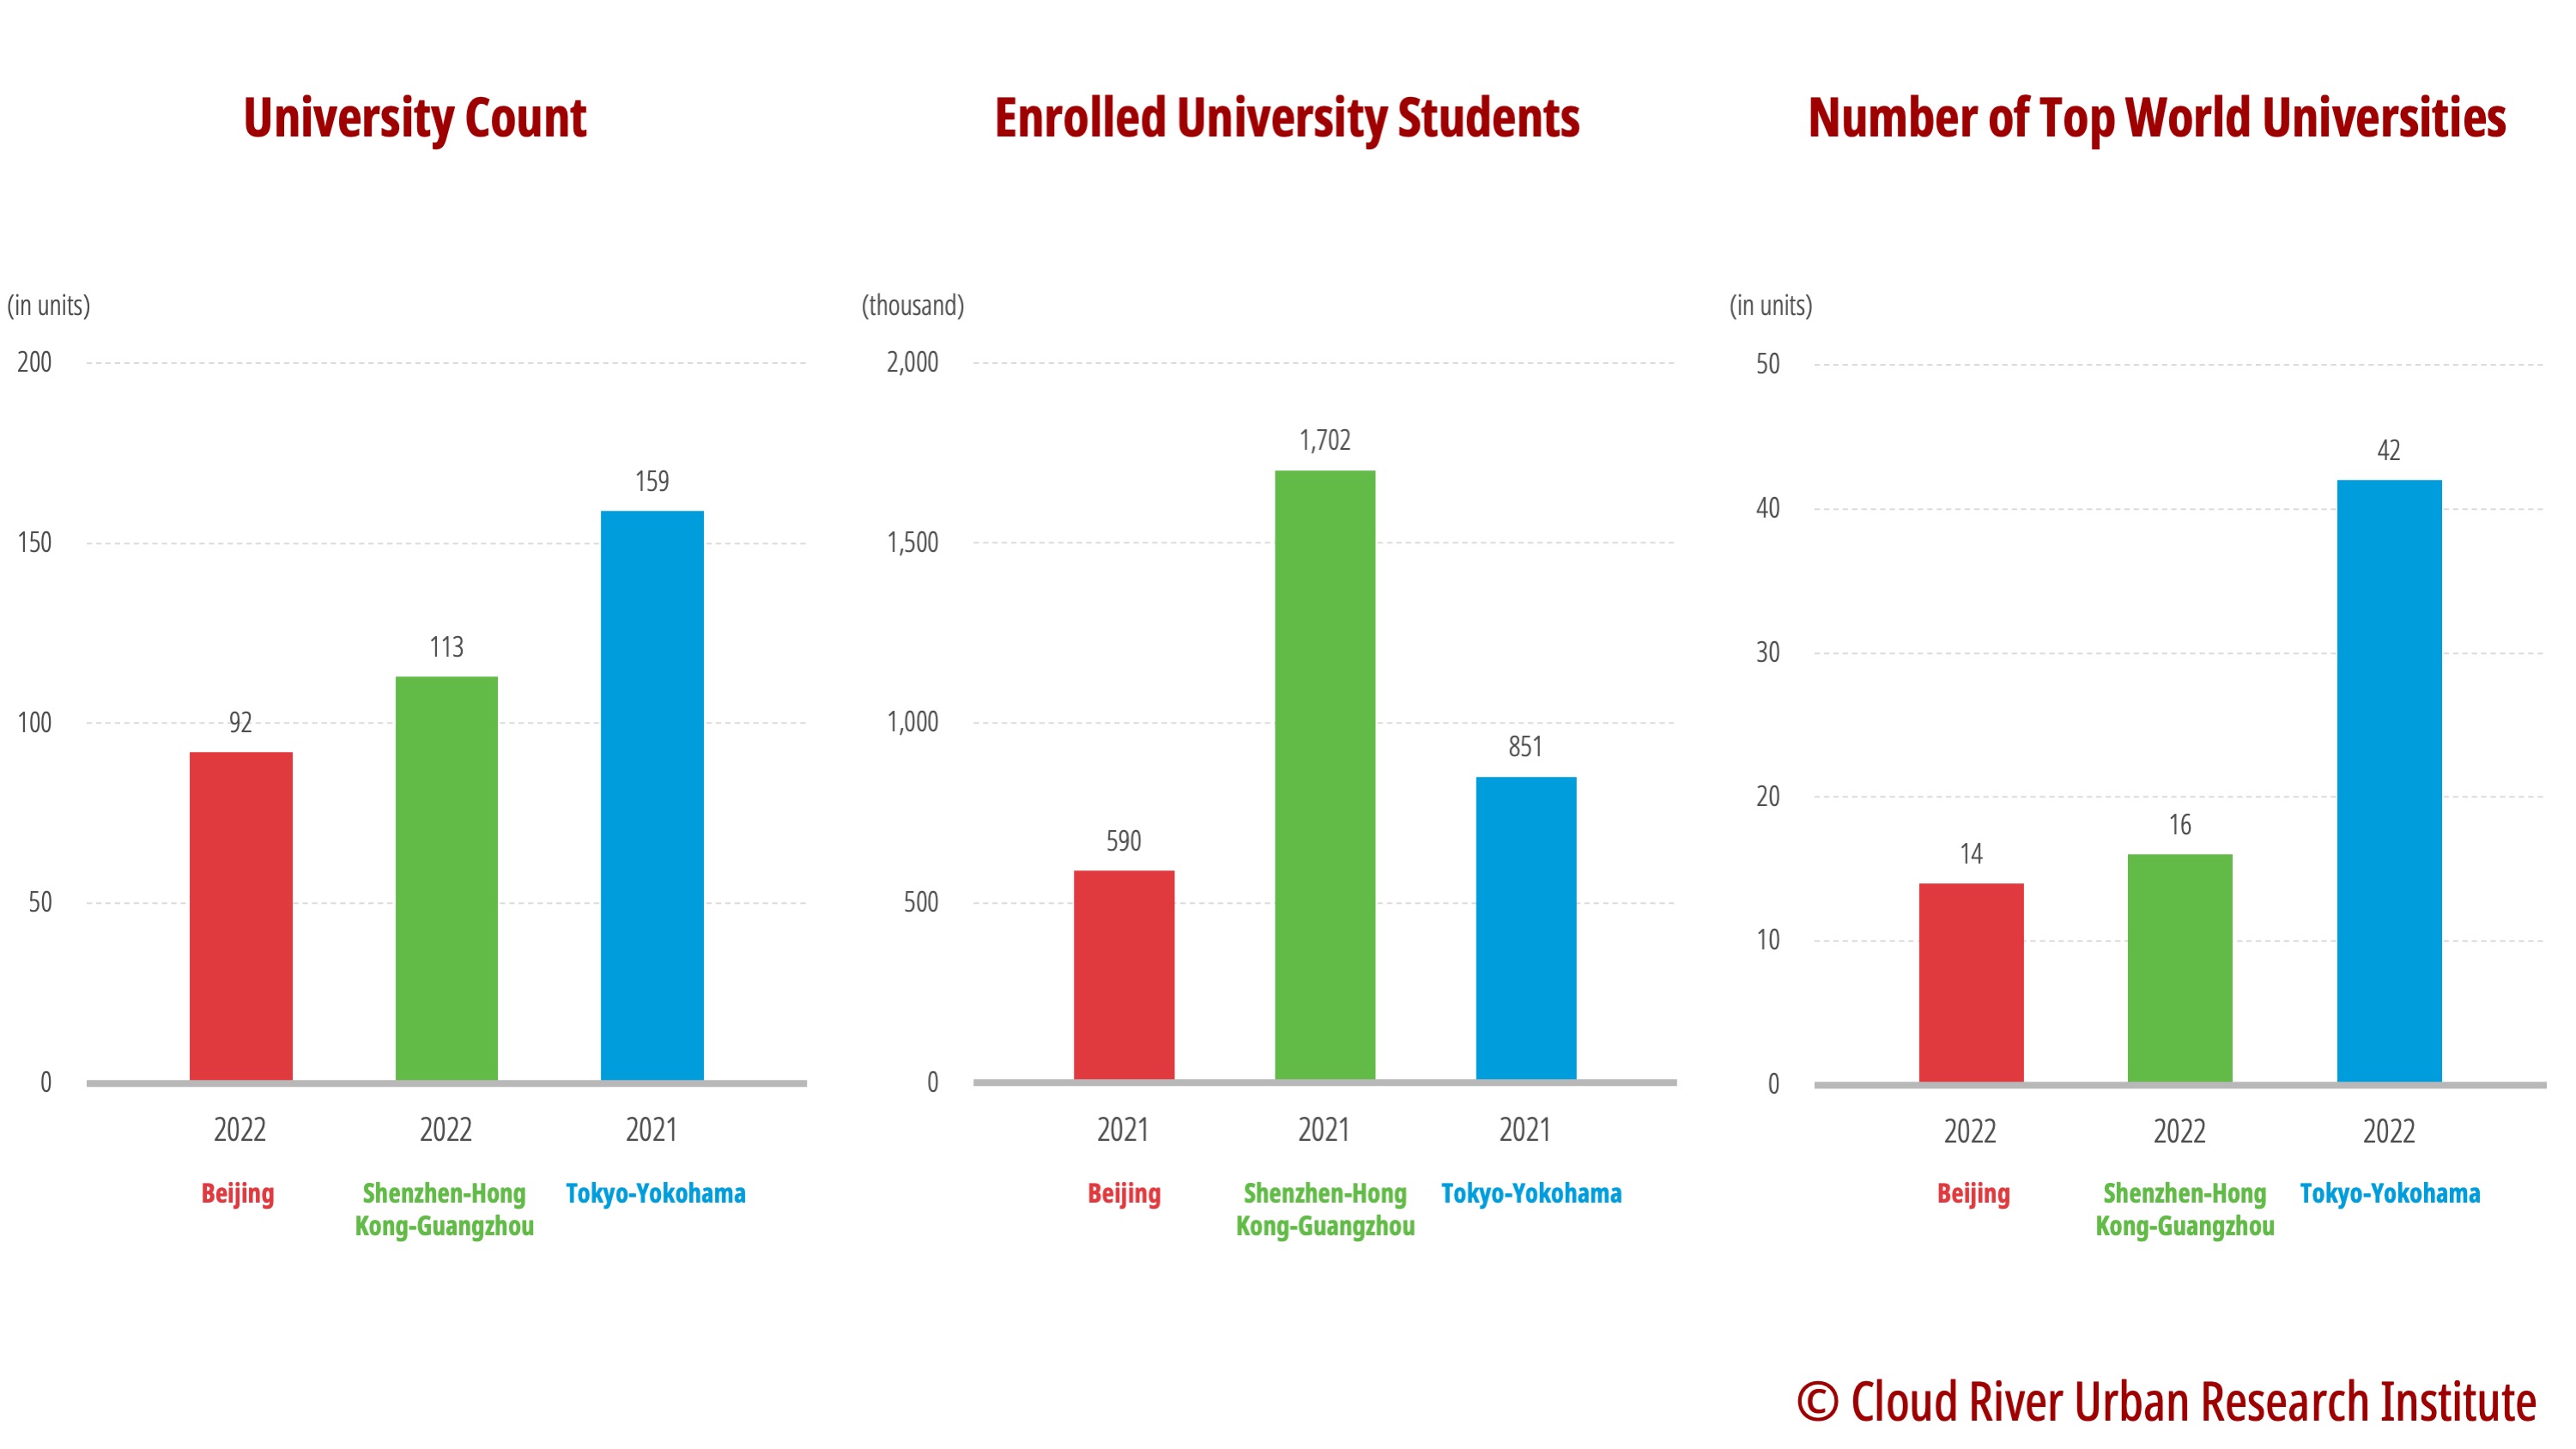
The Global Innovation Index ranks global technology clusters solely based on two indicators: the number of WIPO’s Patent Cooperation Treaty (PCT) patent applications and scientific publication counts. To provide a more comprehensive evaluation of technological innovation activities, this report broadens its indicators to include economic scale, population size, R&D investment, R&D intensity, as well as the quantity and quality of universities. Additionally, this article draws on a series of enterprise evaluation indicators from the “China Integrated City Index” compiled by Cloud River Urban Research Institute. It conducts a comparative analysis of unique enterprise resources and the interaction between research and industry in the three major science and technology clusters.
1. Shenzhen-Hong Kong-Guangzhou has most companies listed on main boards
Publicly listed companies are the most dynamic economic players, and the number of such companies can reflect the comprehensive strength of a city. On Nov.15, 2021, the Beijing Stock Exchange (BSE) was launched. The bourse is China’s third major stock market after the Shanghai Stock Exchange (SSE) and the Shenzhen Stock Exchange (SZSE). The main board of a stock exchange generally serves as a financing market for larger, longer-established, and profitable enterprises.
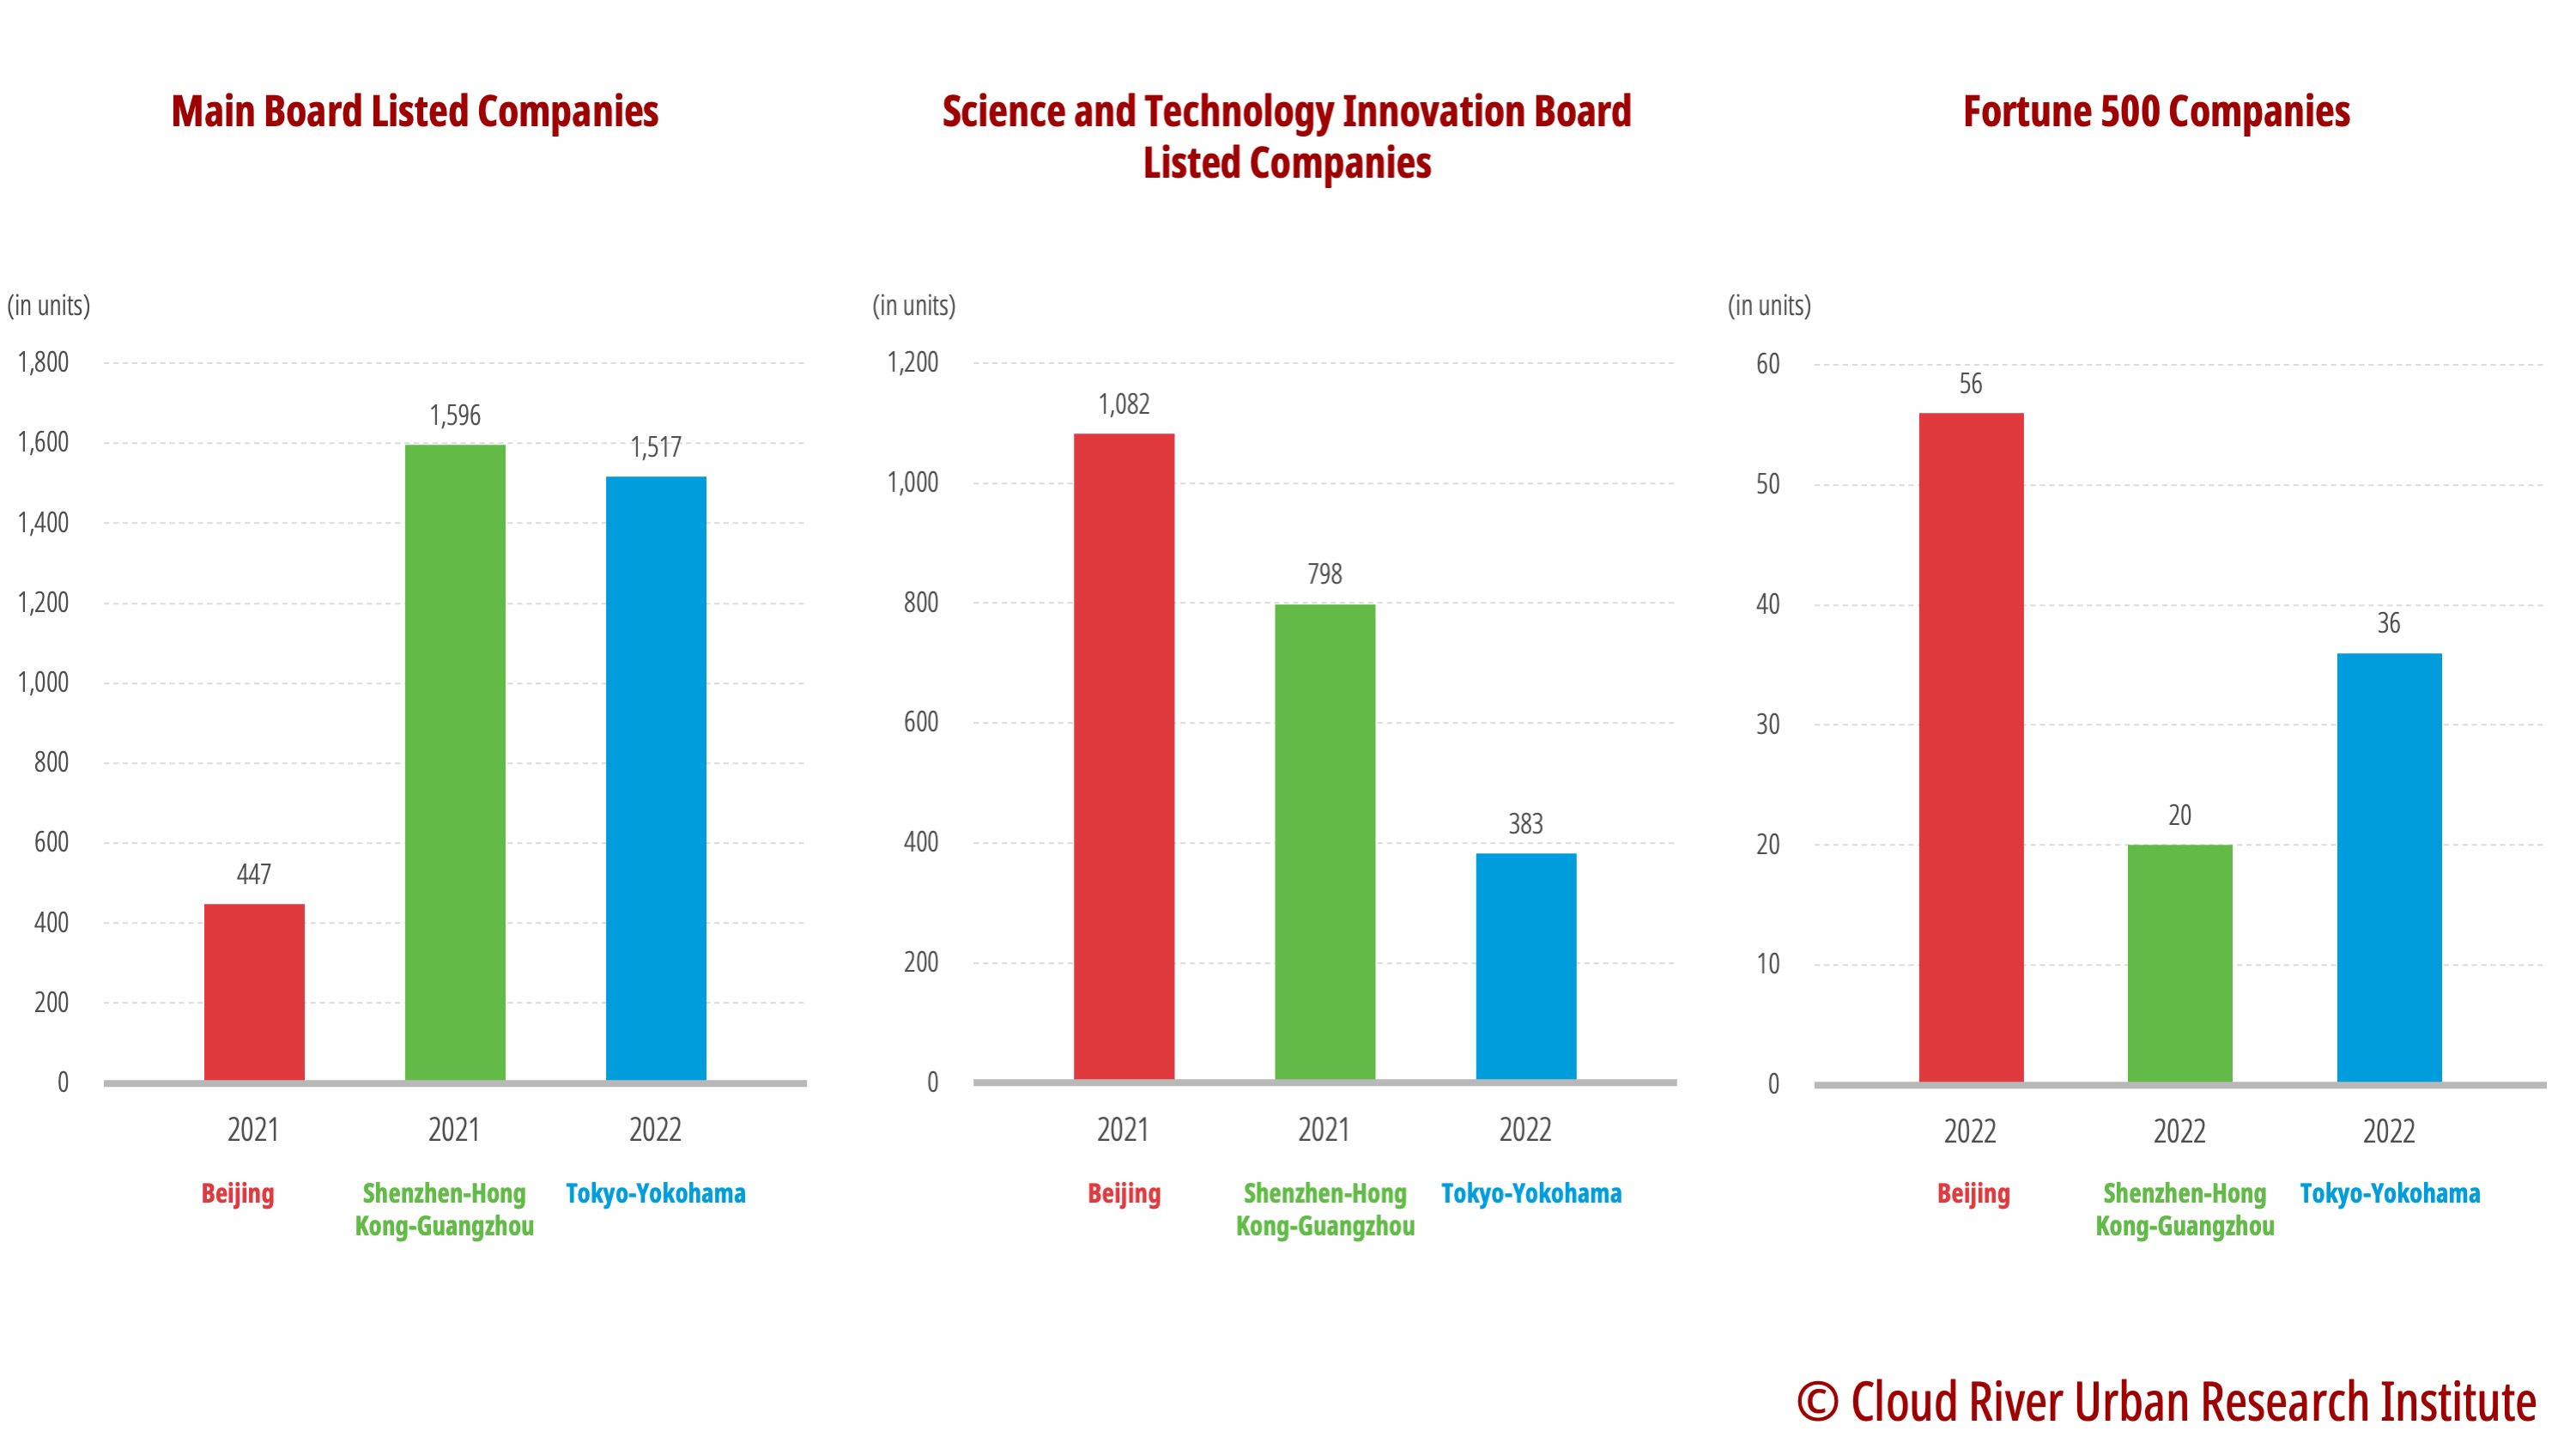
Shenzhen-Hong Kong-Guangzhou and Tokyo-Yokohama have 1,596 and 1,517 companies listed on the main boards, respectively. In comparison, Beijing has only 447 such, only one-third of the number in the other two science and technology clusters.
2. Beijing has more Fortune 500 companies than Shenzhen-Hong Kong-Guangzhou
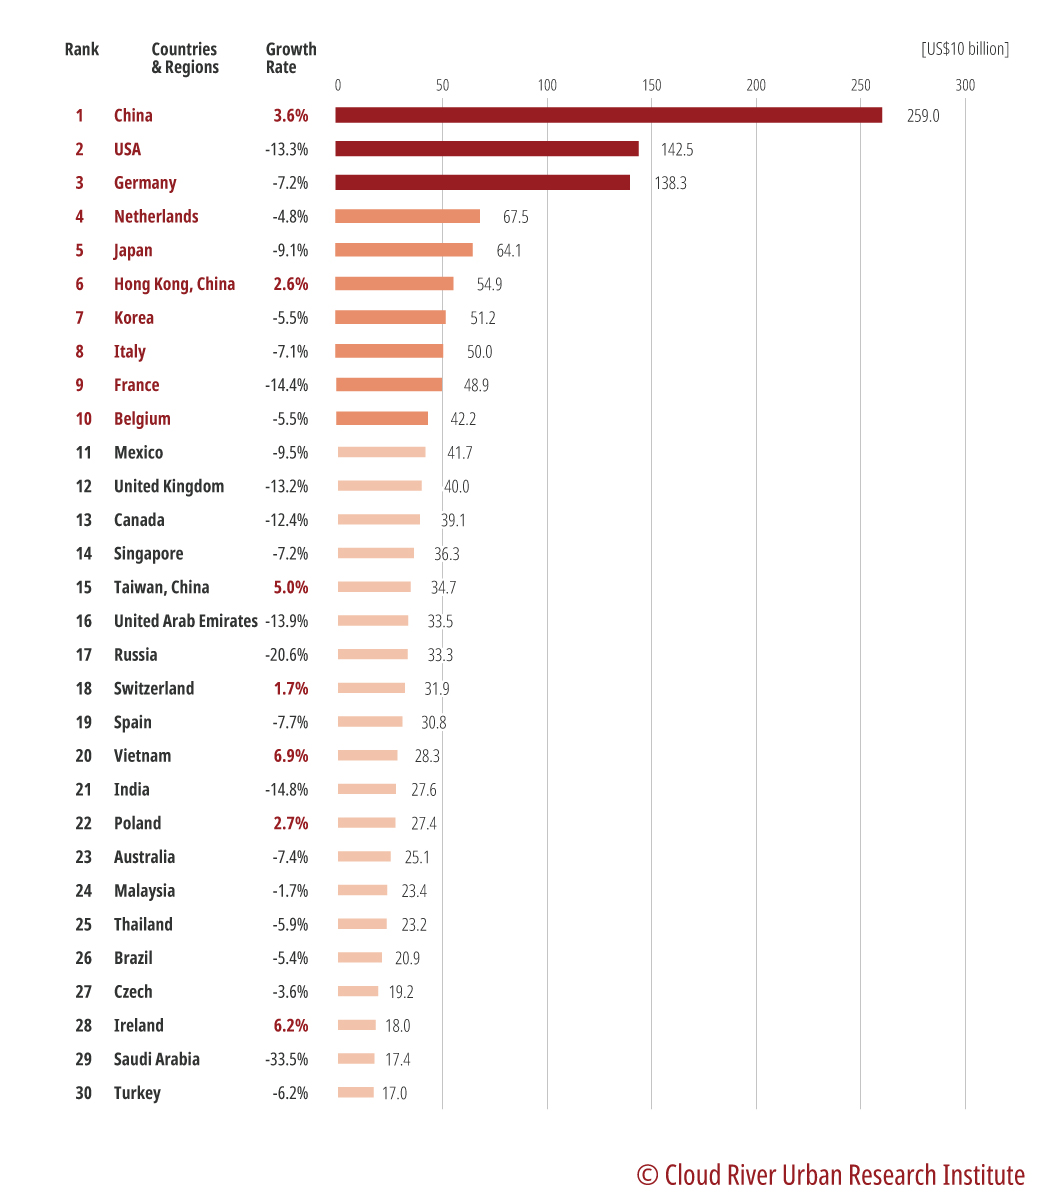
According to the 2022 Fortune Global 500 list, Beijing has 56 Fortune 500 companies, more than the other two clusters. The Shenzhen-Hong Kong-Guangzhou cluster has 20. These two clusters collectively account for half of China’s total Fortune 500 companies (145 companies).
The Tokyo-Yokohama cluster has 36 Fortune 500 companies, making up 77% of Japan’s total (47 companies).
The figures above show that among the three major clusters, Beijing has the fewest number of main board listed companies, but it has the largest number of Fortune 500 companies.

3. Tokyo-Yokohama has most listed innovation-driven companies
The Science and Technology Innovation Board of the Shanghai Stock Exchange (STAR Market), the Growth Enterprise Market (GEM) of the Shenzhen Stock Exchange, and the Mothers Market of the Tokyo Stock Exchange are all primarily financing platforms for innovative enterprises. The Tokyo-Yokohama cluster hosts the largest number of innovation-driven enterprises, with 383. The Shenzhen-Hong Kong-Guangzhou cluster comes second with 210, and Beijing has the fewest, with 169.
Figure. A comparison of three major science and technology clusters in terms of number of main board listed companies, number of innovation-driven listed companies, and number of Fortune 500 companies
4. Number of Beijing’s unicorns 12 times that of Tokyo’s
A unicorn is a privately held startup company with a valuation of $1 billion or more. The number of unicorns reflects a city’s ability to attract venture capital. According to a survey by U.S. data provider CB Insights, in 2022, Beijing had 61 unicorns, while the Shenzhen-Hong Kong-Guangzhou cluster had 30. The two clusters together accounted for 54% of China’s total unicorns (168).
Although the Tokyo-Yokohama cluster had only five unicorns, it represented 83% of Japan’s total (6 companies).
From the above figures, it’s evident that among the three major clusters, Beijing had the fewest number of innovation-driven companies listed on innovation board like the STAR Market, but it had most unicorn companies.
5. Beijing hosts many corporate headquarters, but lags behind in R&D expenditure
Beijing accommodates many headquarters of large enterprises, constituting a feature of the Chinese economic landscape. Beijing is home to the largest number of Fortune 500 companies in China and over half of headquarters of China’s centrally-administered state-owned enterprises. However, the R&D investment by the corporate headquarters in Beijing is relatively low.
According to data from the Beijing Municipal Bureau of Statistics, in 2021, among Beijing’s R&D expenditure, 43.2% was for enterprises, 43.6% for government-backed research institutions, and 11.1% for higher education institutions. At the national average level, 76.9% of R&D expenditure went to enterprises, 13.3% government-backed research institutions, and 7.8% higher education institutions. Compared to the national average, a bigger portion of Beijing’s R&D expenditure was channeled to government-backed research institutions and higher education institutions, rather than enterprises.
According to the Global Innovation Index report, in 2021, 13 Chinese companies made their way into the top 50 in the international PCT patent applicant ranking. Among them, Shenzhen had 7 companies, whereas Beijing had only three. It’s intriguing to note that despite Beijing’s appeal to corporate headquarters, the Chinese capital is eclipsed by Shenzhen in the PCT applicant ranking.
Chinese technology giant Huawei has obtained its top position among Chinese companies in the global PCT applicant ranking for five consecutive years. Shenzhen-based companies such as Huawei, ZTE, DJI, and Tencent, are not only big R&D spenders, but also good at commercializing research outcomes. Driven by these enterprises, the Shenzhen-Hong Kong-Guangzhou cluster races ahead in practical science research activities and sees strong interactivity among companies, which significantly propels technological innovation in the region.

6. Drive R&D capabilities of corporate headquarters through policy incentives, facilitate collaboration between enterprises and research institutions
Japan’s experience in promoting collaboration between industry, academia, and government is something that we should look into. The Japanese government takes policy-driven efforts to facilitate cooperation between industry, academia, and government in R&D in crucial sectors. Such efforts are to foster a collaborative R&D framework where businesses and research institutions work together synergistically. This approach not only helps to form a robust “national team” collectively but also allows research outcomes funded by the government to be shared with enterprises, thereby enhancing the overall strength and capabilities of Japanese companies in this field.
Let’s take the development of hydrogen energy in Tokyo as an example. Tokyo has not only actively collaborated with the National Hydrogen Energy Research Base located in Fukushima Prefecture, but also jointly established the “Tokyo Hydrogen Promotion Group” with over 100 organizations including local district governments, universities, associations, and businesses in the city. This initiative aims to strengthen collaboration between industry, academia, and government. While promoting the widespread adoption of hydrogen energy, it also facilitates the cluster-based development of hydrogen-related enterprises.
We suggest that Beijing should mull over measures such as tax adjustments and R&D funding to enhance the exploitation of research outcomes and further drive the development of technological innovation. On the one hand, Beijing should encourage corporate headquarters located in Beijing to enhance their R&D capabilities through policy incentives. On the other hand, the city should promote collaboration and interaction between companies, research institutions, and universities.
7. Establish BSE and ‘New Third Board’ as global capital market for innovation and startup
Among the three major clusters, Beijing has the fewest number of main board-listed companies and innovation-driven listed companies. One of the reasons for this is that Beijing did not have a securities exchange market in the past, while Shenzhen, Hong Kong, and Tokyo all have stock exchanges. The Chinese old saying – “Proximity to water gives an earlier view of the moon” – underscores the significance of capital markets in facilitating enterprise development, and this role should not be underestimated.
Beijing’s top ranking in the number of unicorn enterprises reflects its capacity to attract venture capital. The development of Beijing’s capital market will provide even more opportunities for innovation-driven companies.
Since the establishment of the BSE over a year ago, small and medium-sized enterprises (SMEs) have accounted for 93% of the companies listed on the bourse, while private enterprises have made up 92%. Over 80% of the listed companies are engaged in the strategic emerging industries and advanced manufacturing sectors. The BSE is emerging as a crucial driving force for innovative development in Beijing.
The National Equities Exchange and Quotations (NEEQ), also known as the “New Third Board,” is positioned as a steppingstone for small and promising enterprises to the BSE. Many companies listed on the BSE originated from the NEEQ. By 2022, the NEEQ hosted trading of 6,580 companies with a combined market value of 2.1 trillion yuan, building up a sizable reservoir of companies poised to go public. There were 913 NEEQ-listed companies, 50% more than the combined total of Guangzhou, Shenzhen, and Hong Kong.
We recommend that Beijing should further emphasize the role of the capital market and embrace more inclusiveness and flexibility, and it should effectively utilize the resources from the NEEQ and respect the growth patterns of innovative SMEs. By doing so, the BSE can be developed into the premier financing market for SMEs.
Moreover, Beijing should foster an ecosystem around the BSE consisting of venture capital firms, securities companies, law firms, and other entities dedicated to nurturing the growth of SMEs. This ecosystem will create a high-quality professional service environment, better equipped to support the development and innovation of SMEs.
The BSE can be a complement to stock markets in Shanghai, Shenzhen, and Hong Kong. Positioned to serve innovative SMEs, the BSE can act as a platform to address their financial woes.
We also suggest that Beijing should consider including countries and regions along the Belt and Road route into its capital market and professional services as soon as possible. This will help establish Beijing as an international platform for the development of SMEs.
8. Build largest international conference center in Asia by further opening up
The exchange-based economy, epitomized by the IT industry, has been a potent engine for the innovation and development of cities. Currently, among the top 10 global companies by market value, seven are IT enterprises.
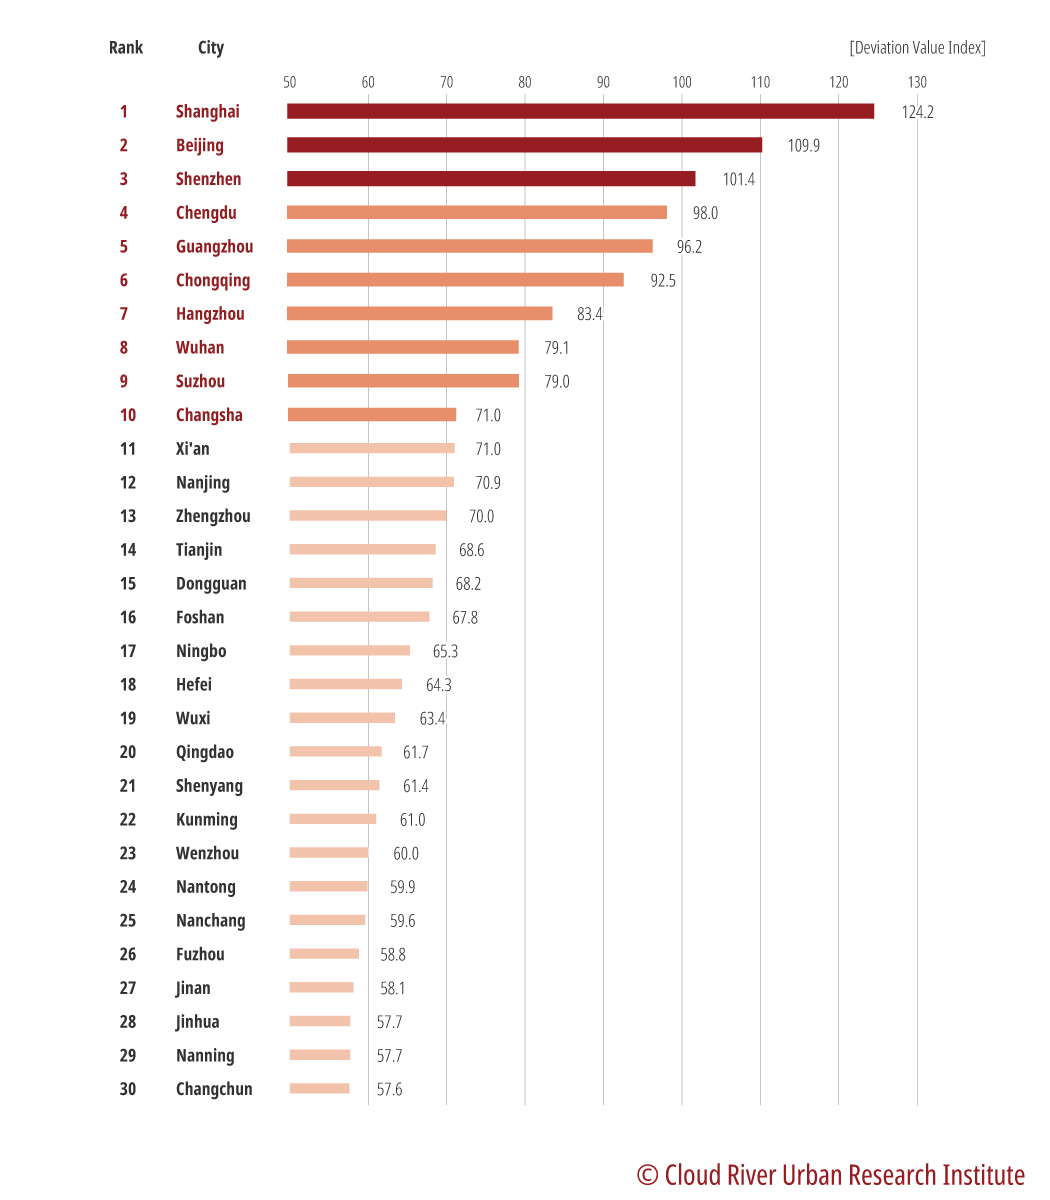
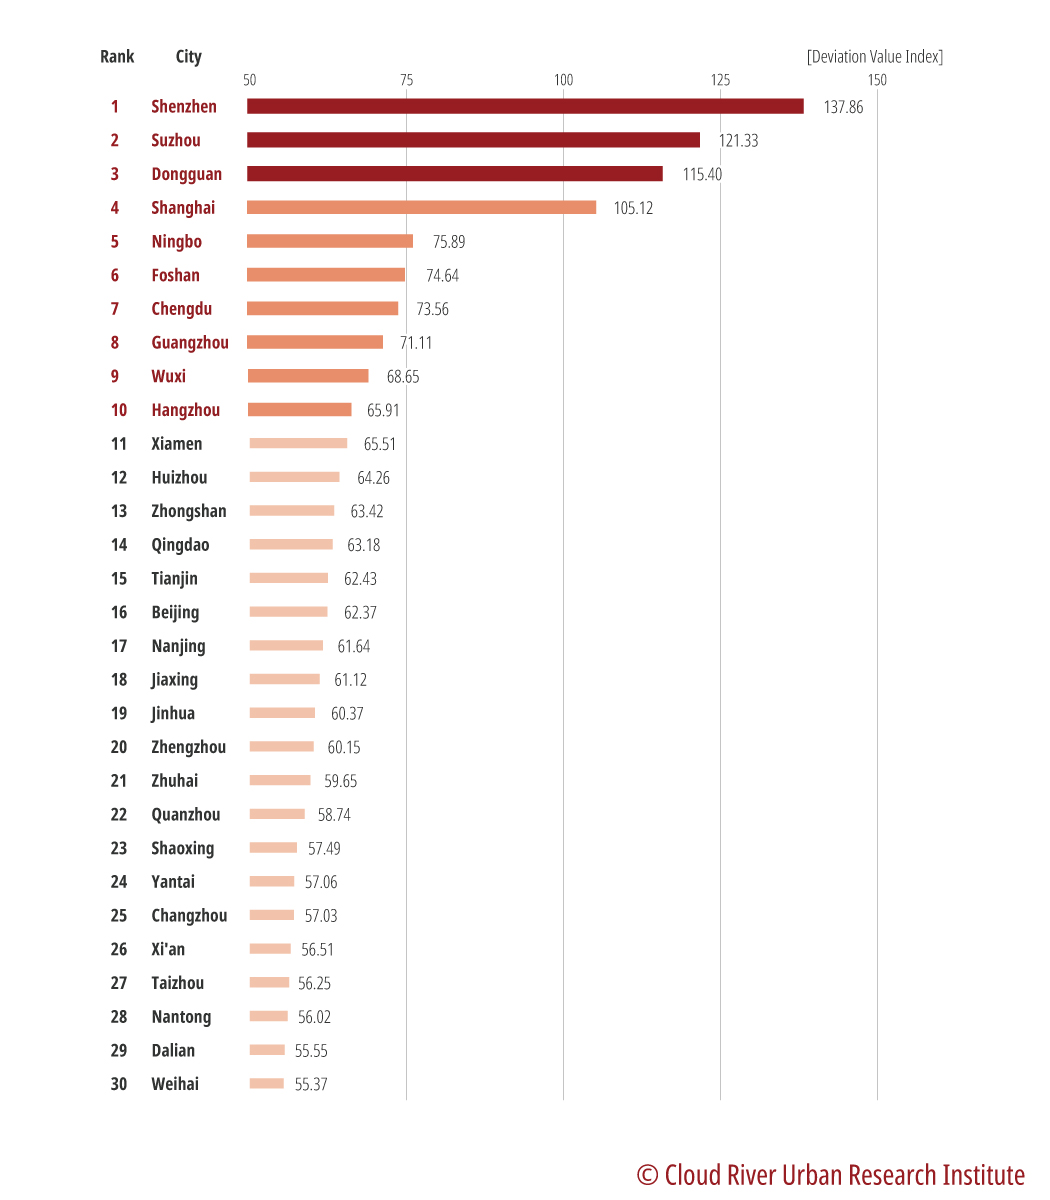
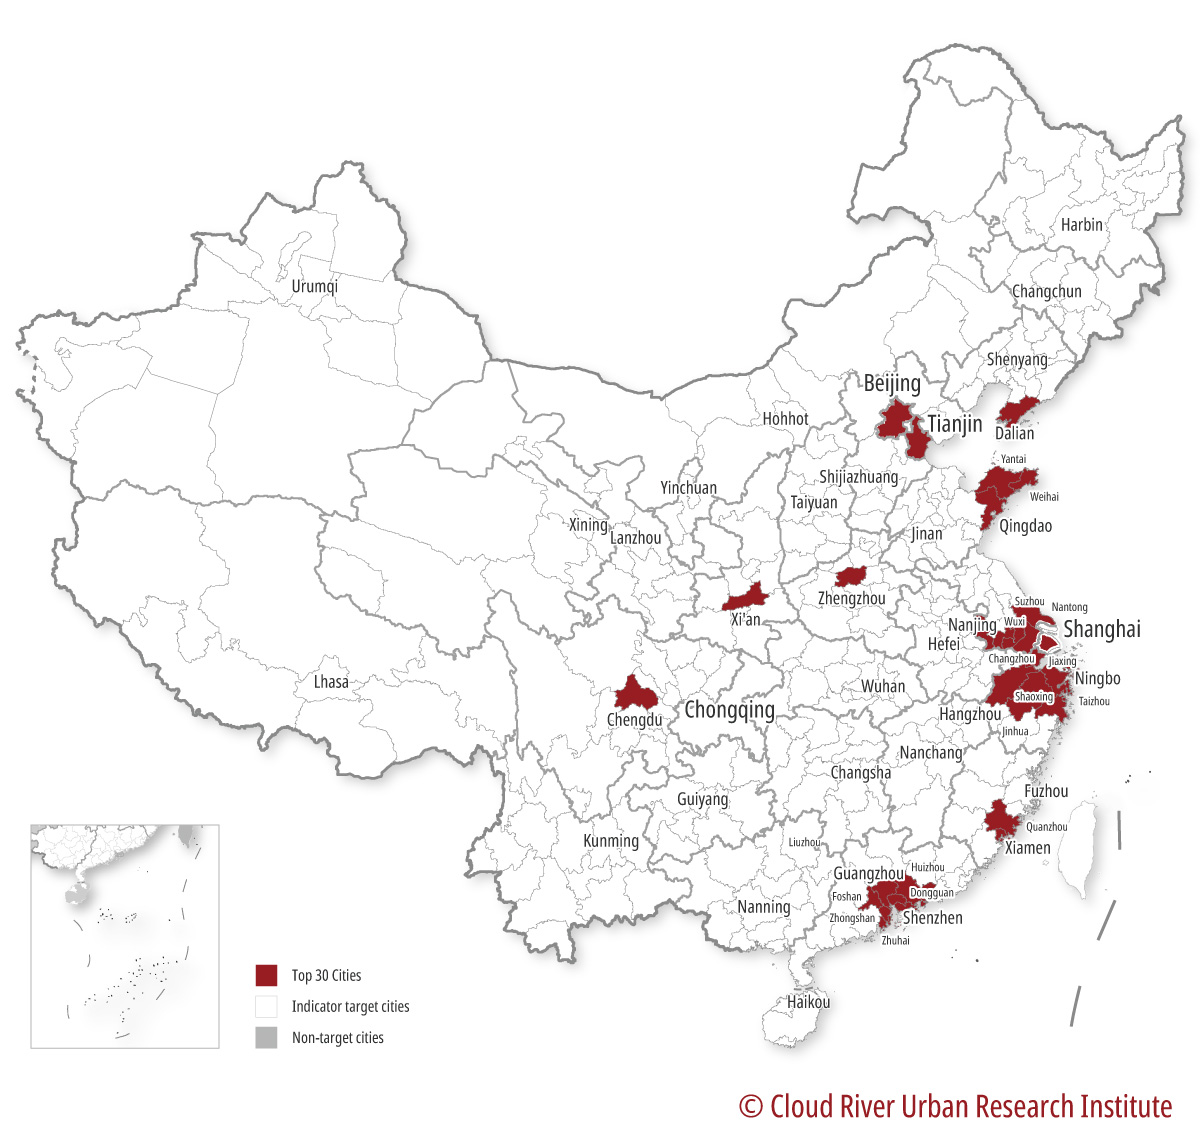
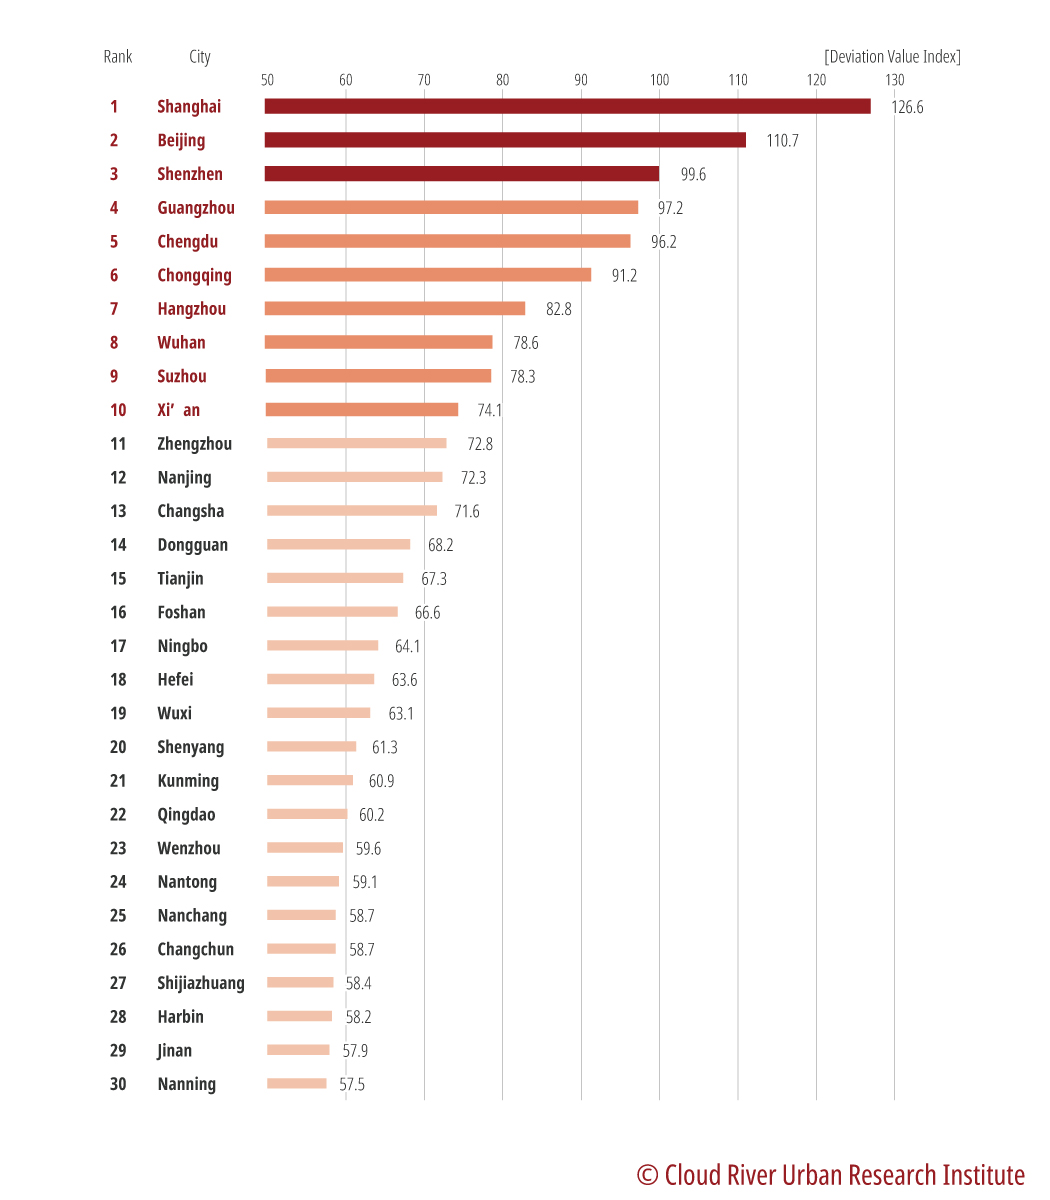
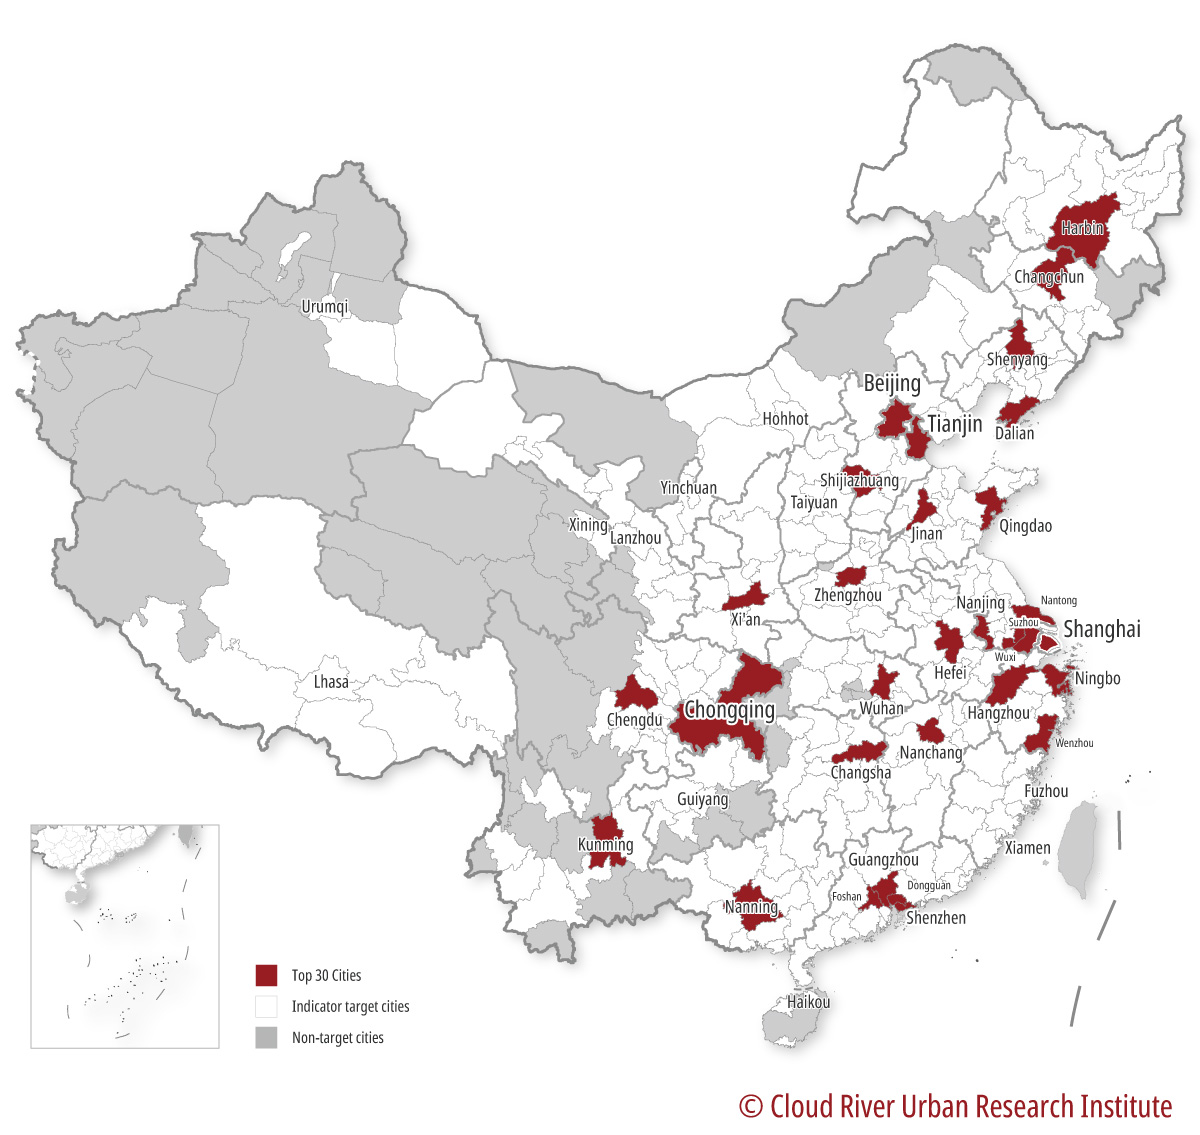
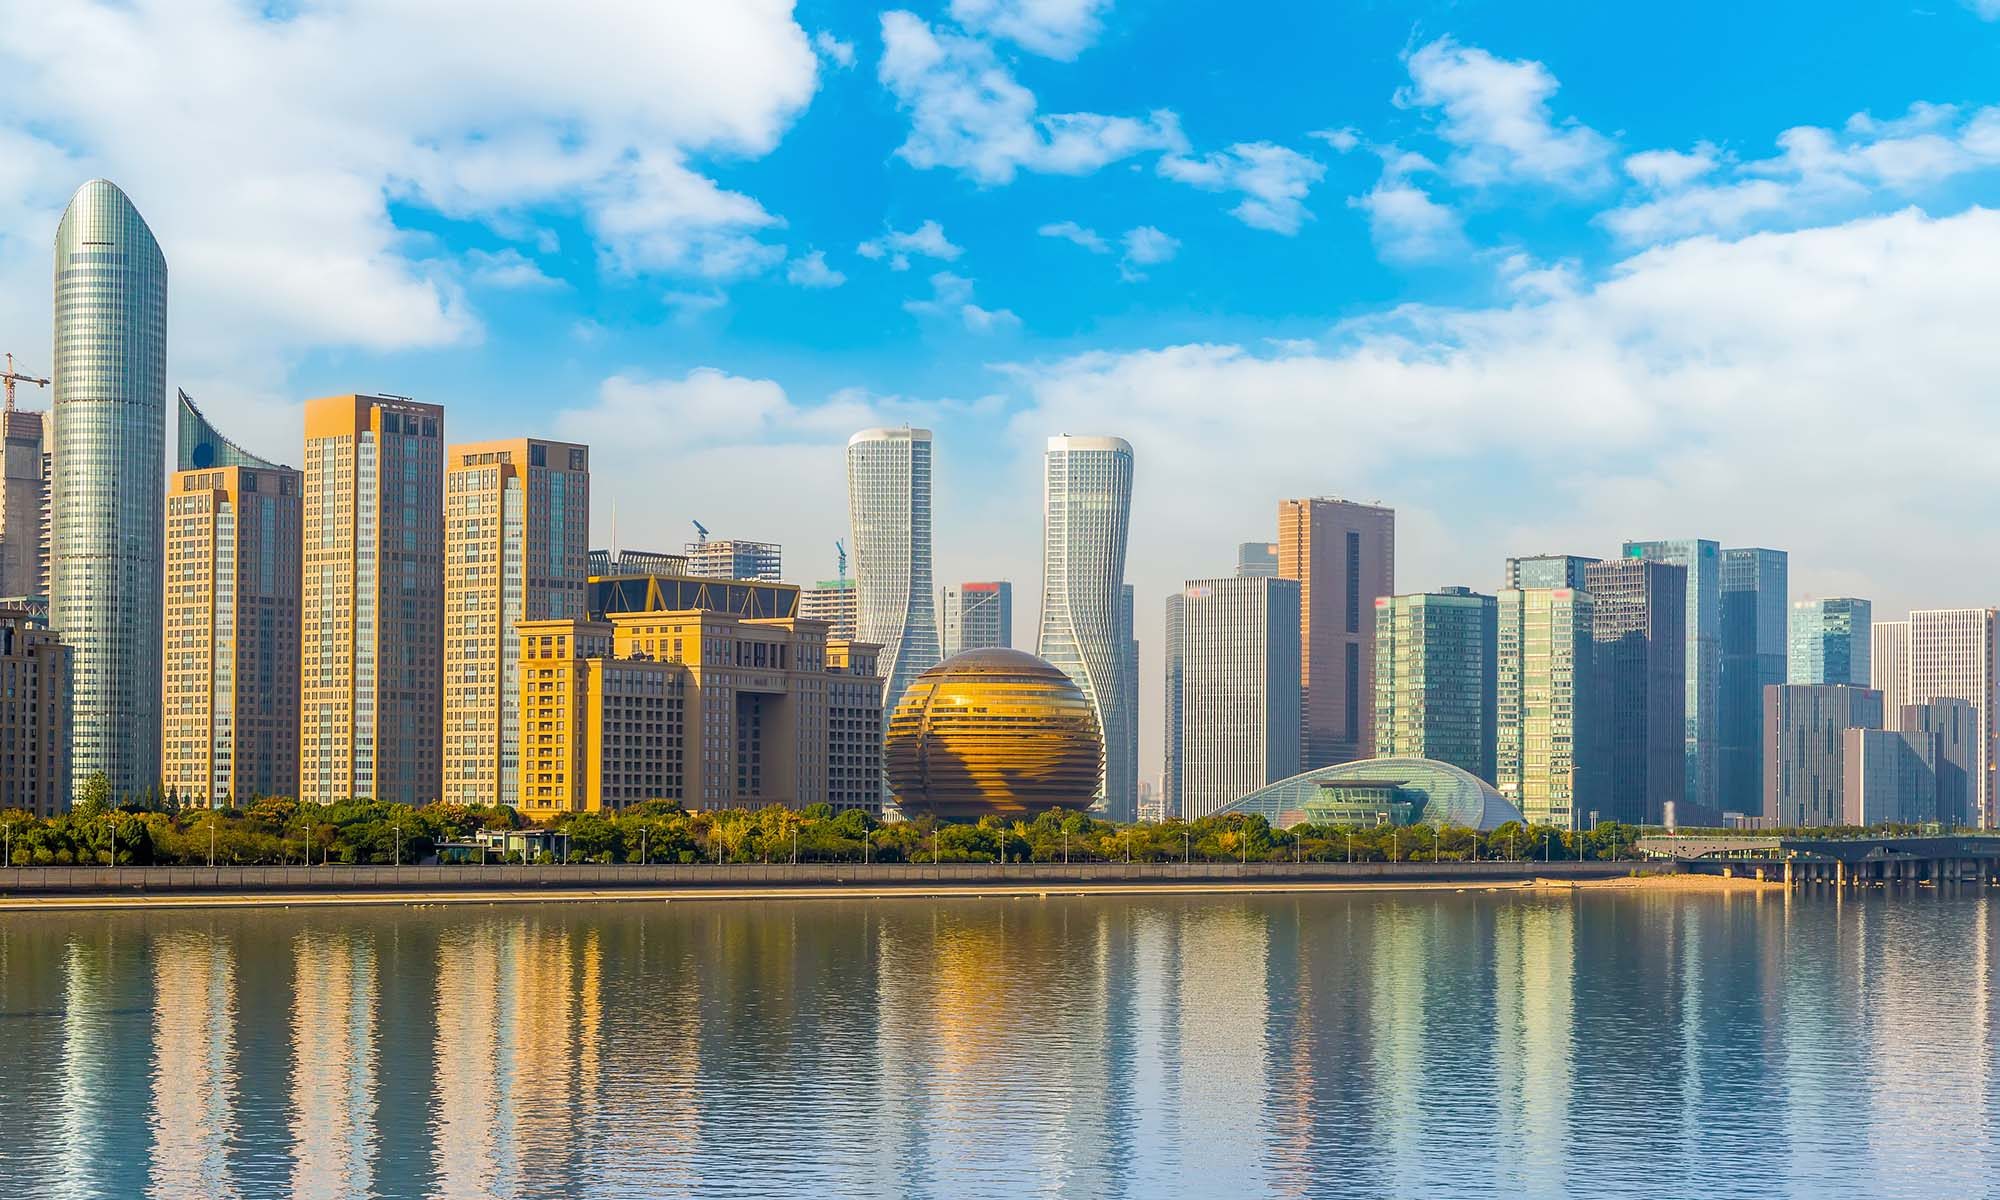
According to the IT industry’s strength ranking in the China Integrated City Index compiled by Cloud River Urban Research Institute, the top 10 cities are Beijing, Shanghai, Shenzhen, Hangzhou, Guangzhou, Chengdu, Nanjing, Chongqing, Fuzhou, and Wuhan.
Ahead of the pack in the IT sector, Beijing accommodates 19% of the national IT workforce, 28.7% of IT companies listed on the main board, 26.4% of IT companies listed on the SME board, and 26.4% of IT companies listed on the GEM.
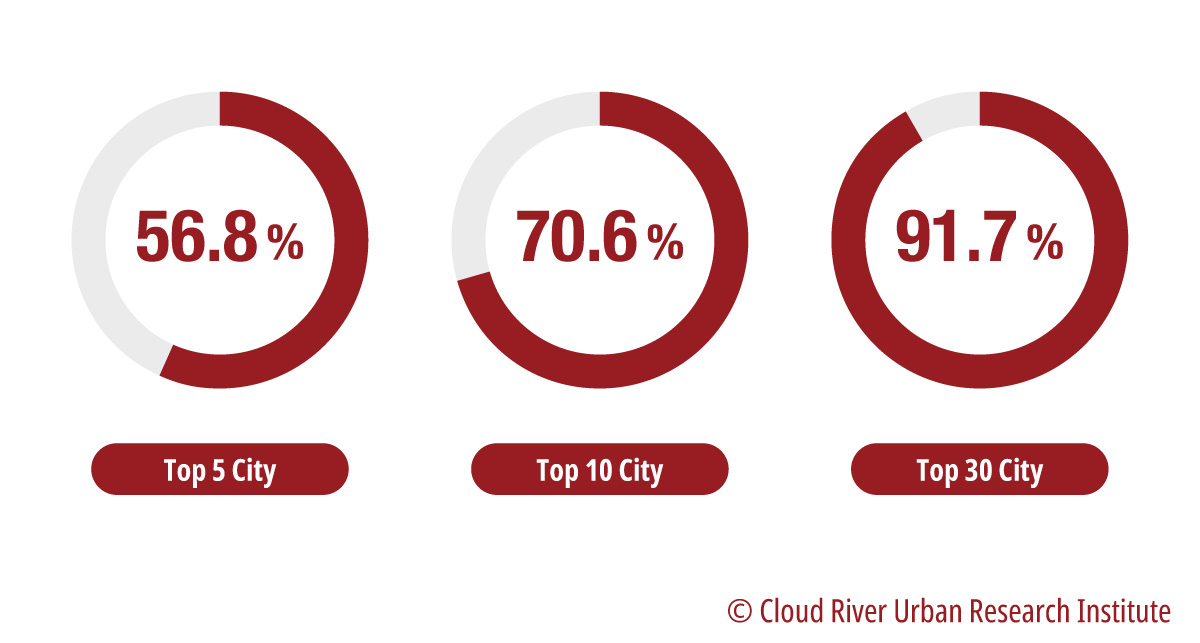
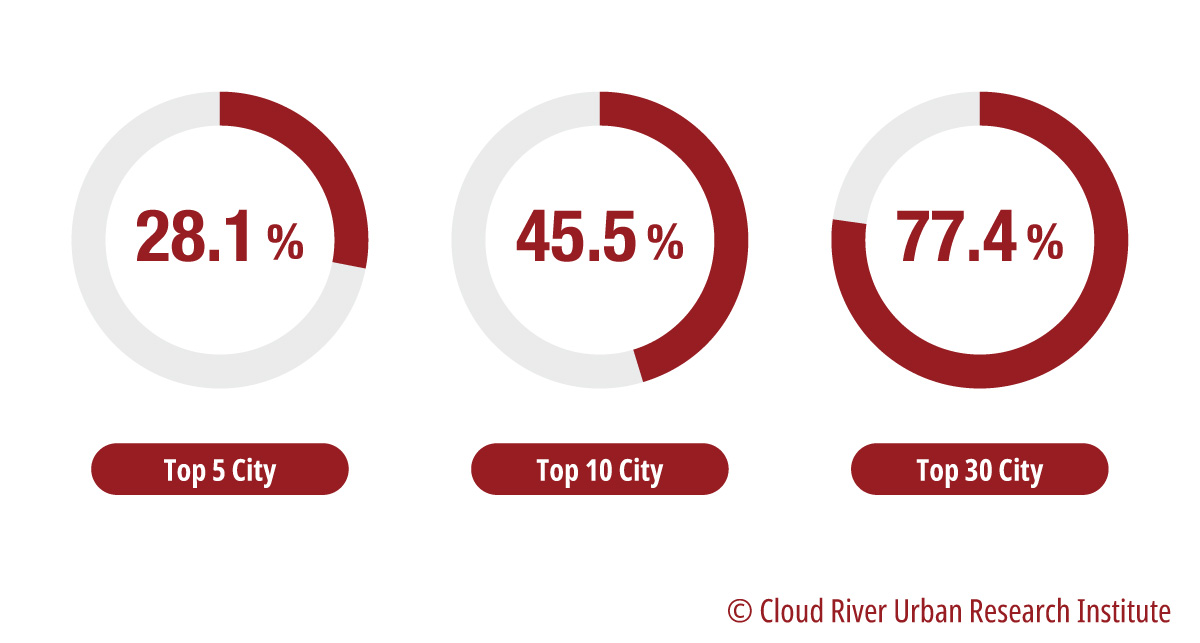
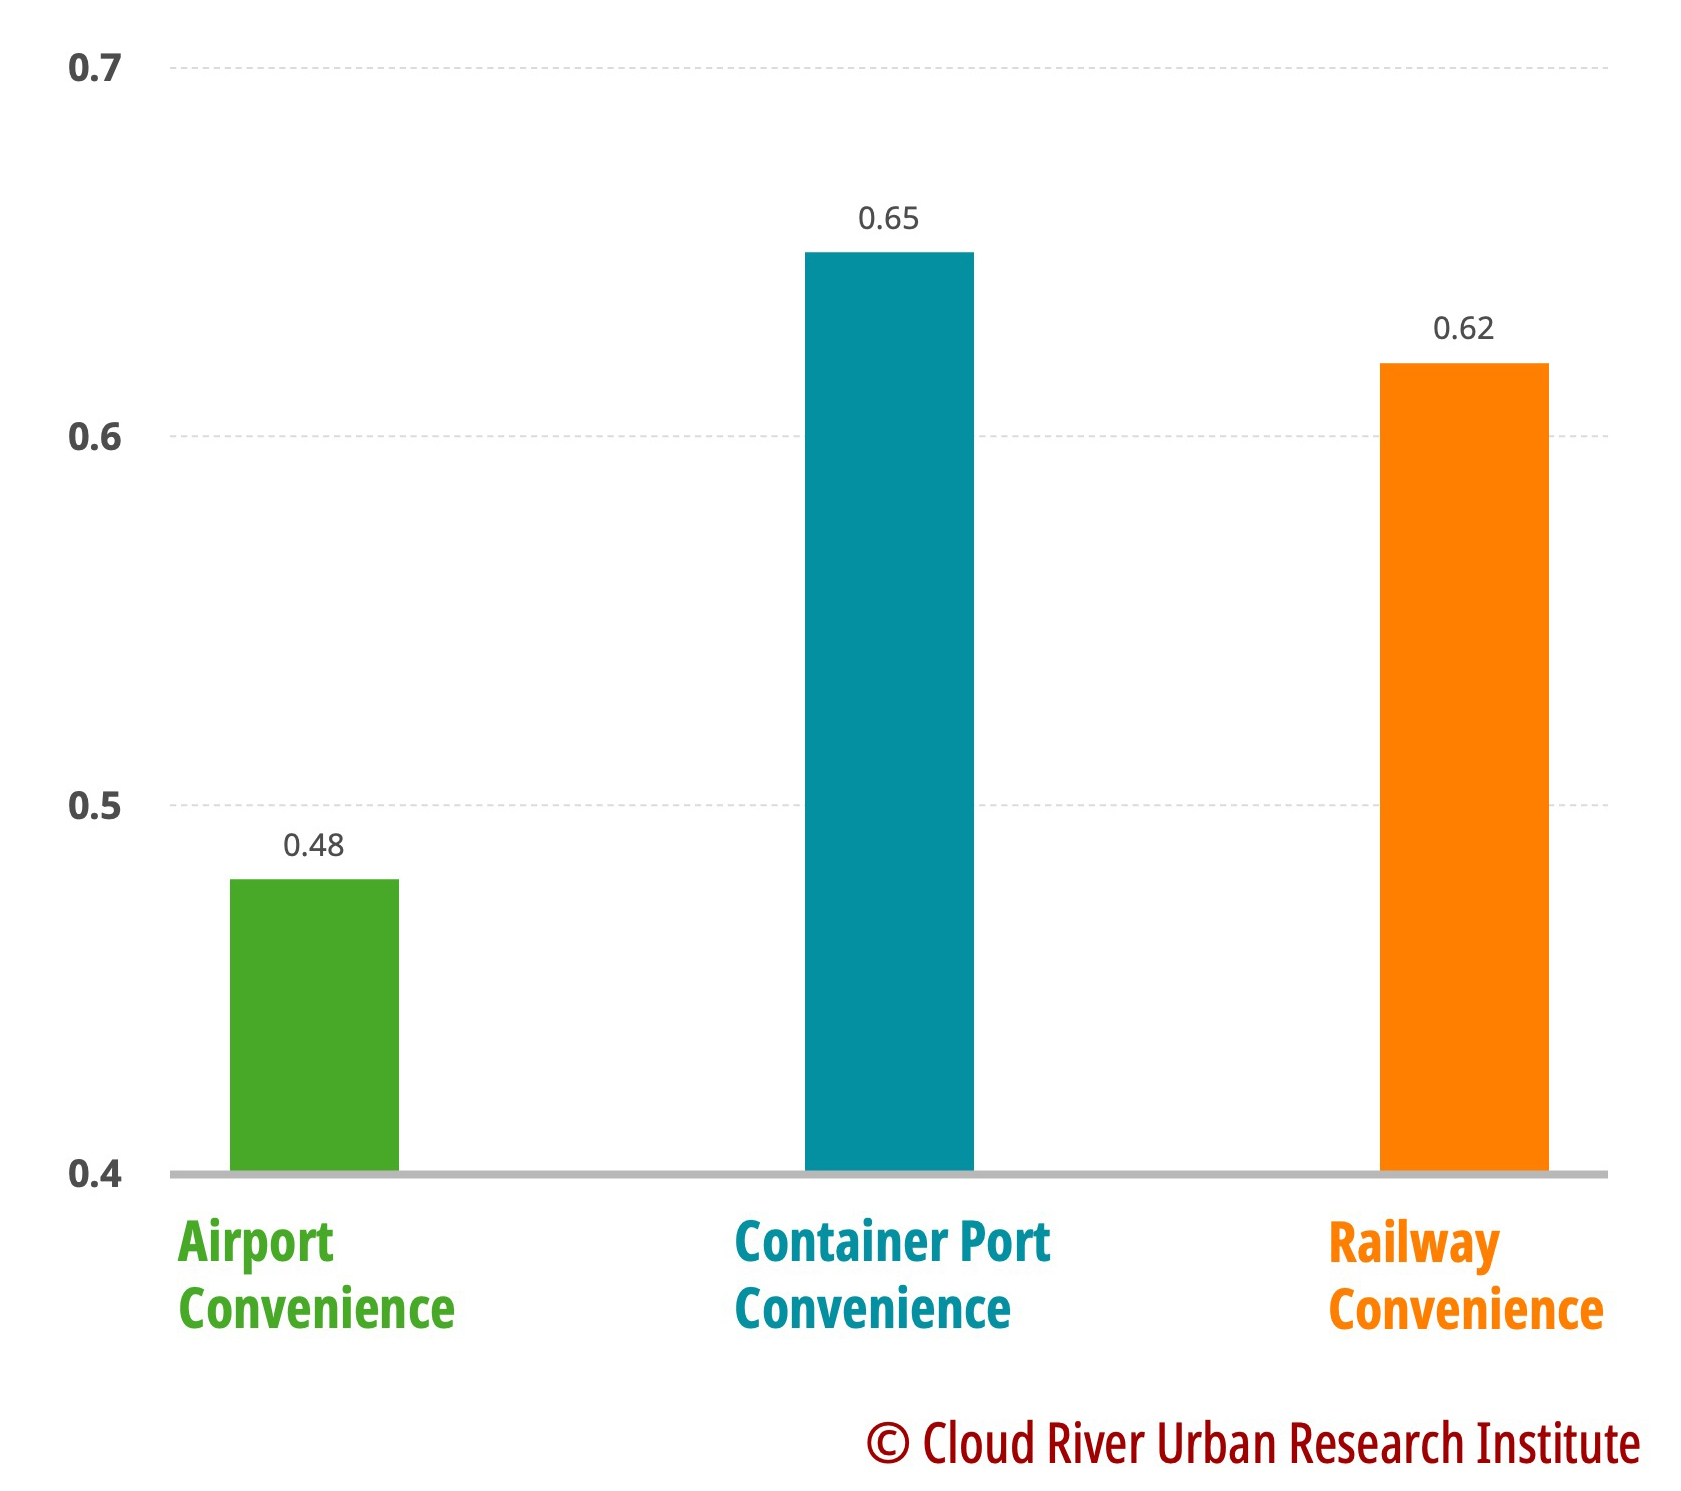
This report, based on the China Integrated City Index, conducts separate correlation analyses of the manufacturing industry’s strength, IT industry’s strength, and various elements of cities such as transportation hubs, opening up and communication, and leading power. The findings reveal that in terms of urban transportation hubs, the development of the manufacturing industry emphasizes the conditions of container ports, while the growth of the IT industry relies on international airports. Regarding opening up and communication in cities, the development of the manufacturing industry is closely linked to the import and export of goods, whereas the development of the IT industry is linked to international conferences. In terms of a city’s strength, the highest correlation with the IT industry’s development is found in the restaurant and hotel industry, whereas the correlation coefficient between the manufacturing industry and the restaurant and hotel industry is significantly lower. Moreover, in comparison to the manufacturing industry, the strength of the IT industry exhibits notably higher correlations with higher education and medical care industries.
From this perspective, it’s evident that the manufacturing industry places relatively lower demands on education levels and urban services. On the contrary, the IT industry, which represents the exchange-based economy, has higher requirements for these aspects and is closely related to international airports and international conferences, in which the advantage of metropolises in developing the IT industry constitutes.
Based on the analysis above, we suggest giving full play to the advantage of the density of corporate headquarters and the sheer number of universities and research institutions in Beijing. This will promote and guide the exchange of high-caliber individuals and turn Beijing into the biggest center of international conferences in Asia. We suggest using international conferences as driving force for the exchange-based economy, and facilitating the exchange of ideas, technological innovation, content creation, and the upgrade of business models, particularly in innovative sectors like IT. This will cement Beijing’s effort to pursue opening up and innovative development through exchange-based communication and collaboration as an international metropolis.
(The article was written by the Counsellors’ Office of the People’s Government of Beijing Municipality, Cloud River Urban Research Institute)
The article was first published on China SCIO, China.org.cn on Aug. 29, 2023 and reprinted by other news websites.