Strength and weaknesses: A comparison of Beijing with four Bemajor metropolises

Zhou Muzhi, head of Cloud River Urban Research Institute


Editor’s note:

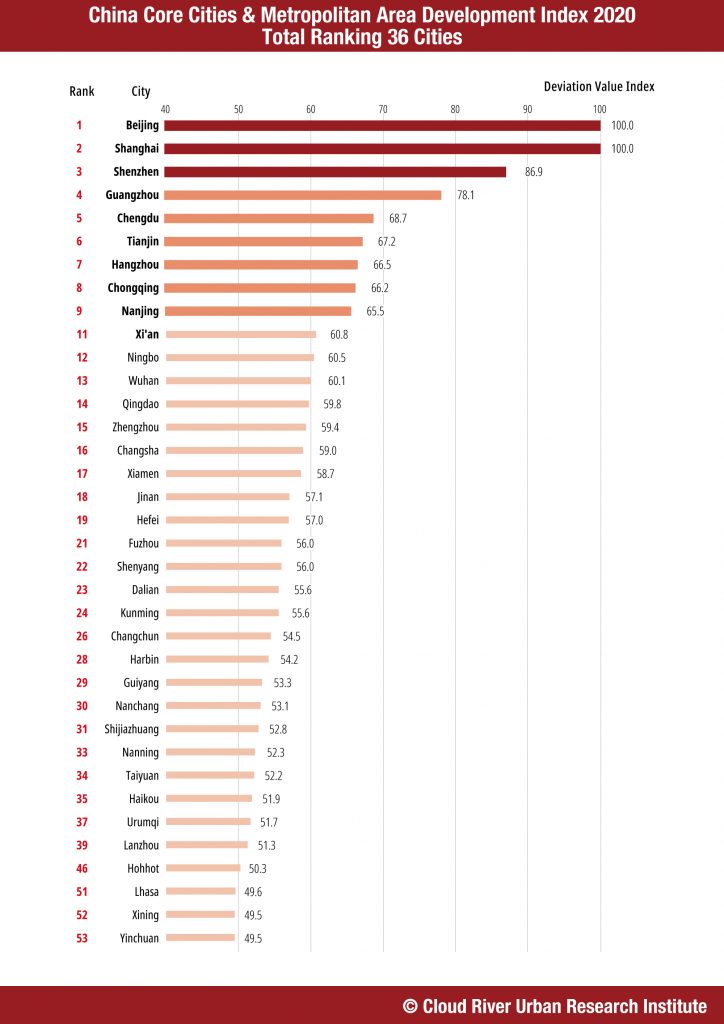
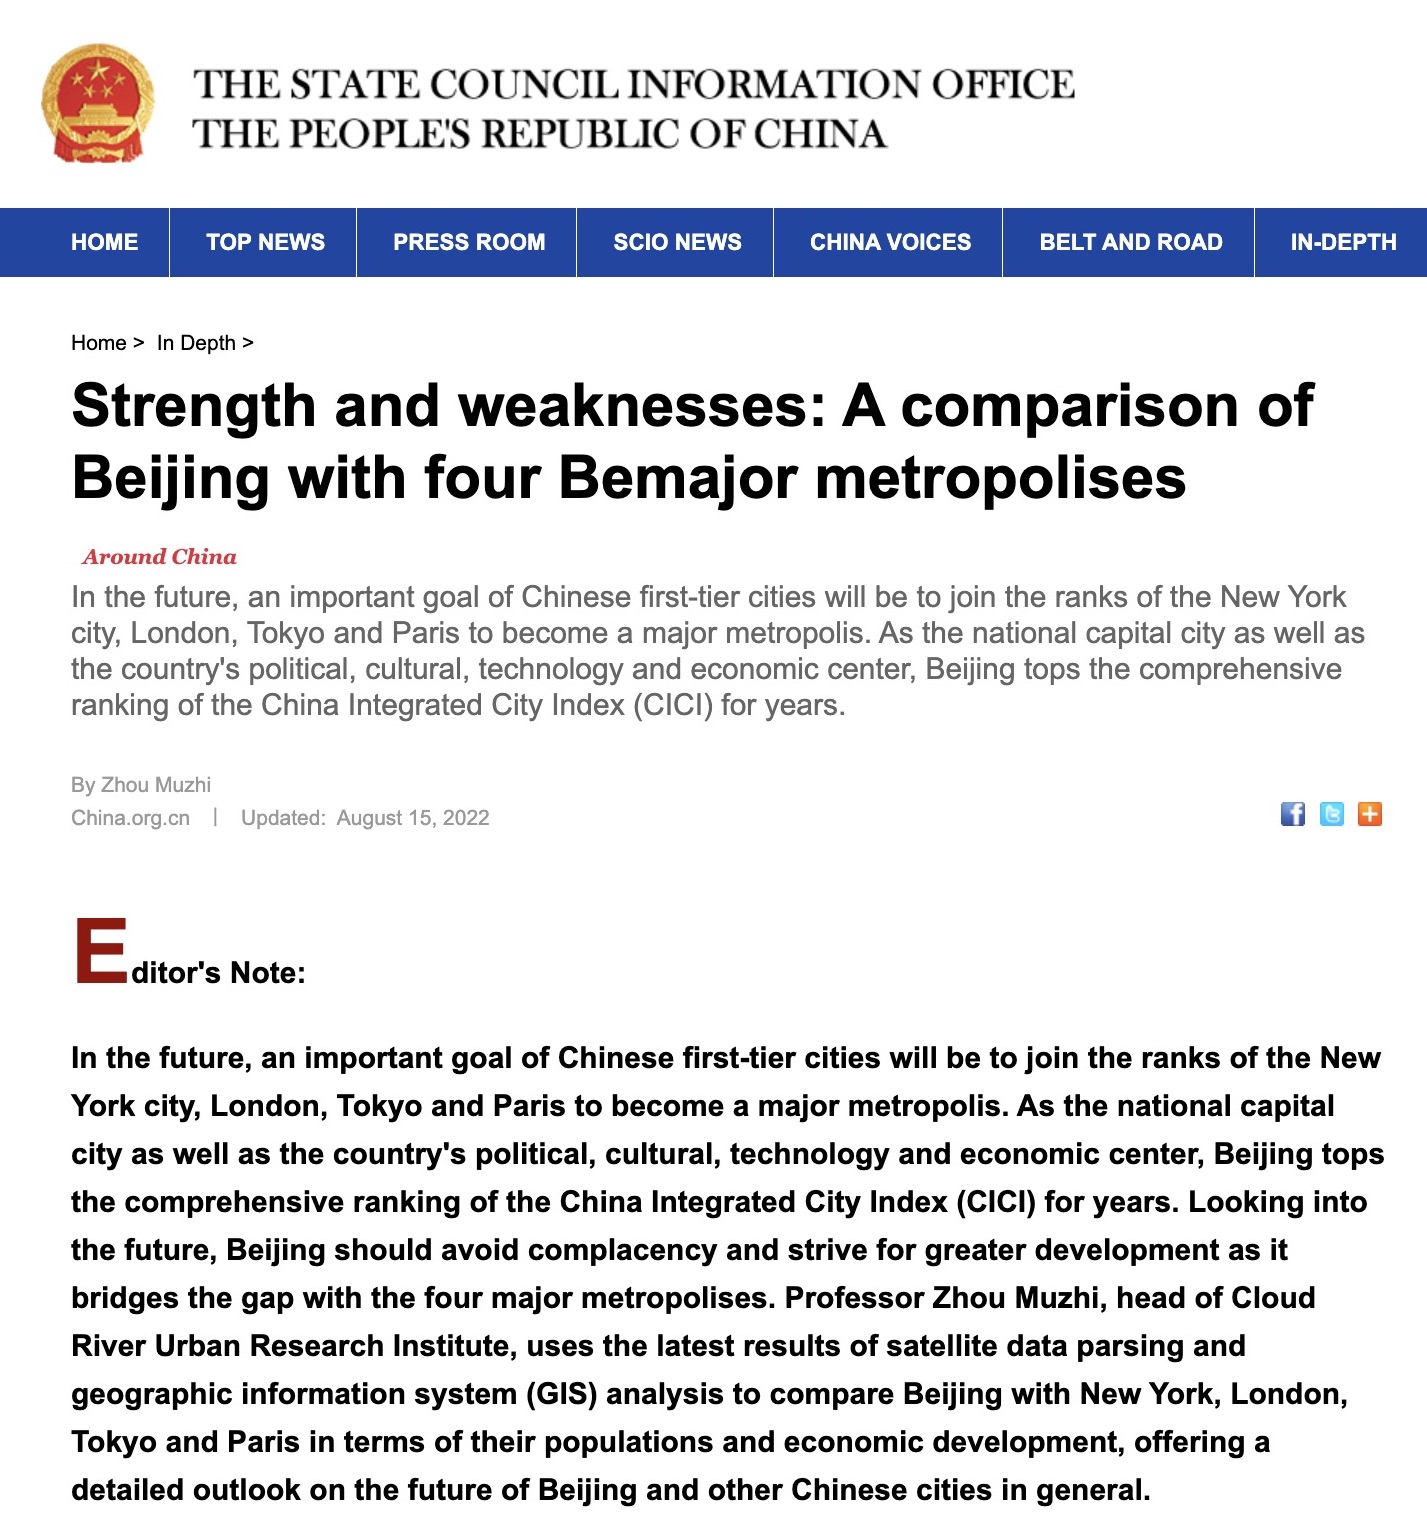
In the future, an important goal of Chinese first-tier cities will be to join the ranks of the New York city, London, Tokyo and Paris to become a major metropolis. As the national capital city as well as the country’s political, cultural, technology and economic center, Beijing tops the comprehensive ranking of the China Integrated City Index (CICI) for years. Looking into the future, Beijing should avoid complacency and strive for greater development as it bridges the gap with the four major metropolises. Professor Zhou Muzhi, head of Cloud River Urban Research Institute, uses the latest results of satellite data parsing and geographic information system (GIS) analysis to compare Beijing with New York, London, Tokyo and Paris in terms of their populations and economic development, offering a detailed outlook on the future of Beijing and other Chinese cities in general.


As the national capital city as well as the country’s political, cultural, technology and economic center, Beijing tops the comprehensive ranking of the China Integrated City Index (CICI) for years. Looking into the future, Beijing should avoid complacency and strive for greater development as it bridges the gap with the four major metropolises.

New York, London, Tokyo and Paris are universally recognized as the world’s four major metropolises, the hub of global economic and cultural exchanges and the benchmark for urban development. Therefore, it is essential to make a comparative study between Beijing and the four major metropolises in order to identify the Chinese capital’s strength and weaknesses.

However, the four major metropolises have all spread out beyond the boundaries of cities in actual form into megalopolises, which makes our quantitative analysis even harder. Through years of efforts facilitated by satellite data parsing and GIS analysis, Cloud River Urban Research Institute can accurately determine the scope of these megalopolises, and precisely analyze their population size, distribution, and density. The institute can also measure the development quality of a megalopolis through a multimodal index analysis, elevating the research on metropolises worldwide to a new level. This has provided a scientific basis for the accurate comparative analysis of Beijing and the four major metropolises.

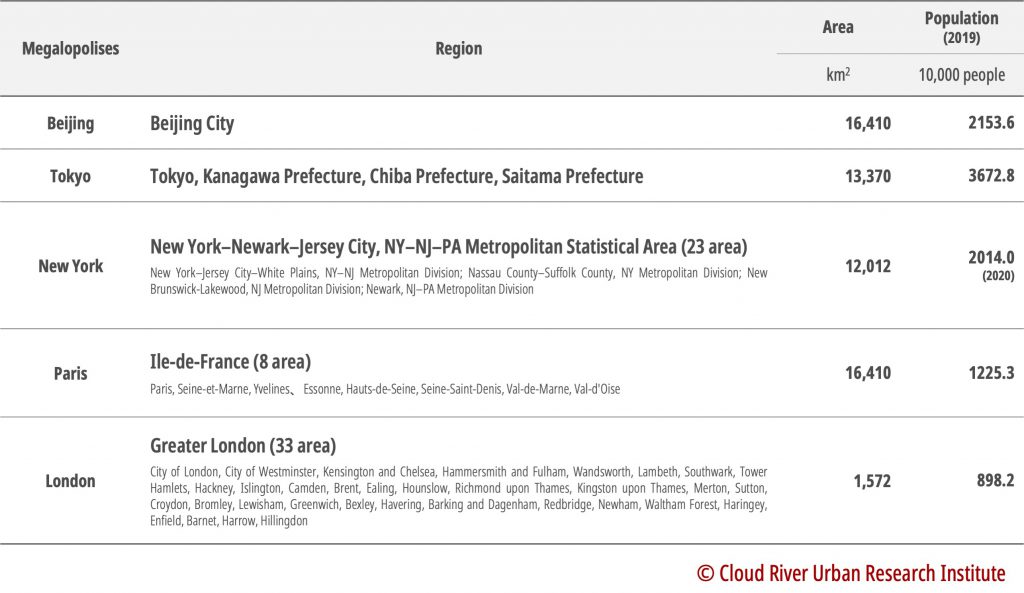
Table 1. The size and population of Beijing, New York, London, Tokyo, and Paris megalopolises

1. Population: China’s population grew by 58.7% in the past 20 years


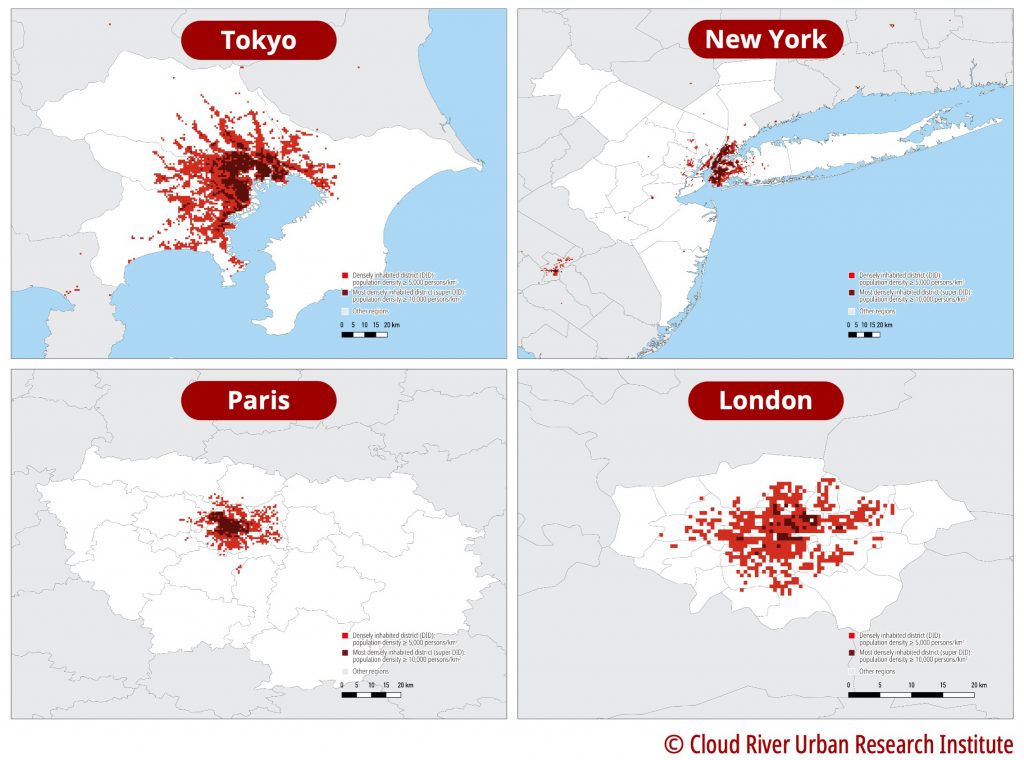
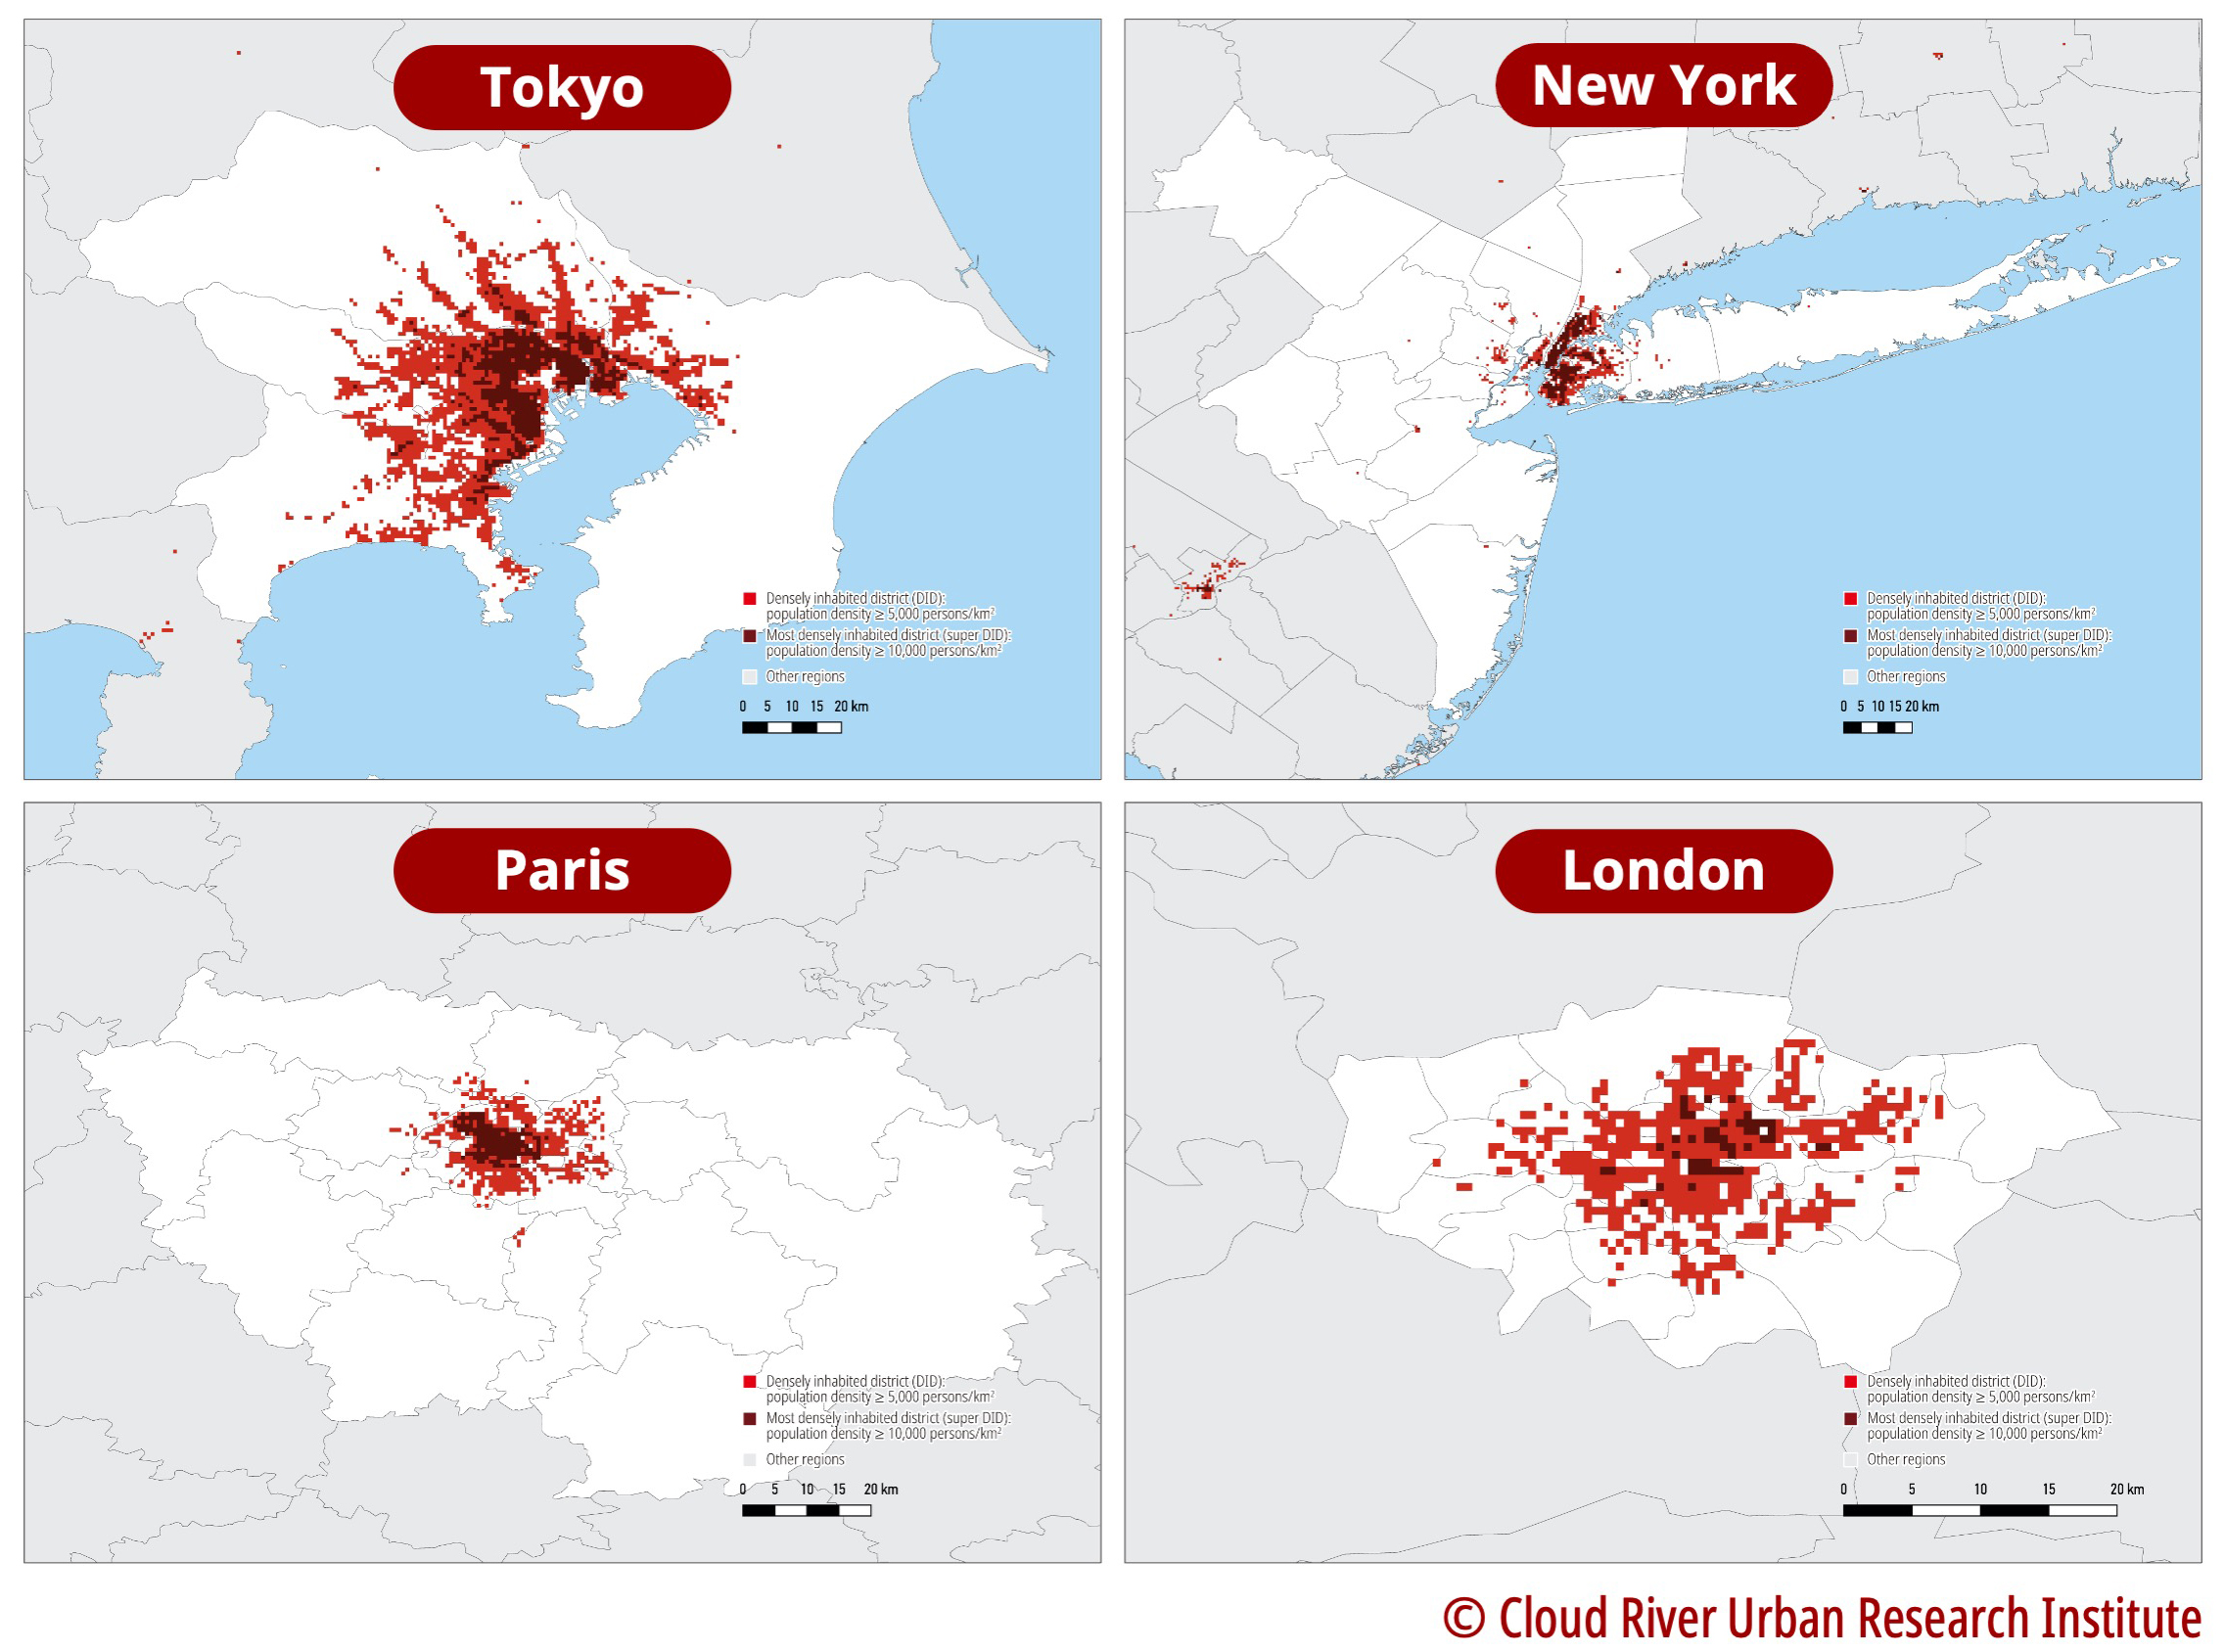
As Figure 1 shows, Cloud River Urban Research Institute defines the area with more than 5,000 people per square kilometer as a Dense Population District (DID). This helps analyze a city’s population density and identify the boundary of a megalopolis. In this article, statistics about New York, London, Tokyo and Paris are measured within the boundaries of each megalopolis.

Figure 1. DID within the boundaries of New York, London, Tokyo and Paris

Note: Please refer to Table 1 for the boundaries of the four megalopolises.

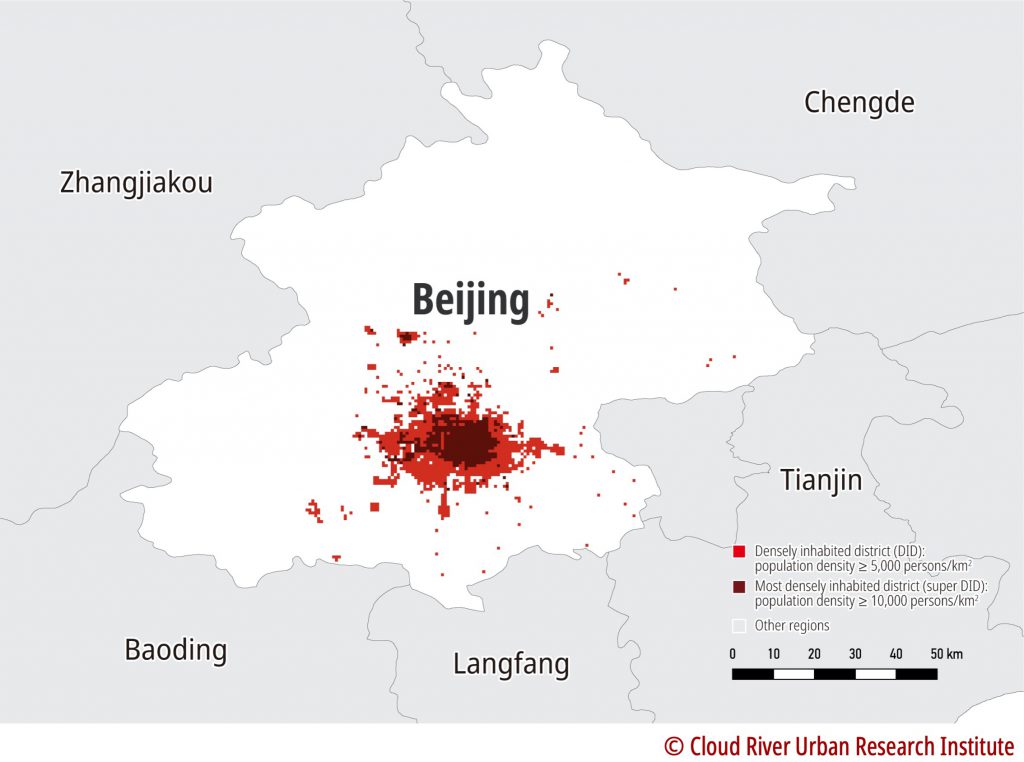
As Figure 2 suggests, the Beijing megalopolis according to the DID analysis is within the administrative region of the city. Therefore, the statistics about Beijing megalopolis mentioned in this article come from the statistics of the Beijing municipality. 

Figure 2. DID analysis of the Beijing megalopolis

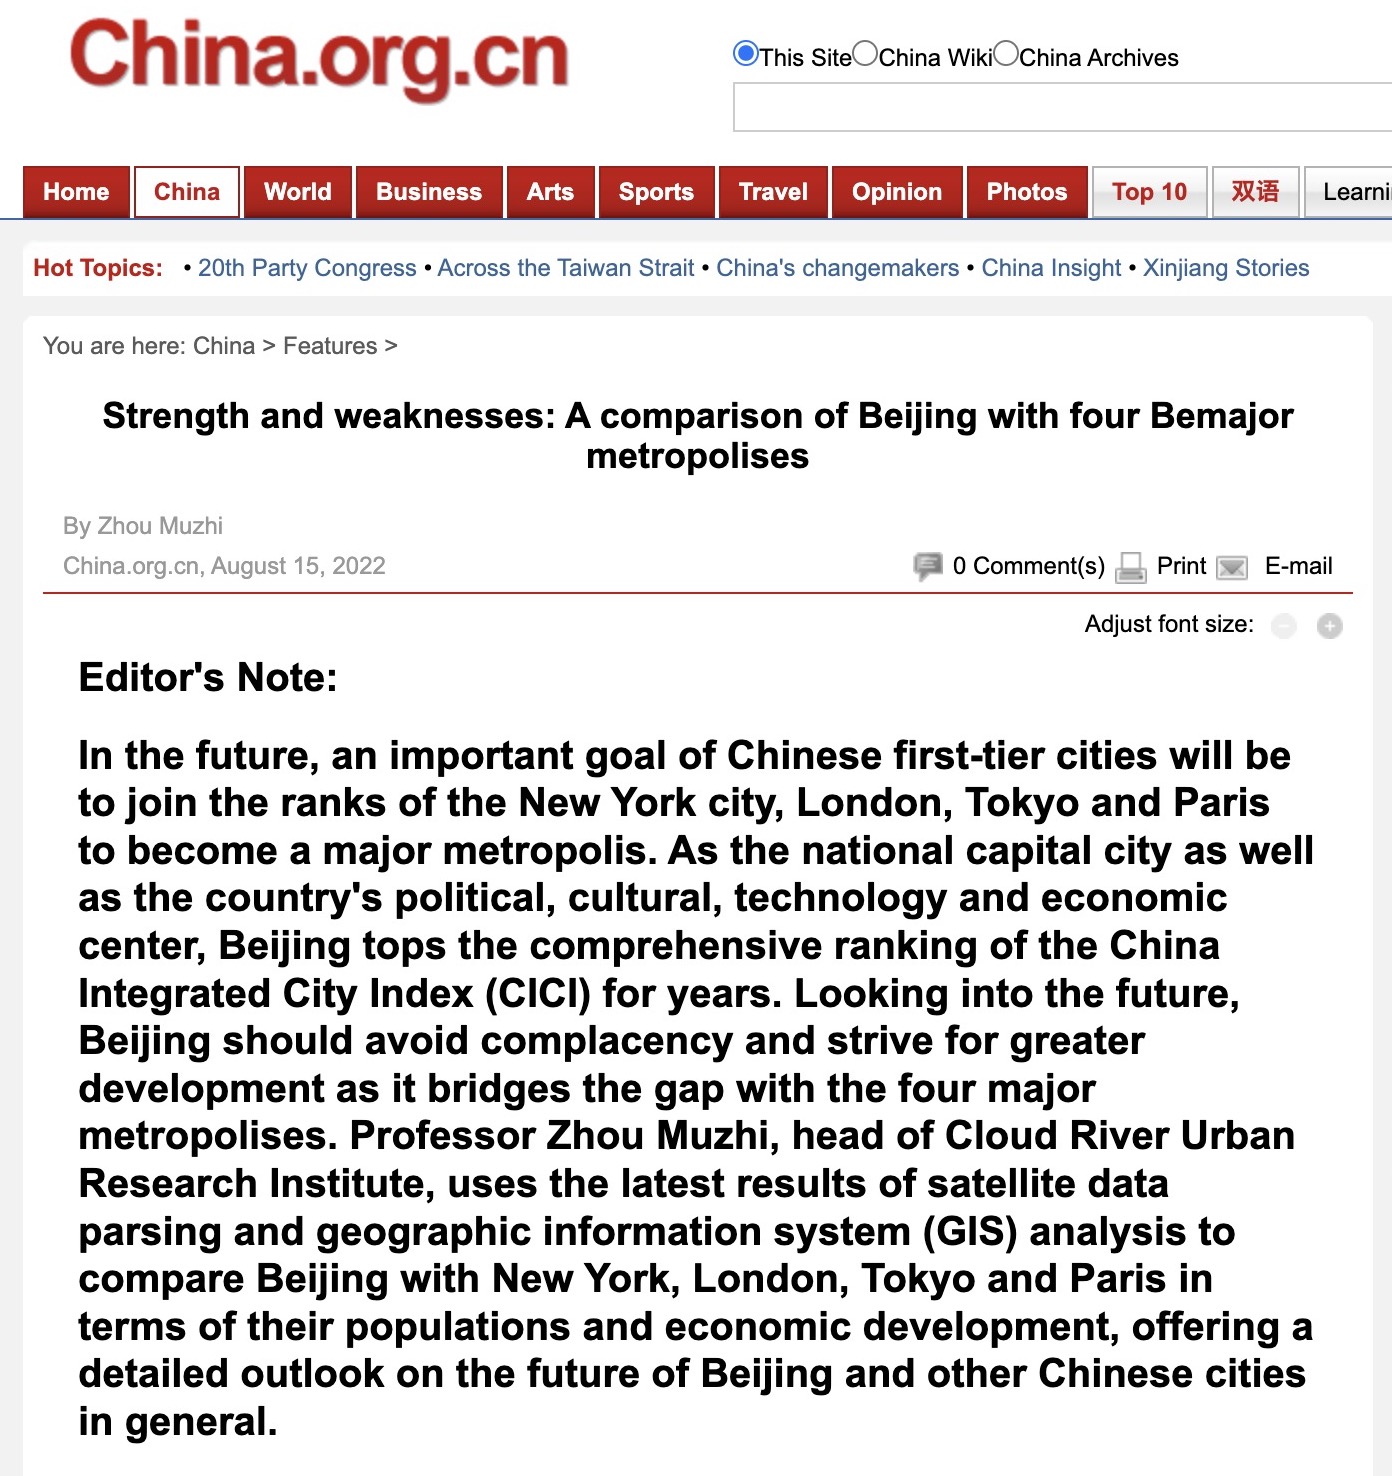
(1) Metropolis with the largest population

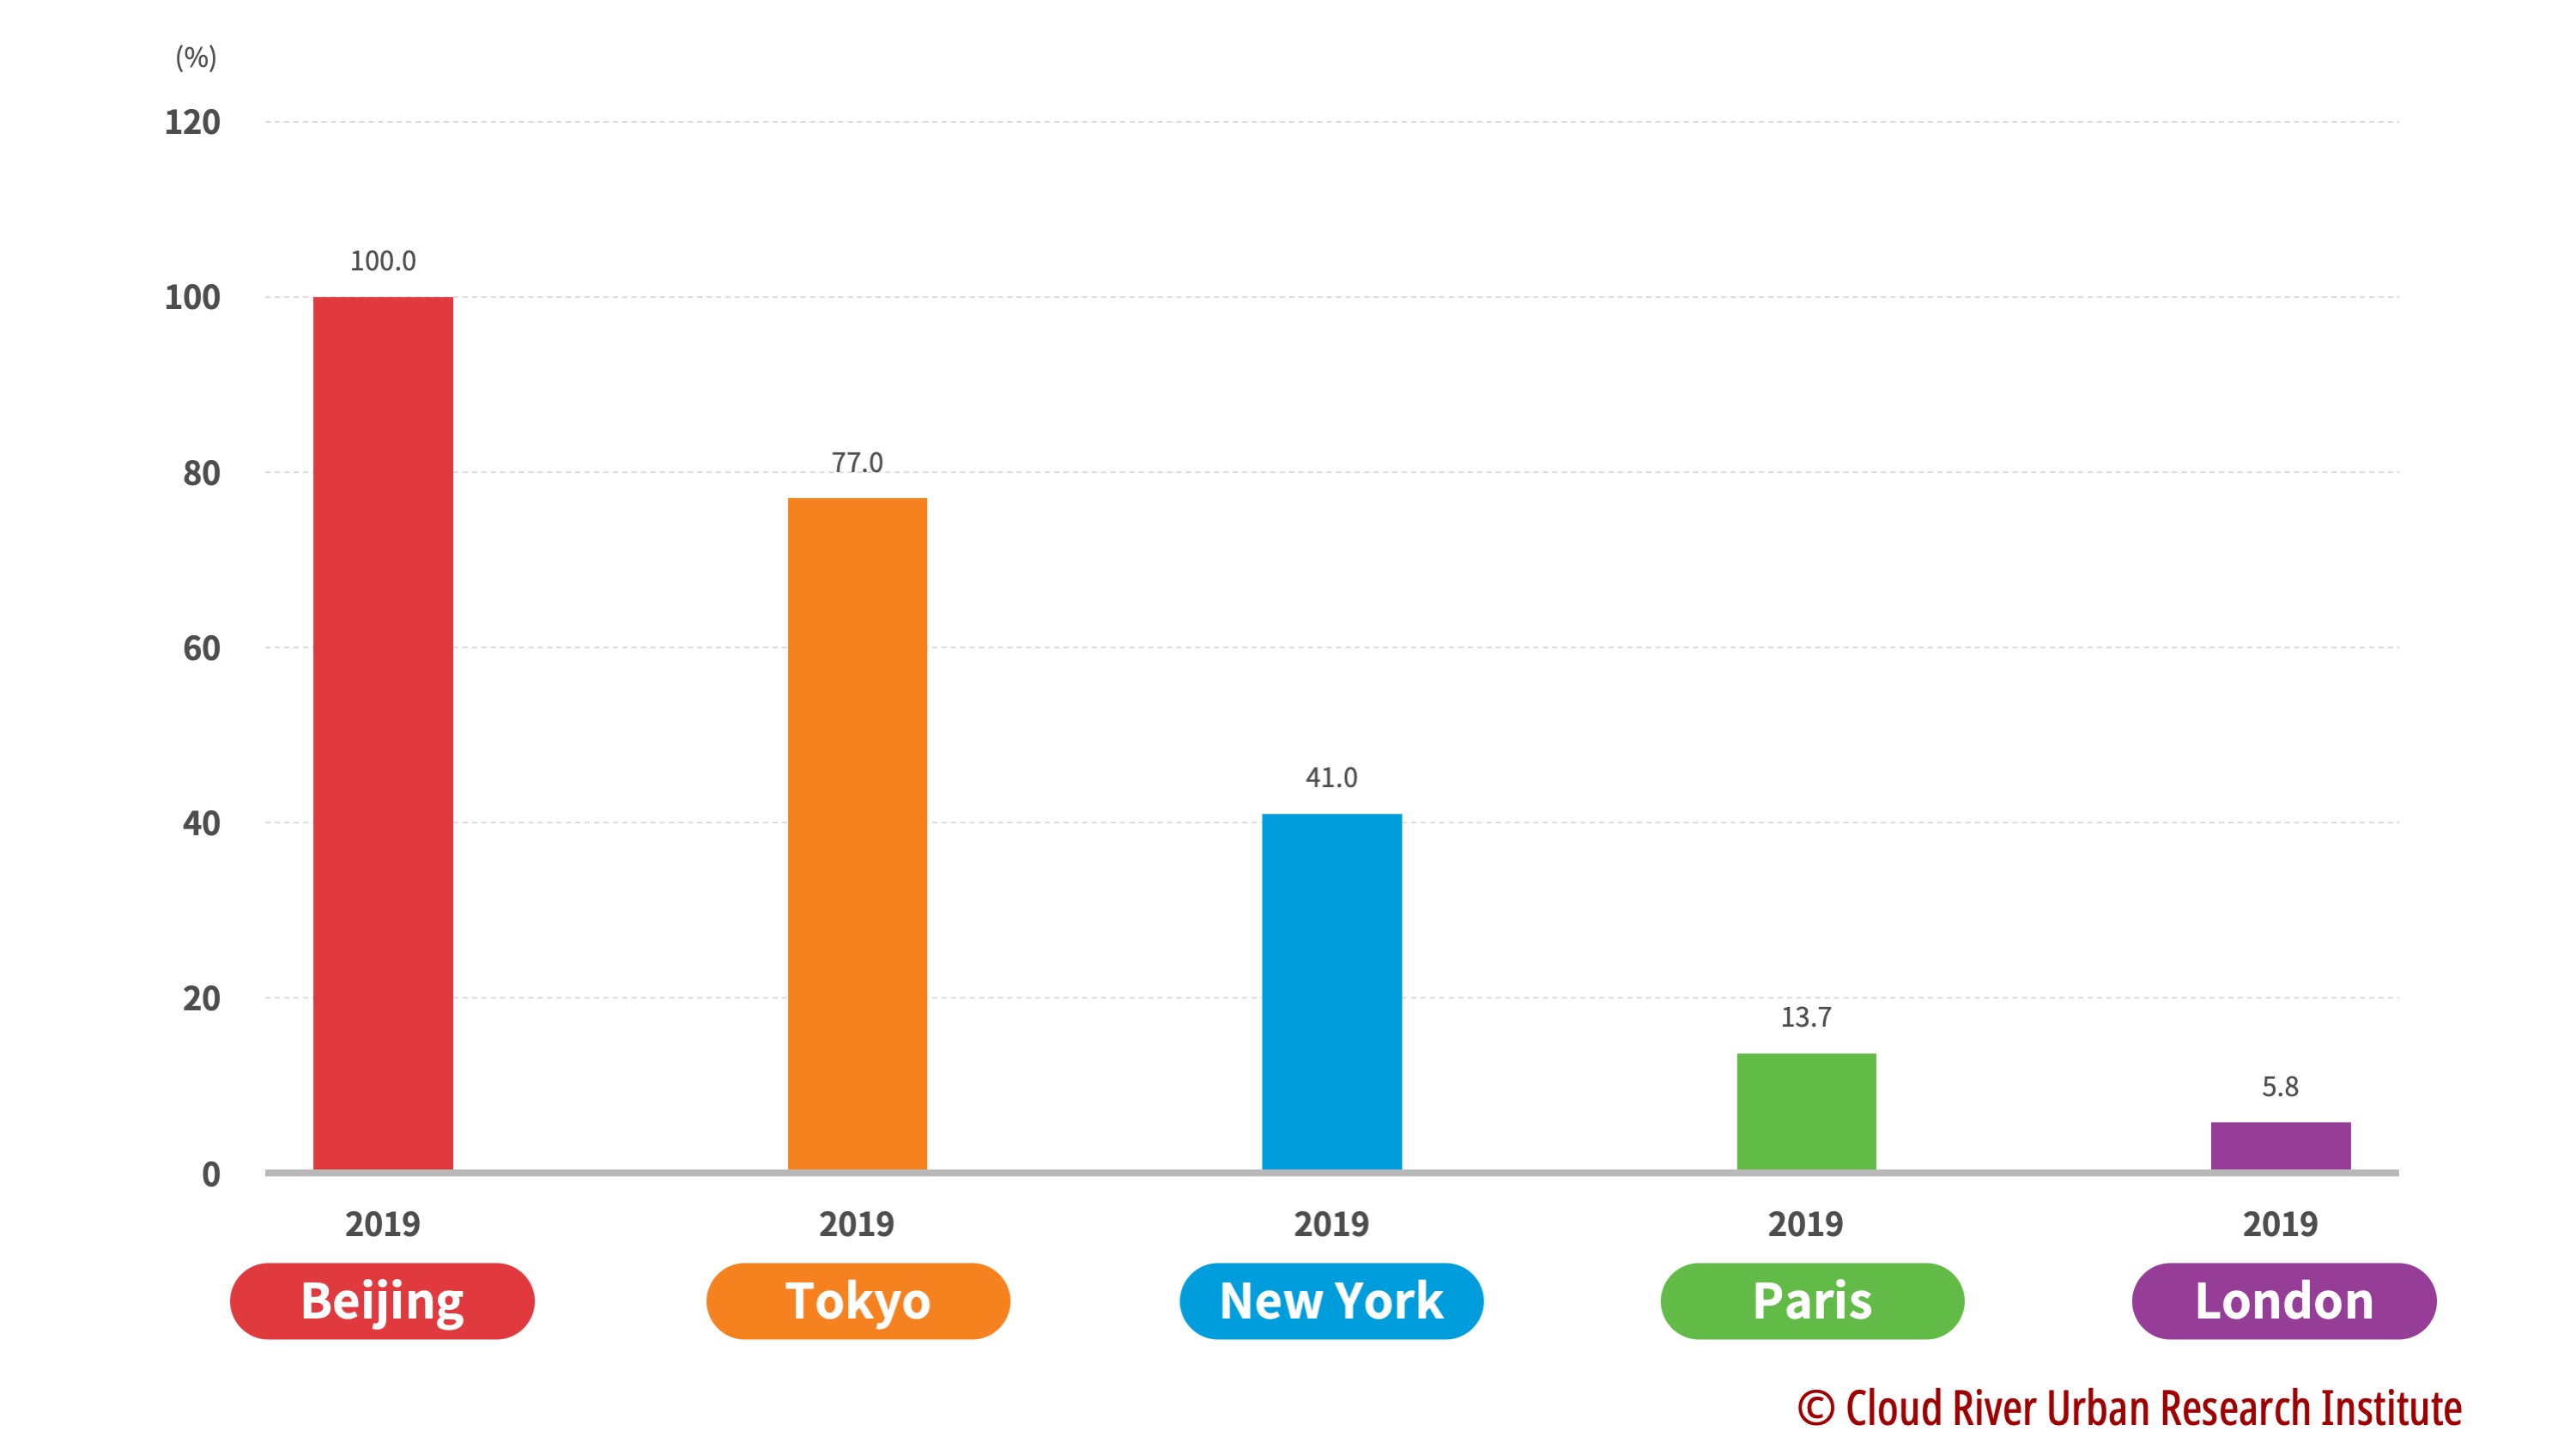
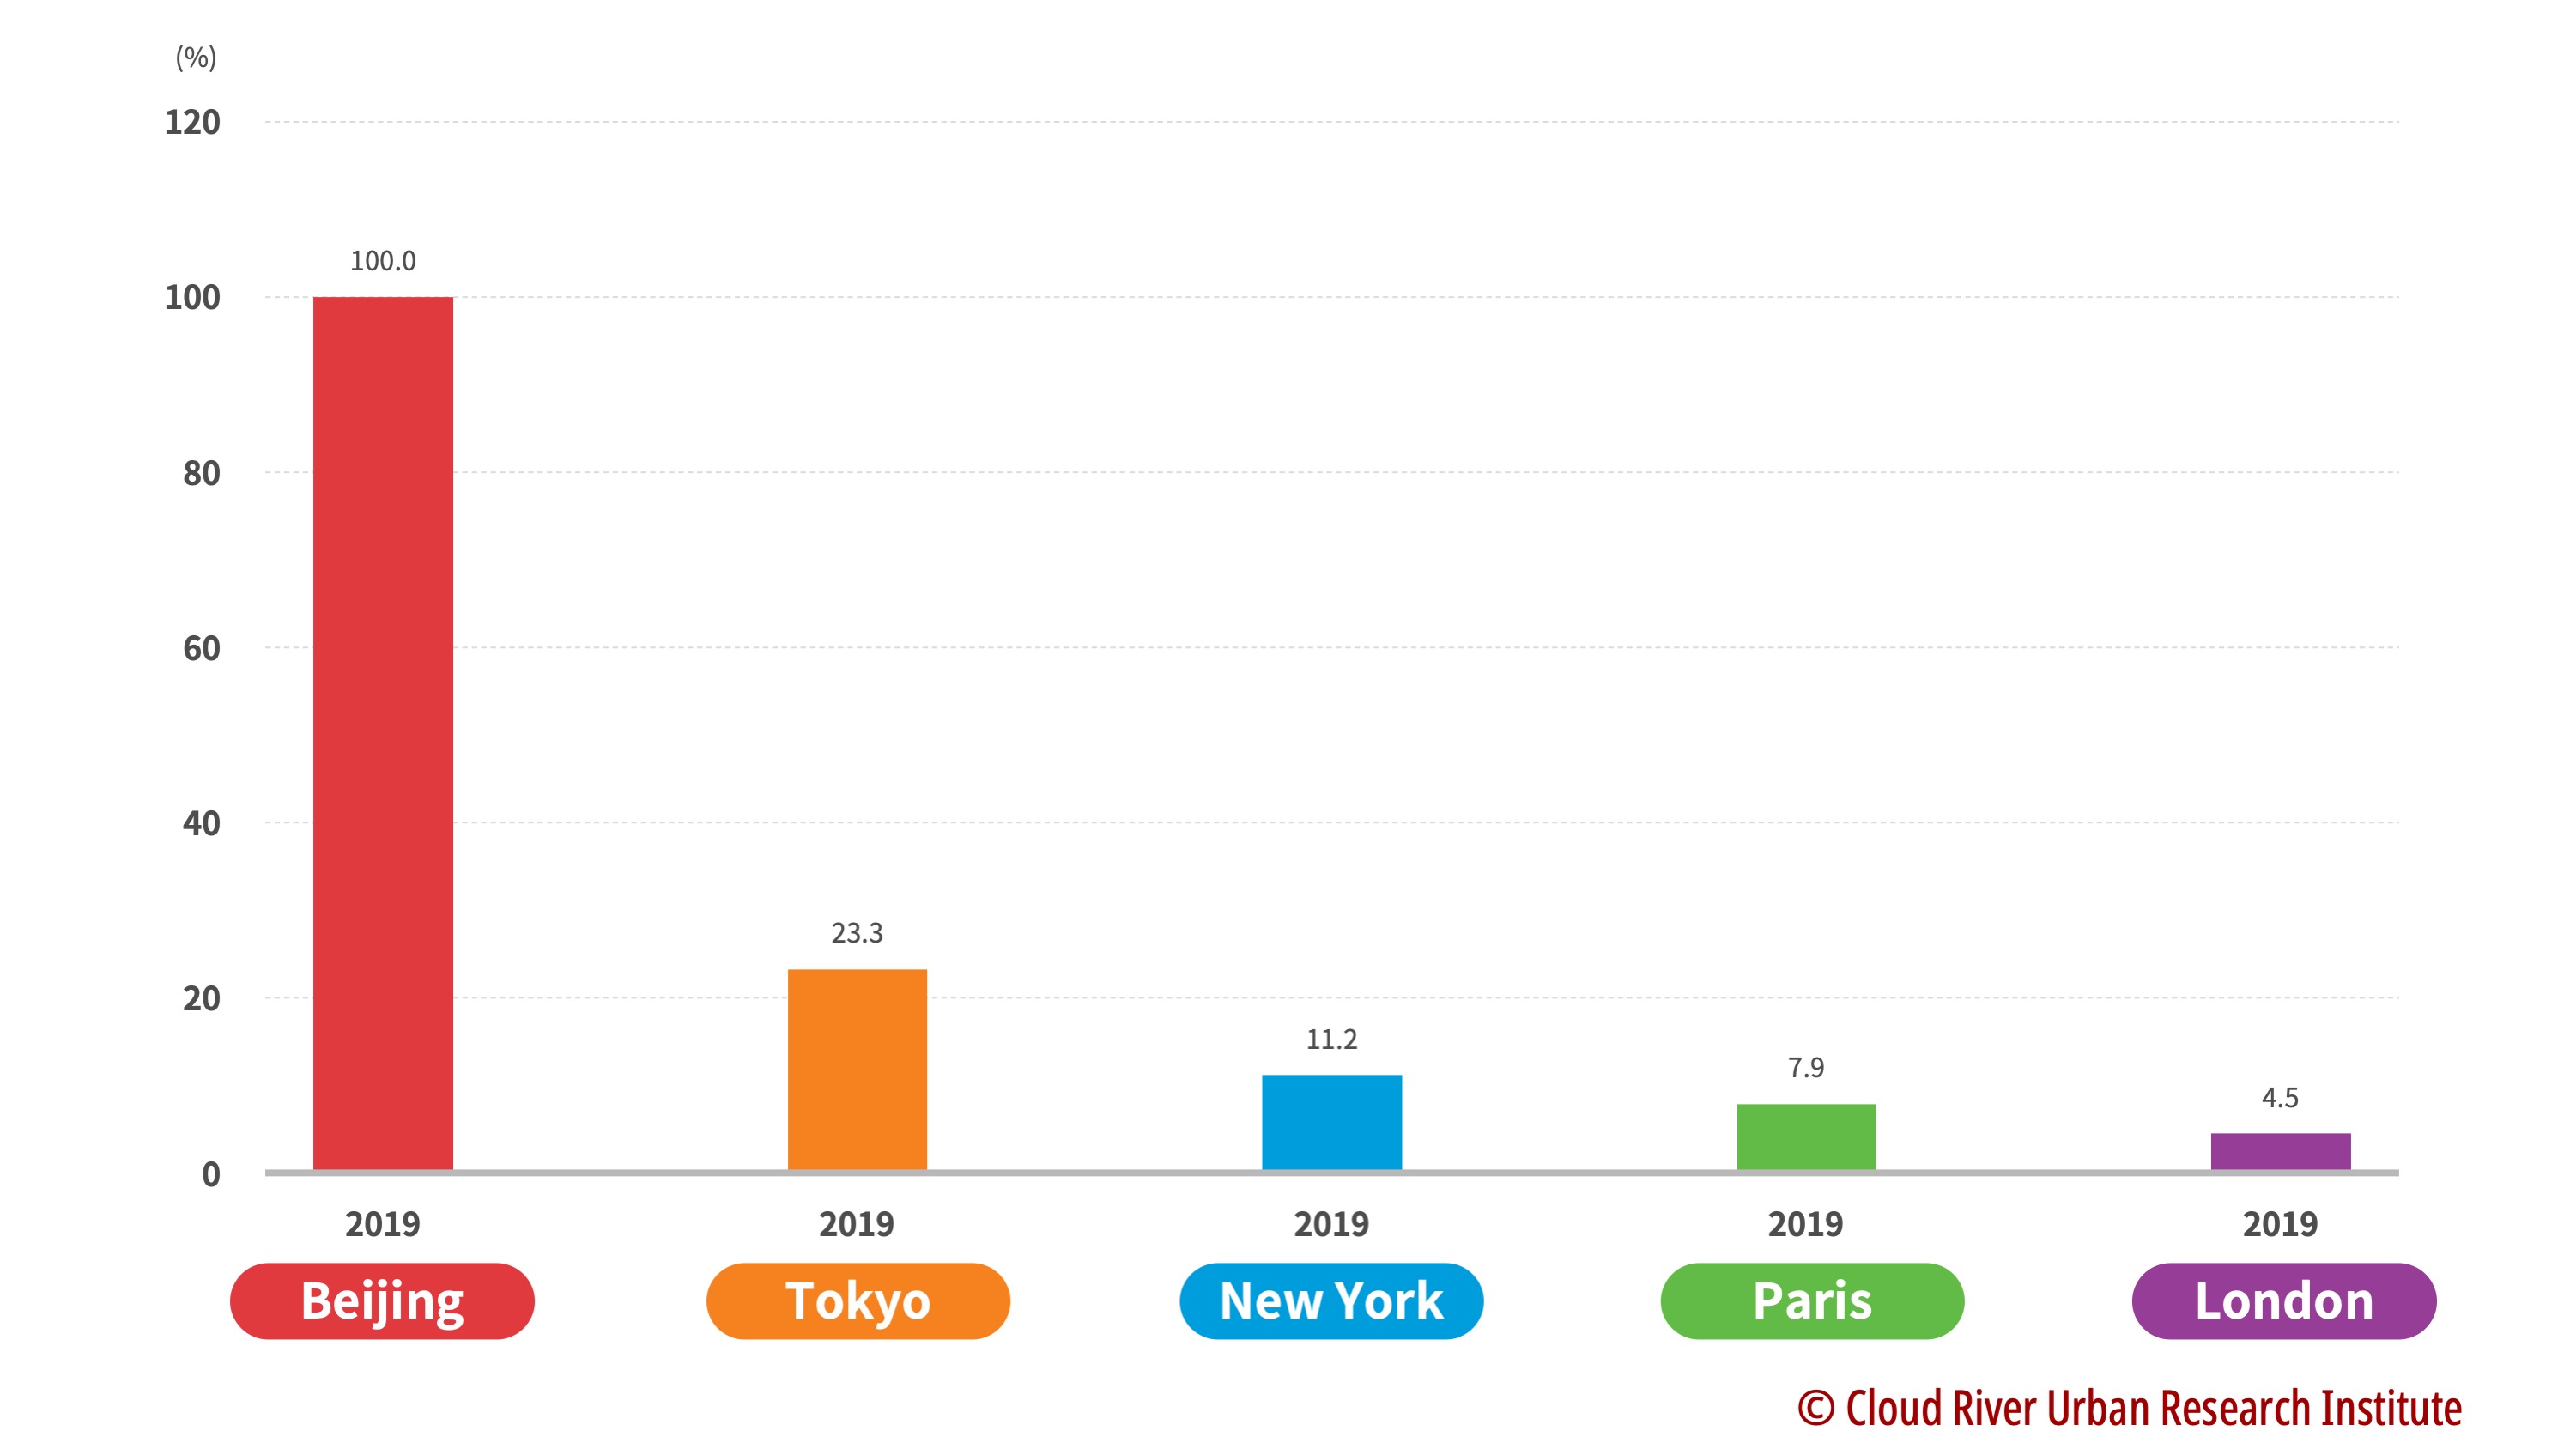
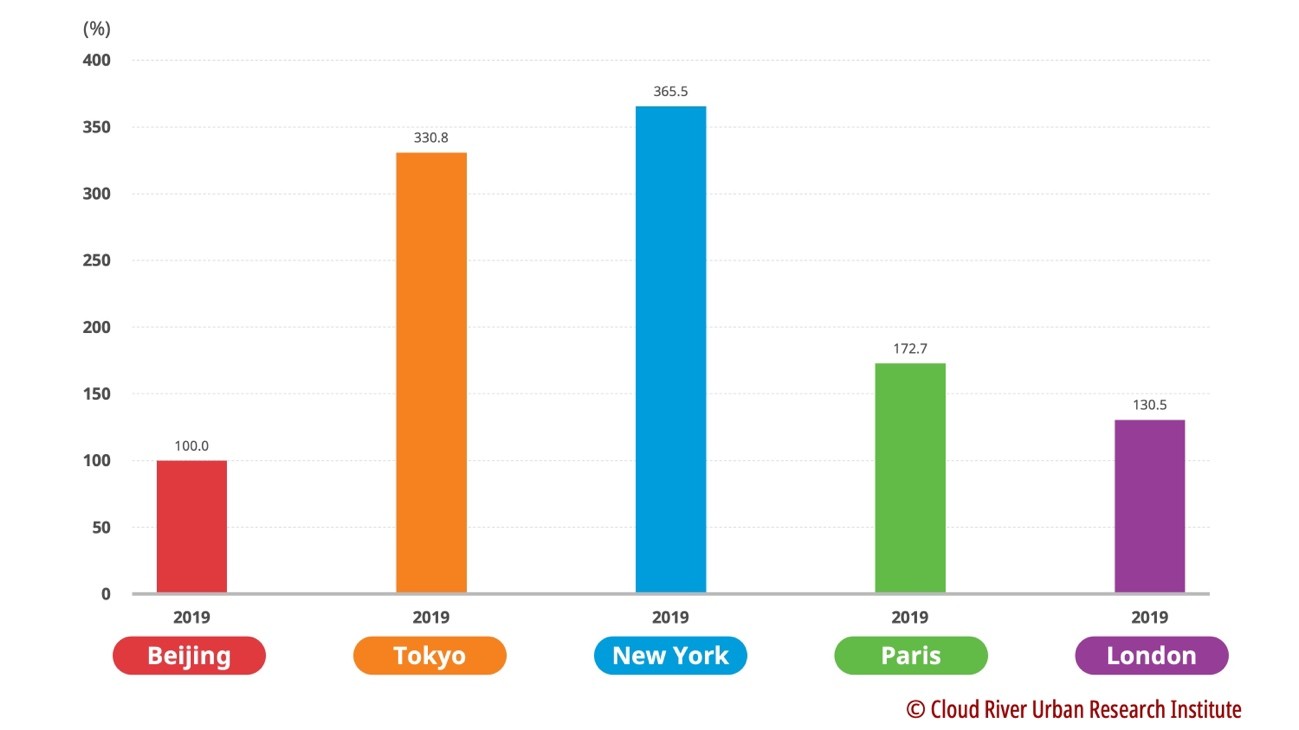
The Tokyo megalopolis is the world’s most densely populated city with a population of 36.73 million in 2019, or 1.7 times that of Beijing’s total population. The New York megalopolis has a population about 93.5% that of Beijing. Paris and London megalopolises have only 56.9% and 41.7% of Beijing’s population.

Figure 3. A comparison of Beijing with the four major metropolises in terms of population (2019)

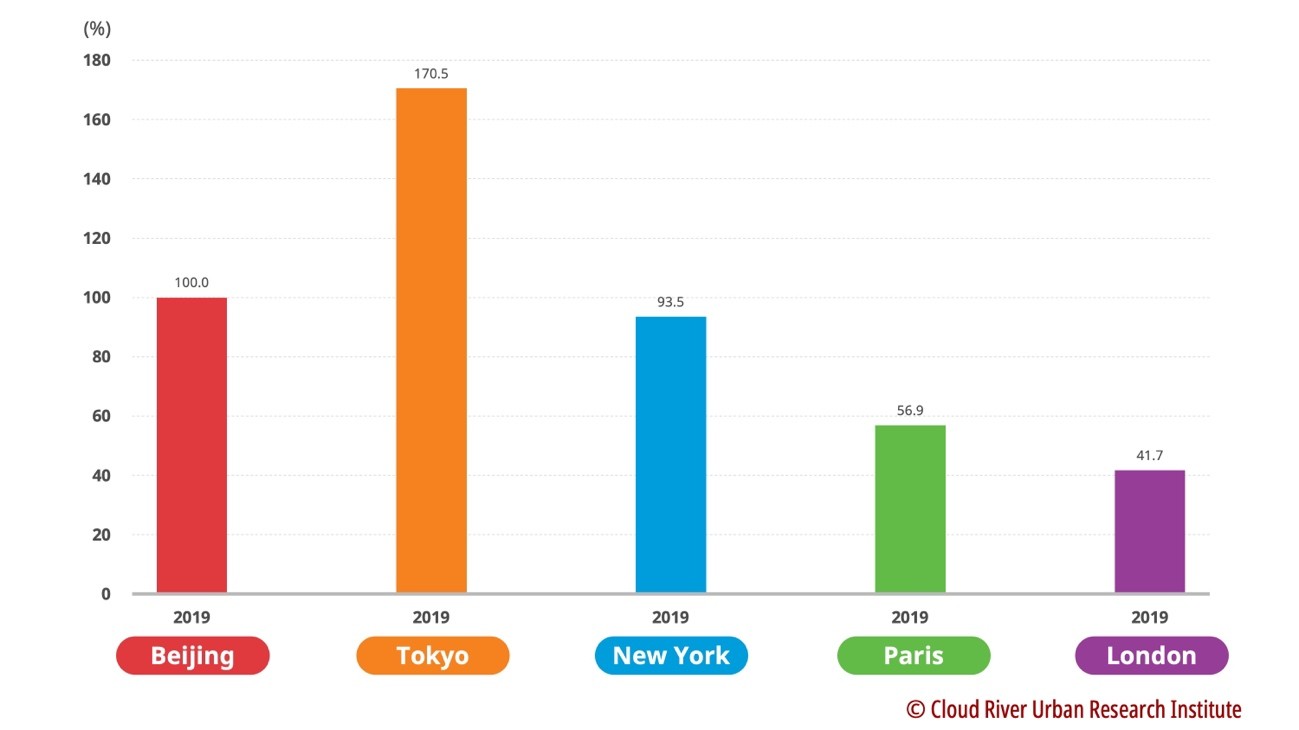
(2) Population continues to concentrate in major metropolises

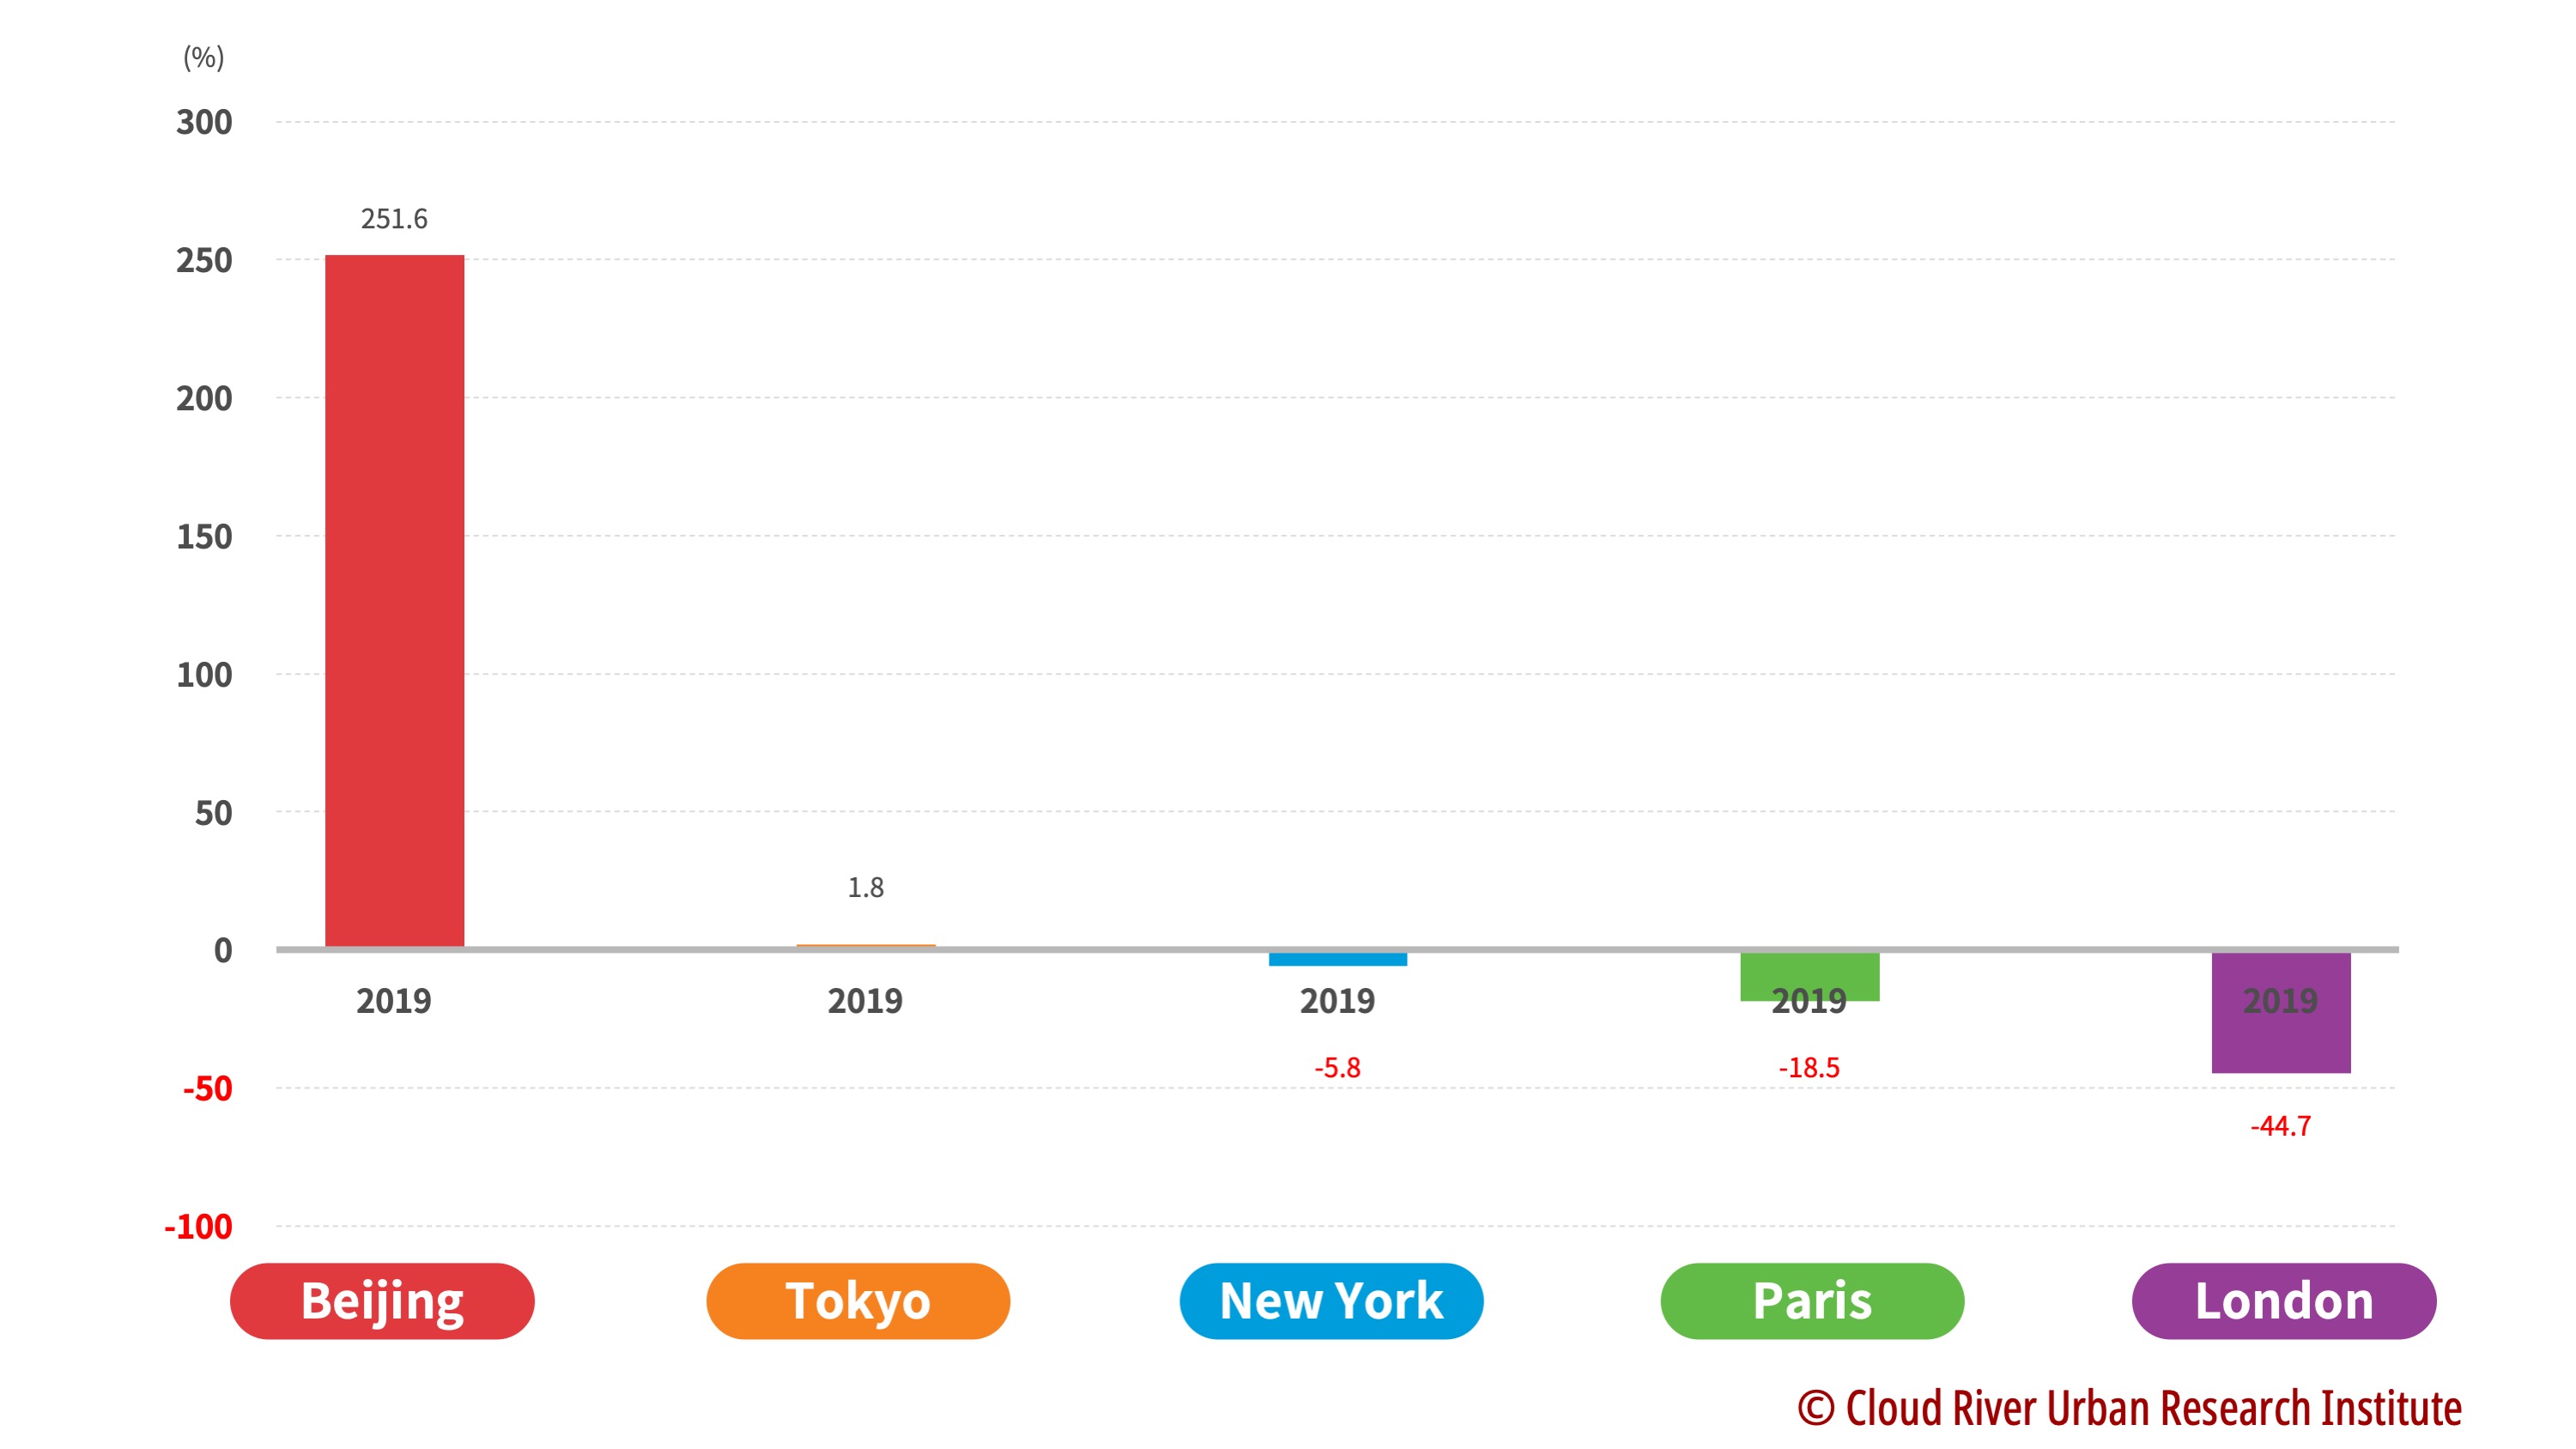
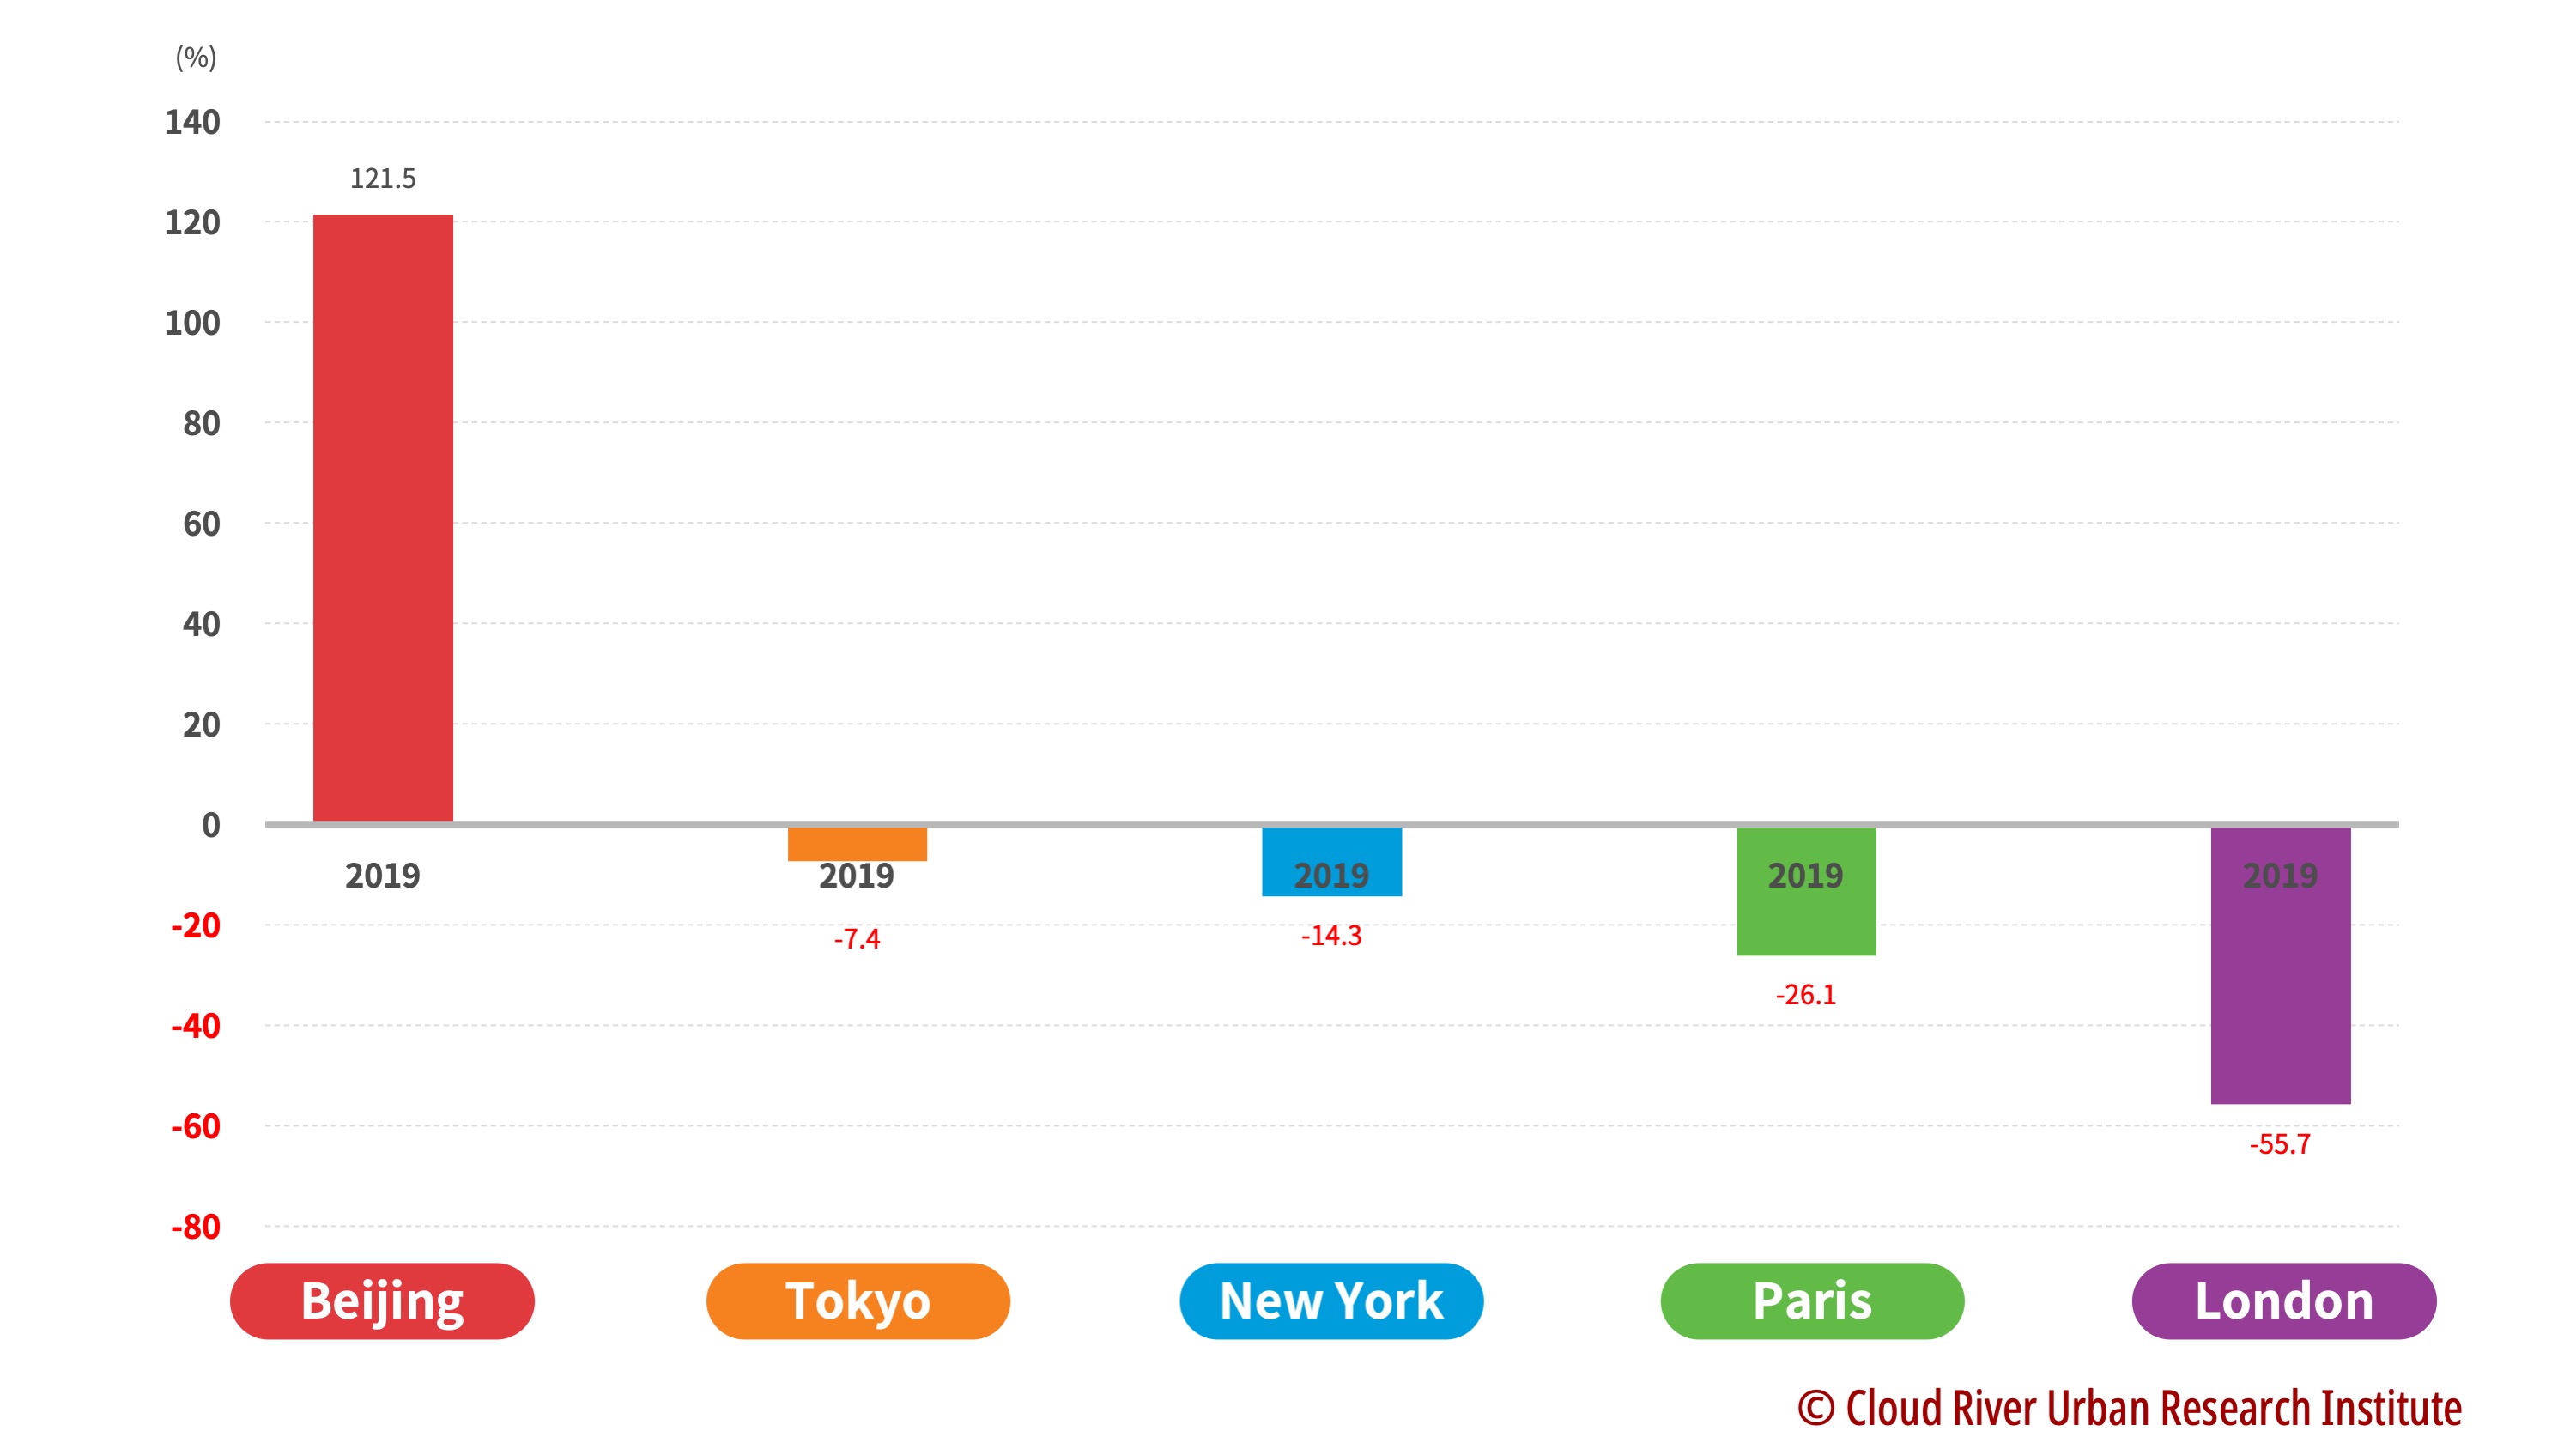
Beijing leads in population growth among the five cities. From 2000 to 2019, Beijing’s population grew by 58.7% driven by the high-speed economic growth and urbanization of the country.

Among the four metropolises, London enjoys the fastest population growth, recording a 24.8% increase in the past 20 years. Over the same period, Paris, Tokyo and New York megalopolises recorded 10.4%, 9.9% and 9.9% growth in population, respectively. This has shown that the population continues to concentrate in major metropolises worldwide, and the logic applies to developed countries as well.

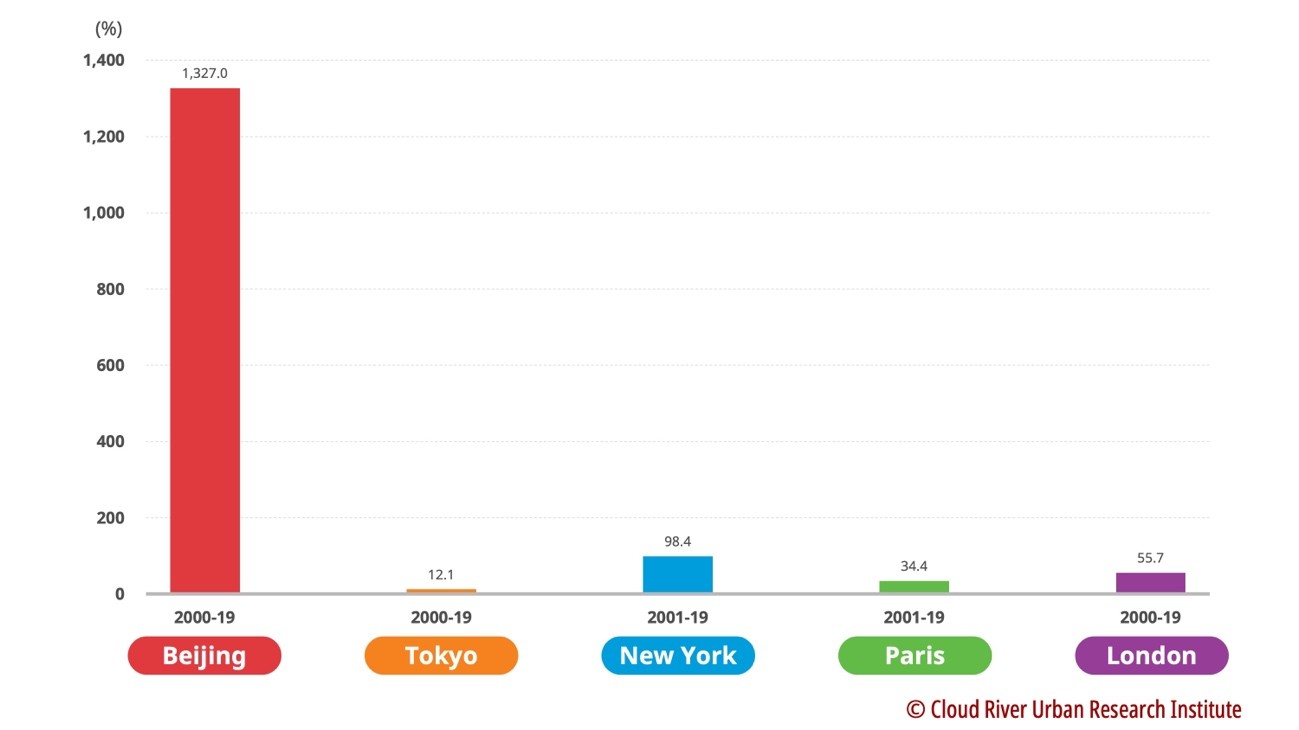
Figure 4. A comparison of Beijing with the four major metropolises in terms of population growth (2000-2019)

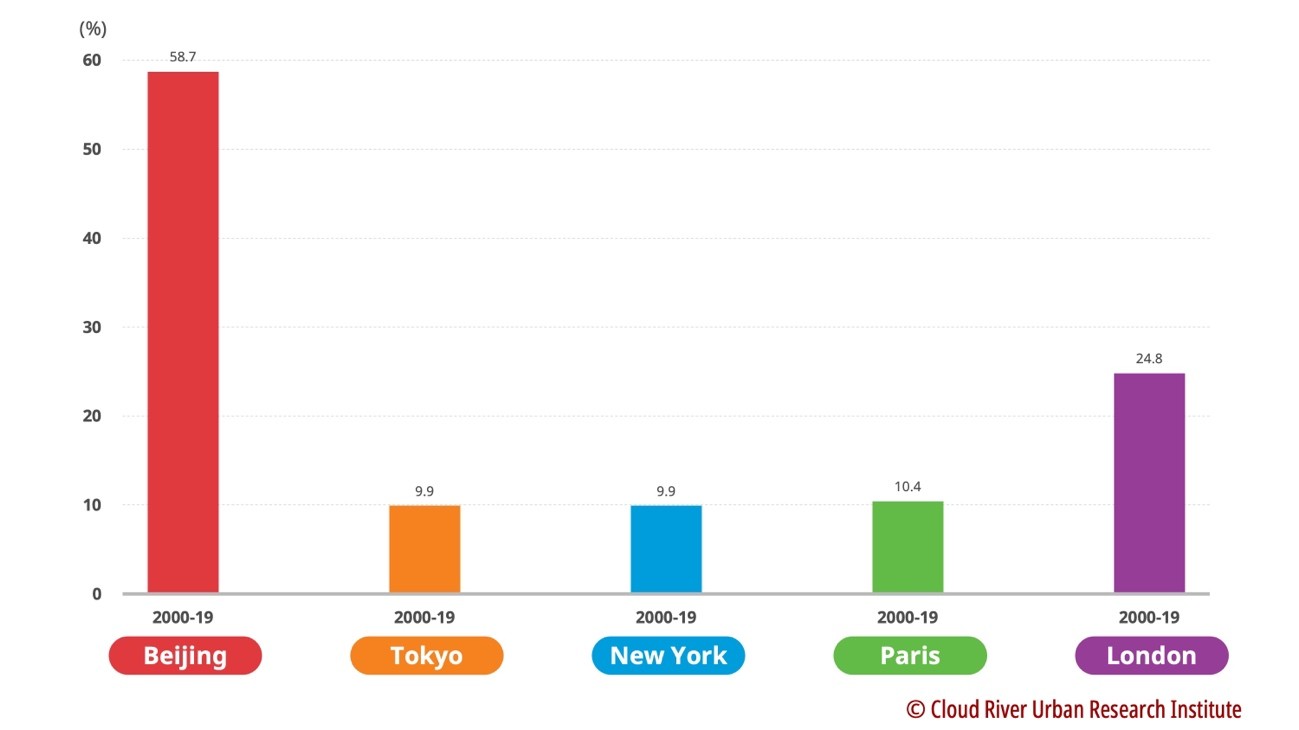
(3) The difference in population concentration

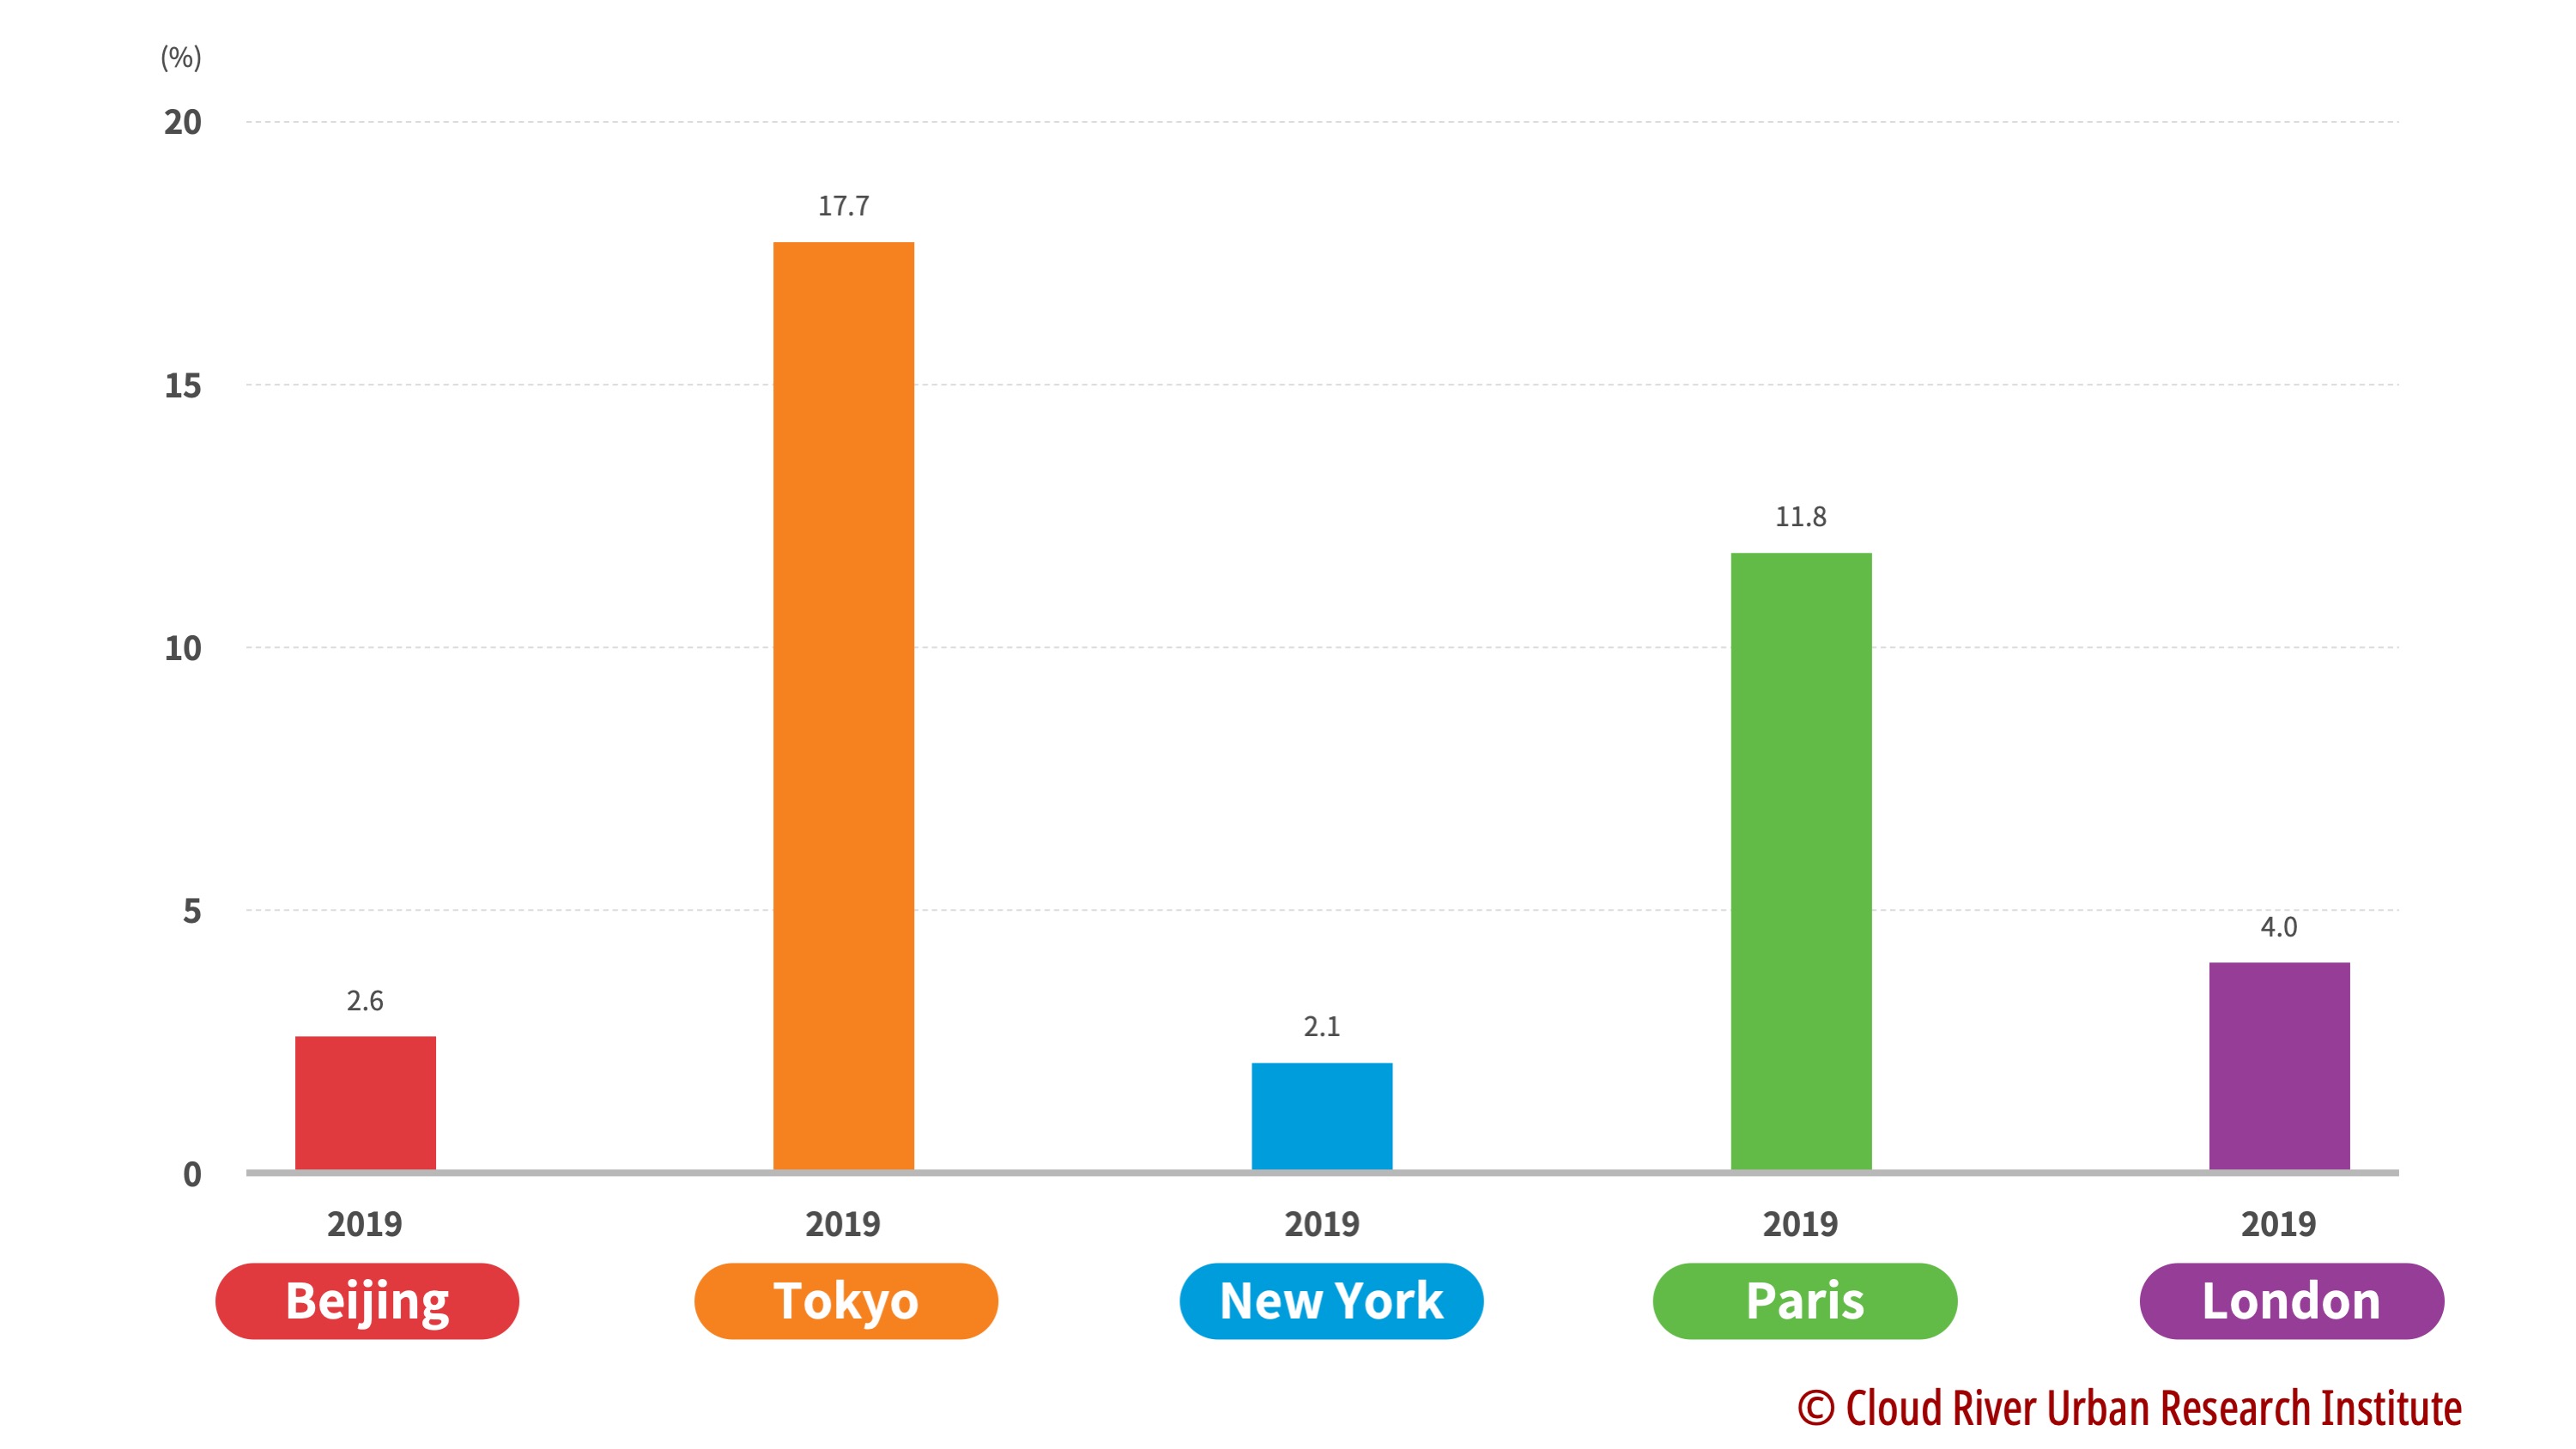
The population of the Tokyo megalopolis accounts for up to 29% of Japan’s total population, the highest among the four metropolises. The population concentration in the Tokyo megalopolis has become Japan’s biggest demographic feature.

Around 18.8% of the 65.13 million French are concentrated in the Paris megalopolis, while 13.3% of the 67.53 million British are concentrated in the London megalopolis.

In contrast, the population in the New York megalopolis only accounts for 6.1% of the U.S. population, which mirrors the demographic structure of a country with 329.07 million people.

In the world’s most populous country, the population is decentralized, concentrating in megacities around China. Although Beijing has a population of up to 21.54 million, it only accounts for 1.5% of the country’s total.

Figure 5. A comparison of Beijing with four major metropolises in terms of the proportion of its population in the country (2019)

2. Economic scale: Beijing grew by 13.3-fold over 20 years


Economic vitality is the biggest driver for population concentration. Although Beijing witnessed rapid economic growth in the past 20 years, its economic scale and its ability to draw global resources still lag behind the four major metropolises.

(1) Which city boasts the world’s biggest economic scope?

In 2019 before the COVID-19 outbreak struck the world, New York megalopolis had the largest GDP among the five cities, or 3.7 times that of Beijing. The second was the Tokyo megalopolis, whose economic scale was 3.3 times of Beijing’s. The GDP of Paris and London megalopolises were 1.7 times and 1.3 times that of Beijing, respectively. This indicates that there is still a gap between Beijing and the four major metropolises in terms of economic scale.

Figure 6. A comparison of Beijing with the four major metropolises in terms of economic scale (2019)

(2) Beijing’s economic volume grew by 13.3 times over the past 20 years

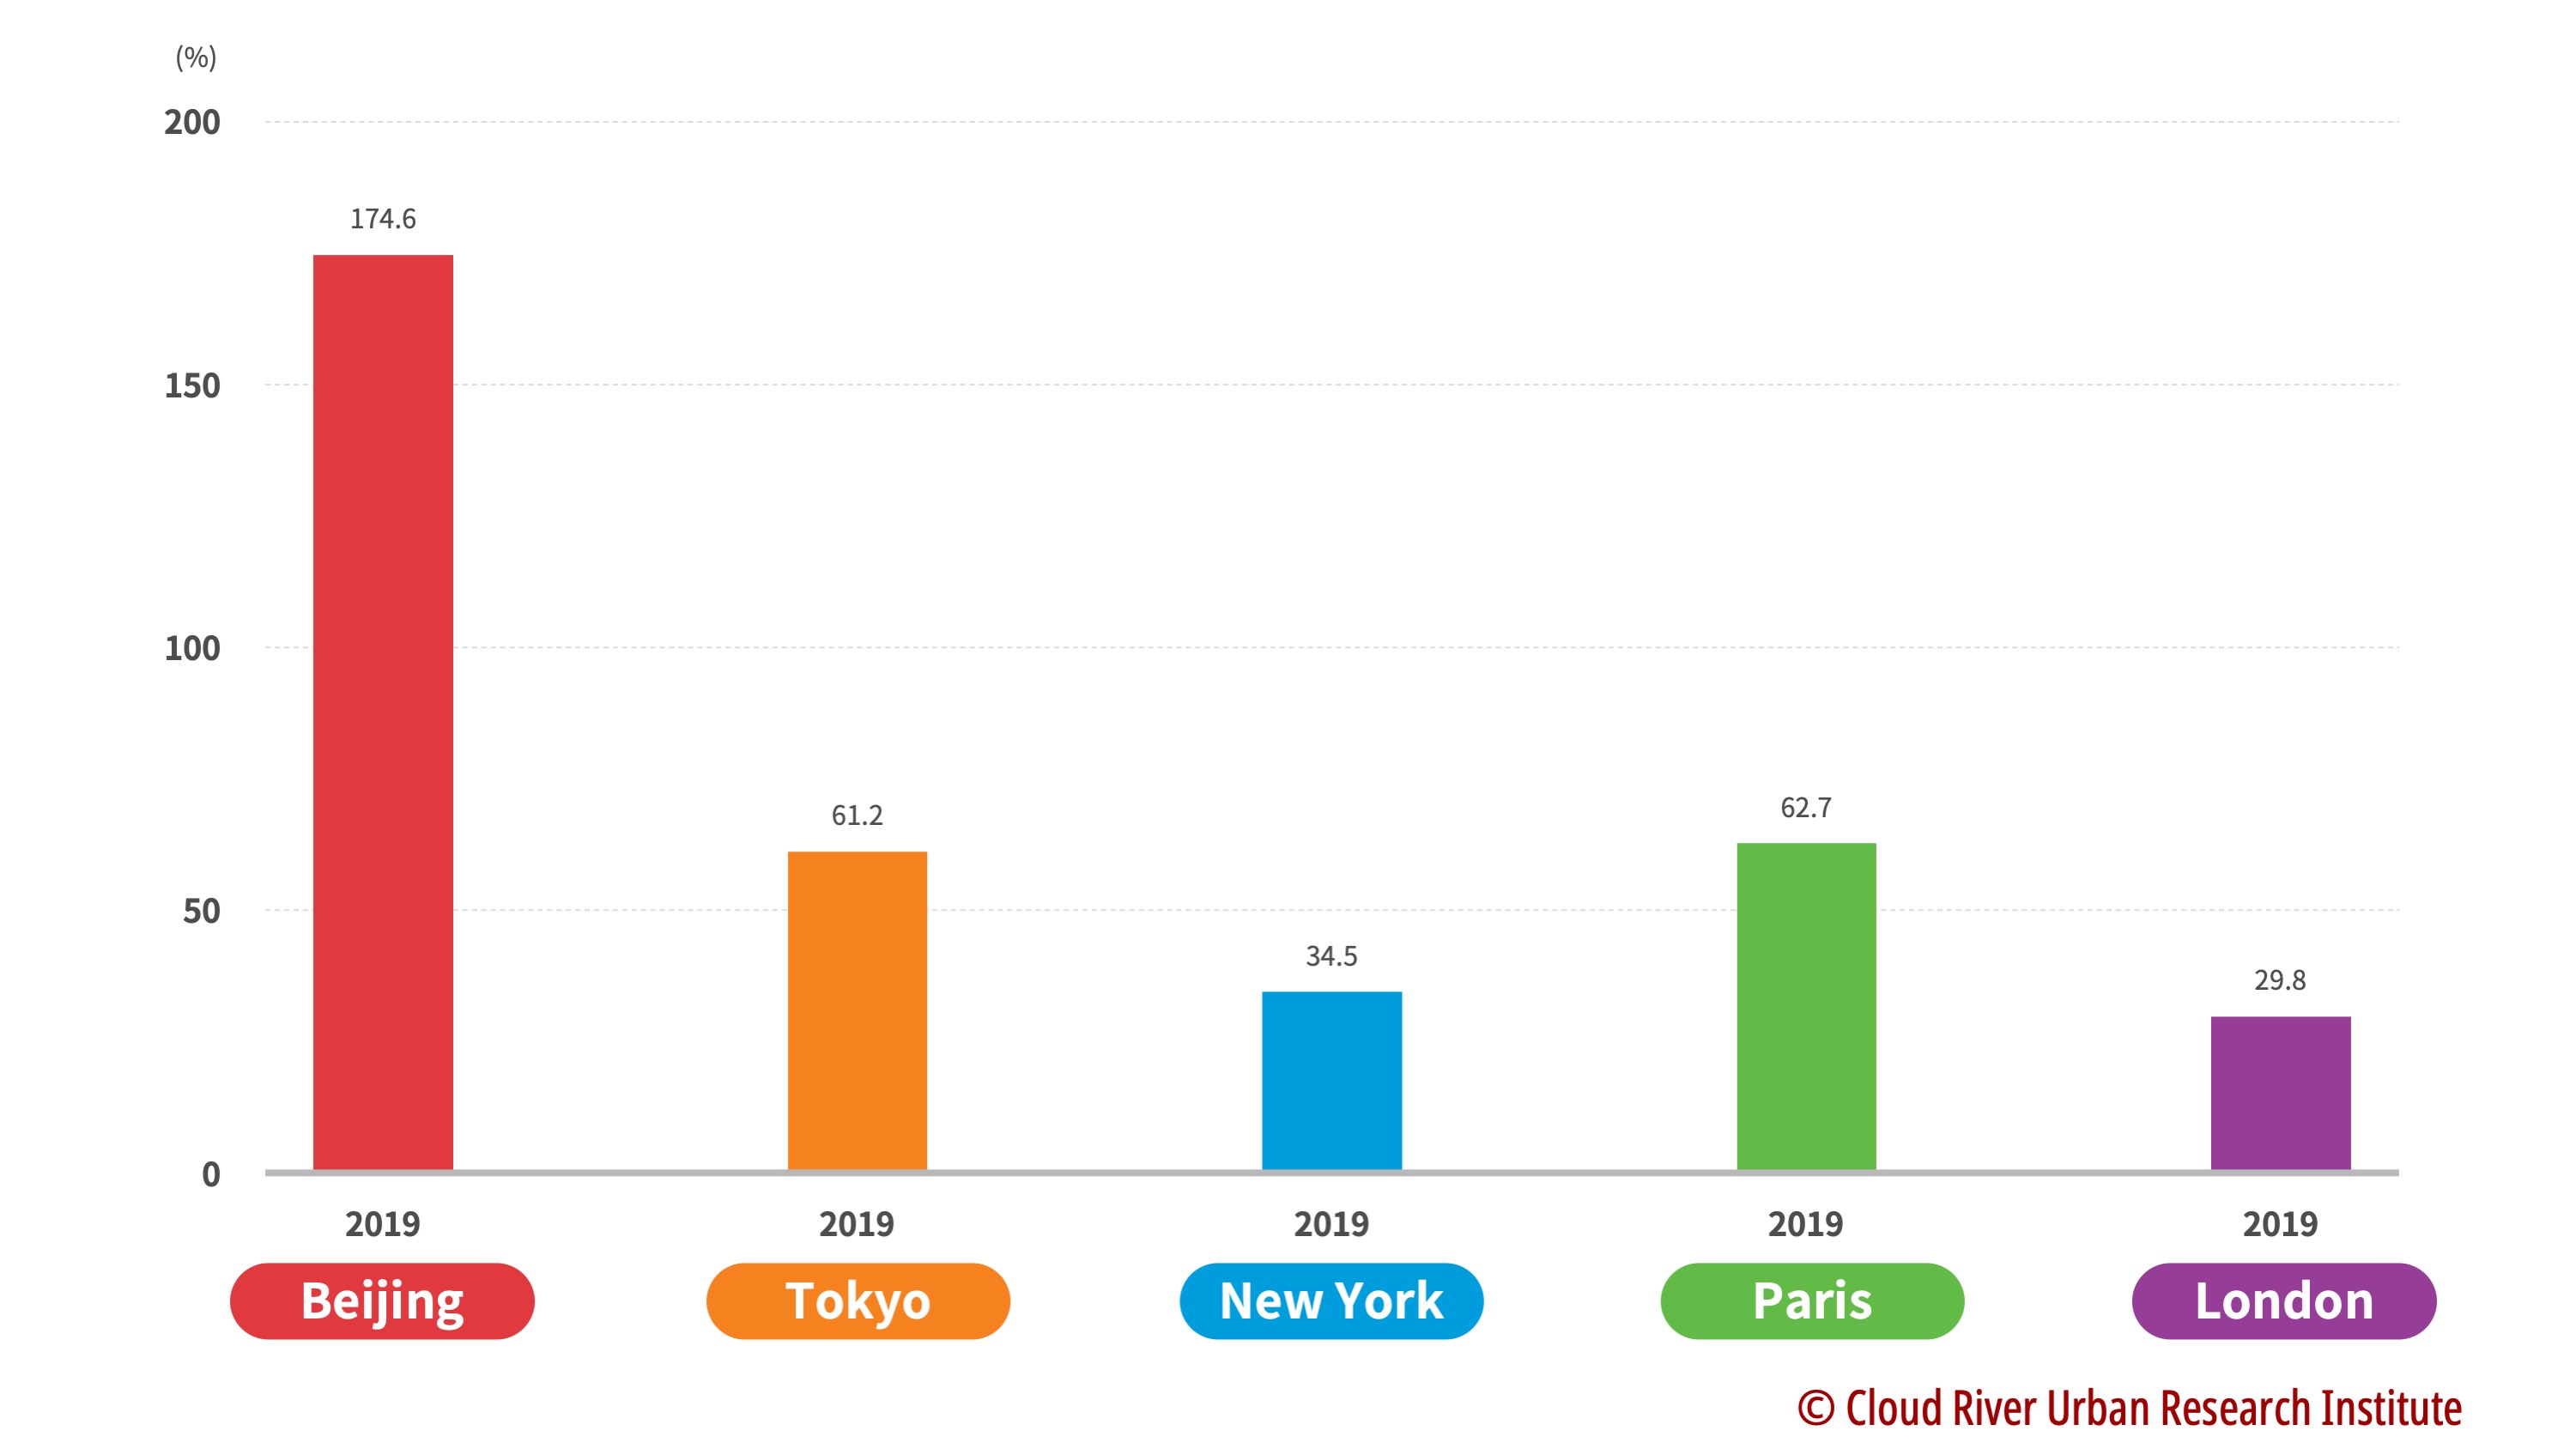
However, Beijing tops among the five metropolises in terms of economic growth rate. From 2000 to 2019, Beijing’s economic scale grew by 13.3 times, an economic miracle driven by the rapid development of the country. Over the same period, the New York megalopolis has saw its GDP doubled, making it the fastest-growing city among the four major metropolises. The economic scale of London, Paris and Tokyo megalopolises increased by 56%, 34% and 12%.

Figure 7. A comparison of Beijing with the four major metropolises in terms of economic growth (2000-2019)

(3) Contribution to the overall national economy

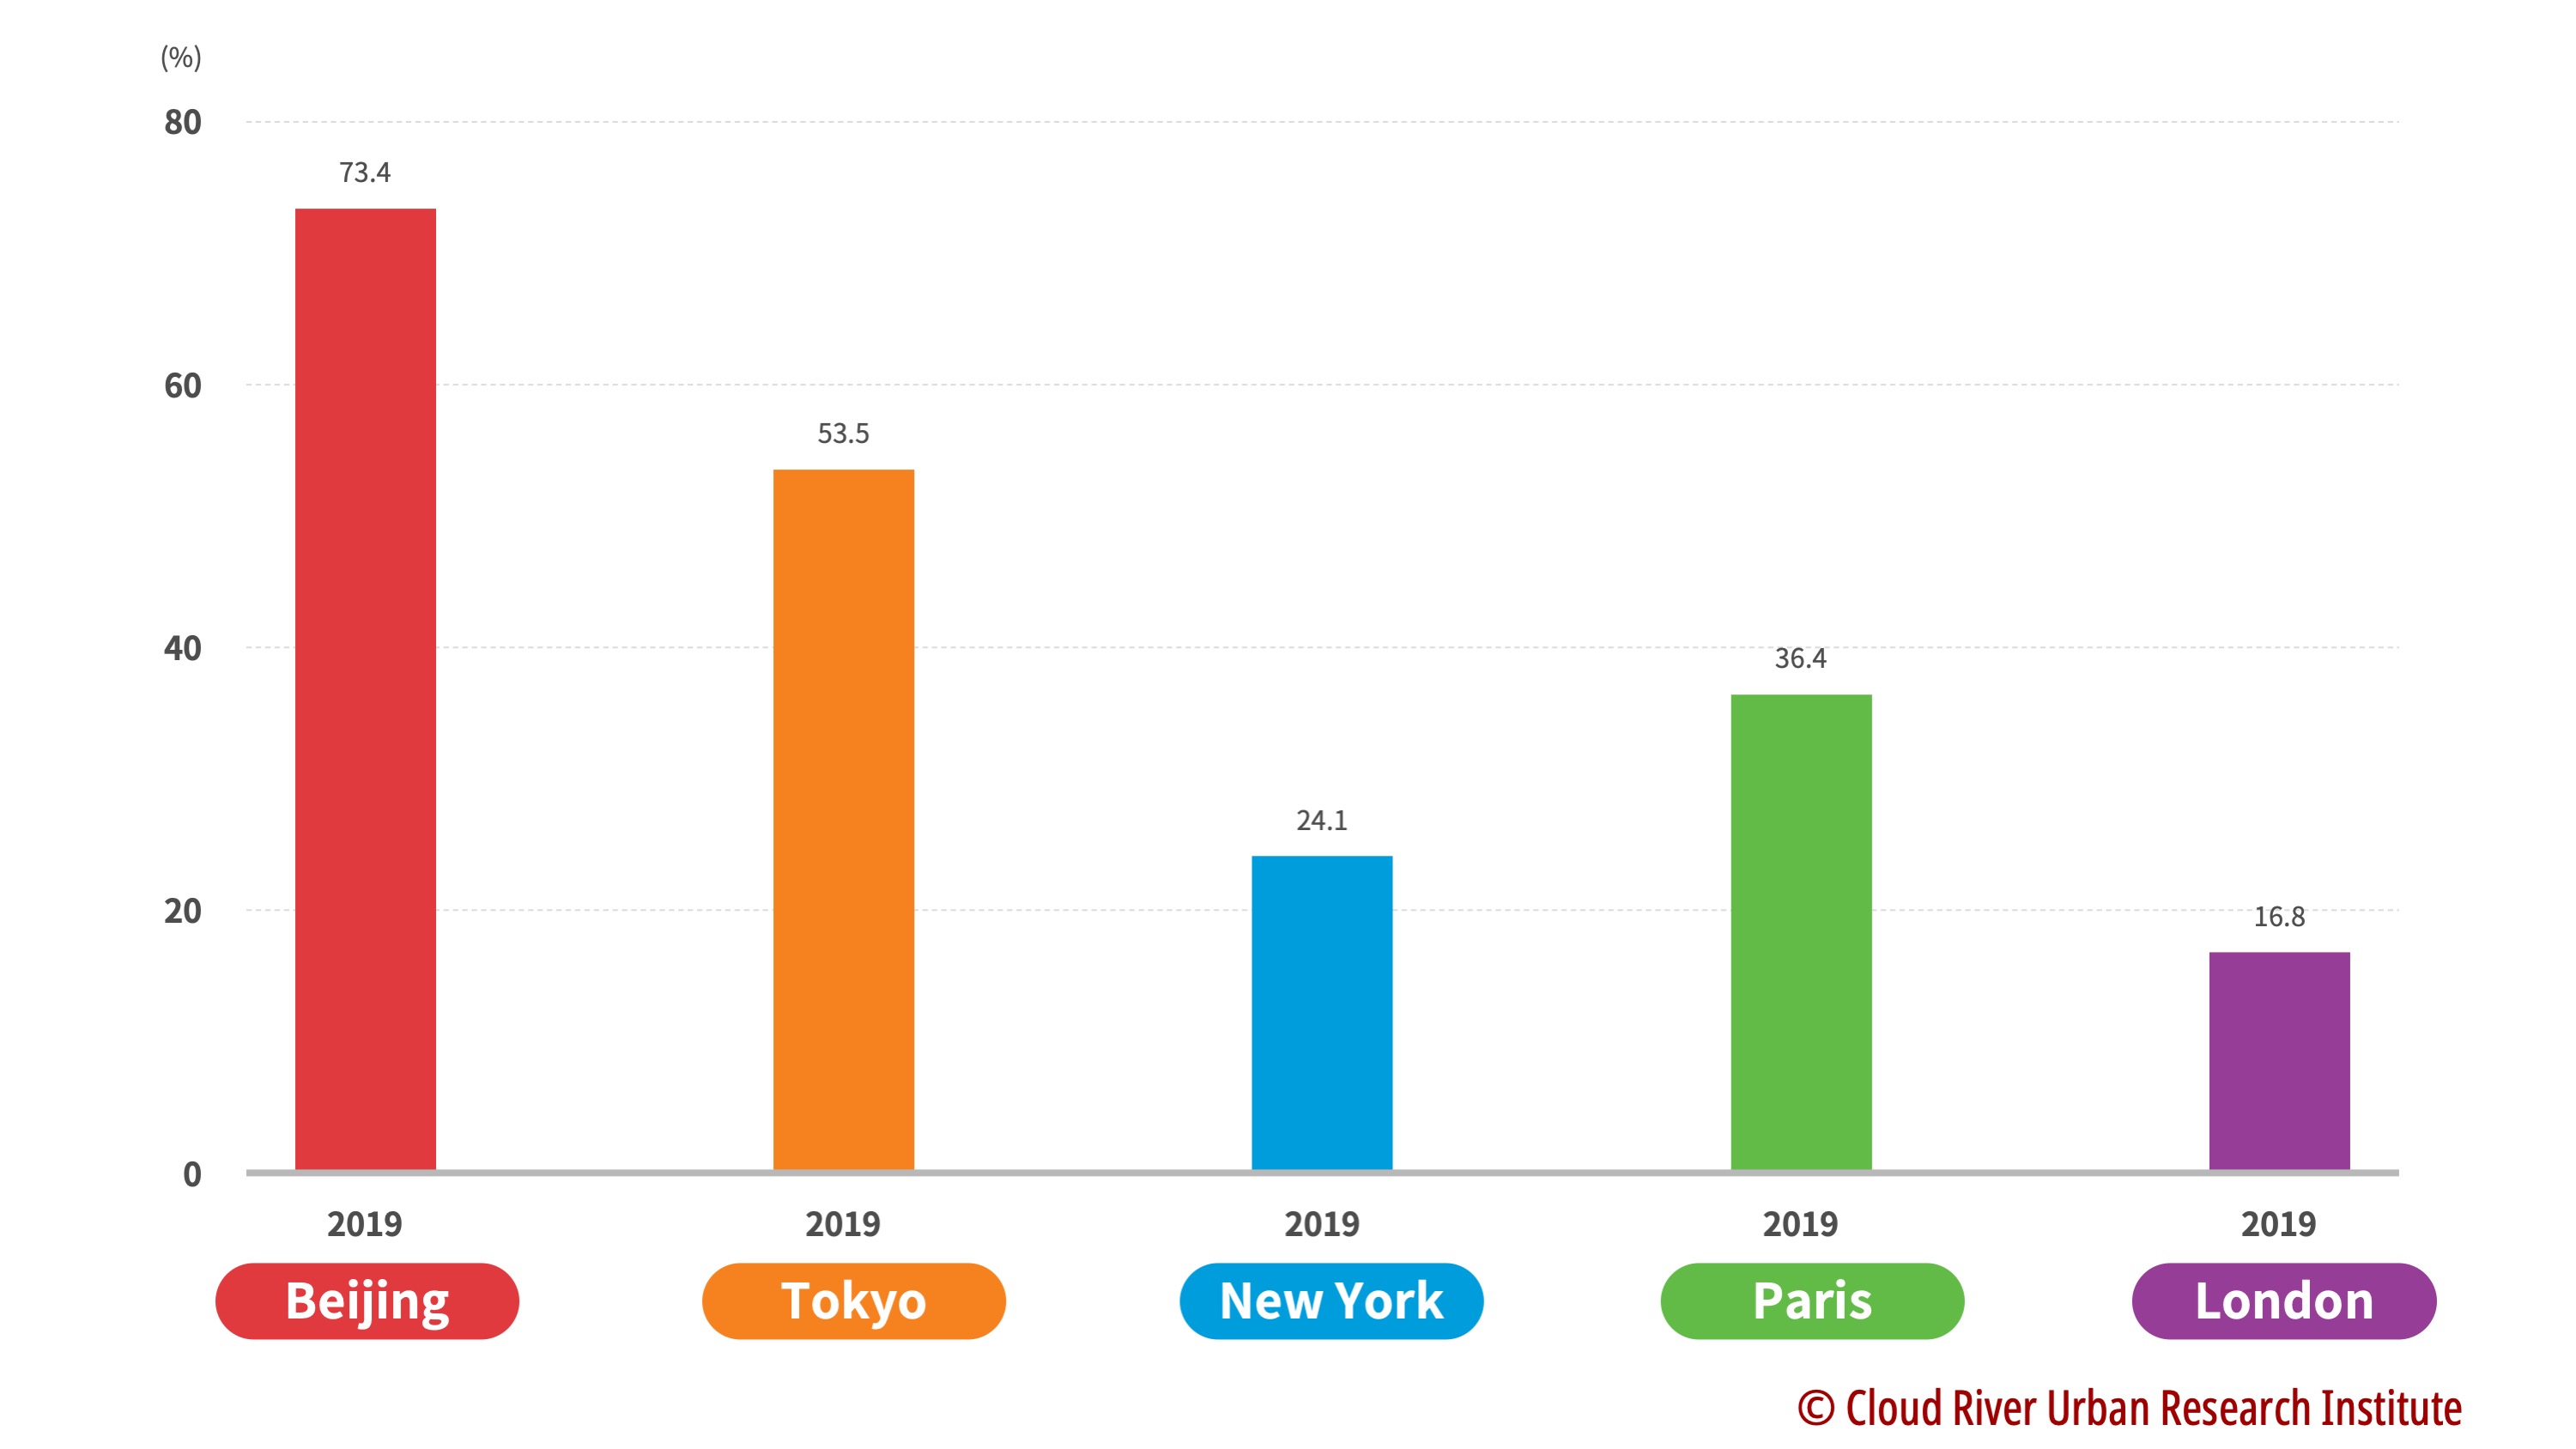
In 2019, the economic volume of the Tokyo megalopolis accounted for 33.1% of the national economy, ranking first among the five cities, followed by Paris’s 32.4% and London’s 23.6%. This has shown that Japan, France and the U.K. highly concentrate their economy in the capital economic circle.

The New York megalopolis contributes 8.8% to the U.S. economy, which is the lowest among the four metropolises because the country’s economy is more decentralized due to the large size of its territory and population. Although it boasts larger economic volume compared to other cities, the New York city only accounts for less than 10% of the economy.

Beijing only accounts for 3.6% of the national GDP partly due to the similar reason that the country’s economy is more decentralized and its territory and population is bigger than others. It also reflects that Beijing still lags behind major metropolises in its ability to pool global resources.

Figure 8. A comparison of Beijing with the four major metropolises in terms of their contribution to the economy (2019)

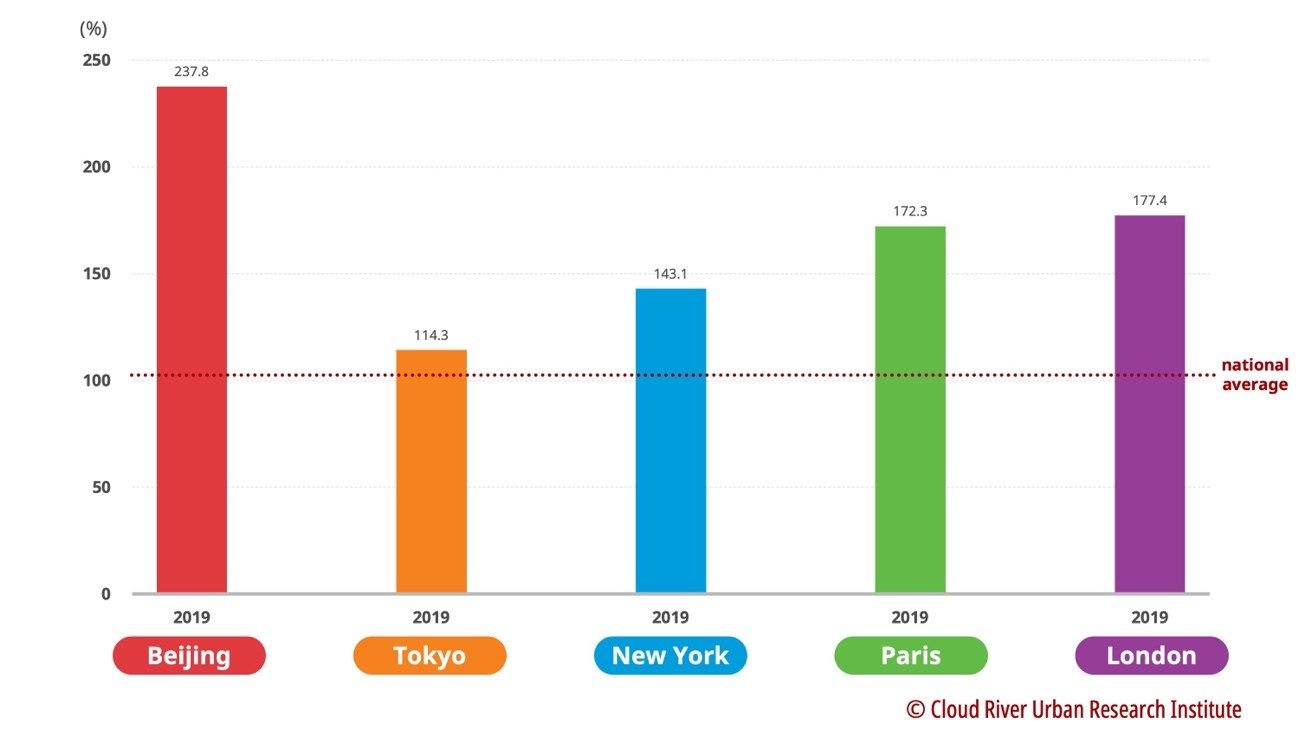
3. Beijing’s per capita GDP grew by 9.8 times over 20 years


Per capita GDP is an important indicator of economic development. Over the past 20 years, Beijing’s per capita GDP grew by nearly 10-fold. Today, Beijing’s per capita GDP is 2.4 times the national average.

(1) Global metropolis with the largest GDP

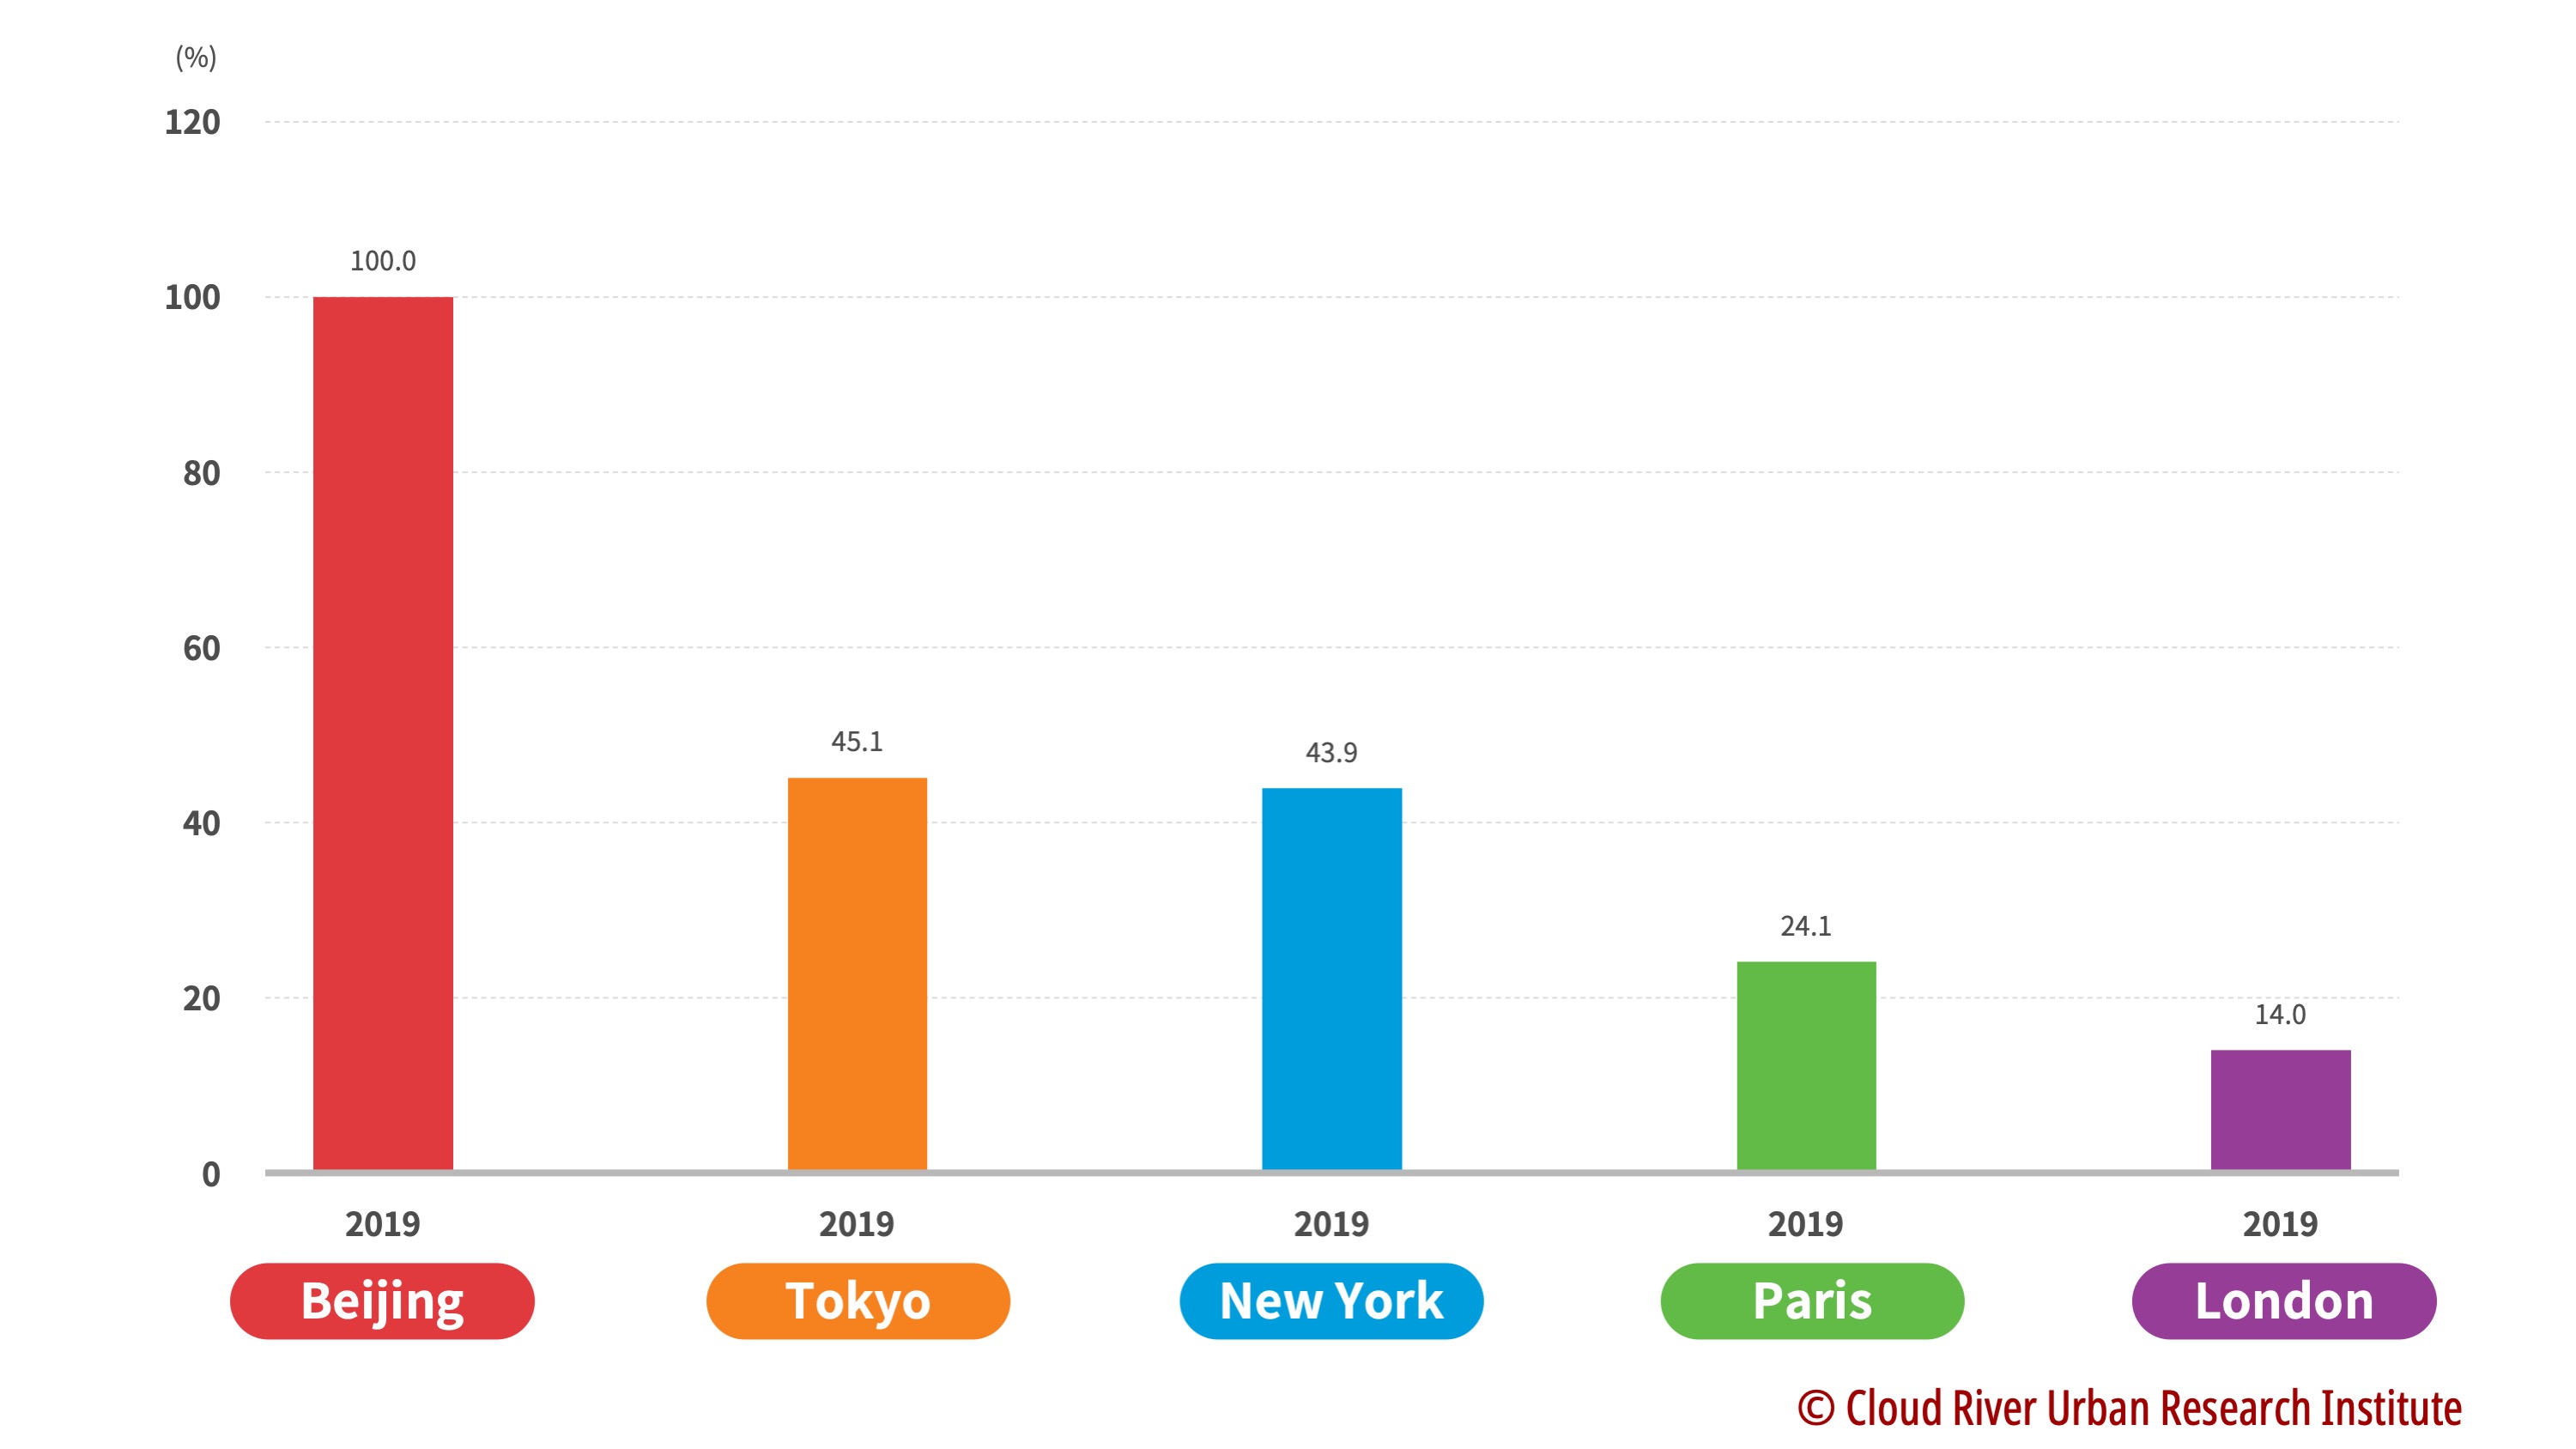
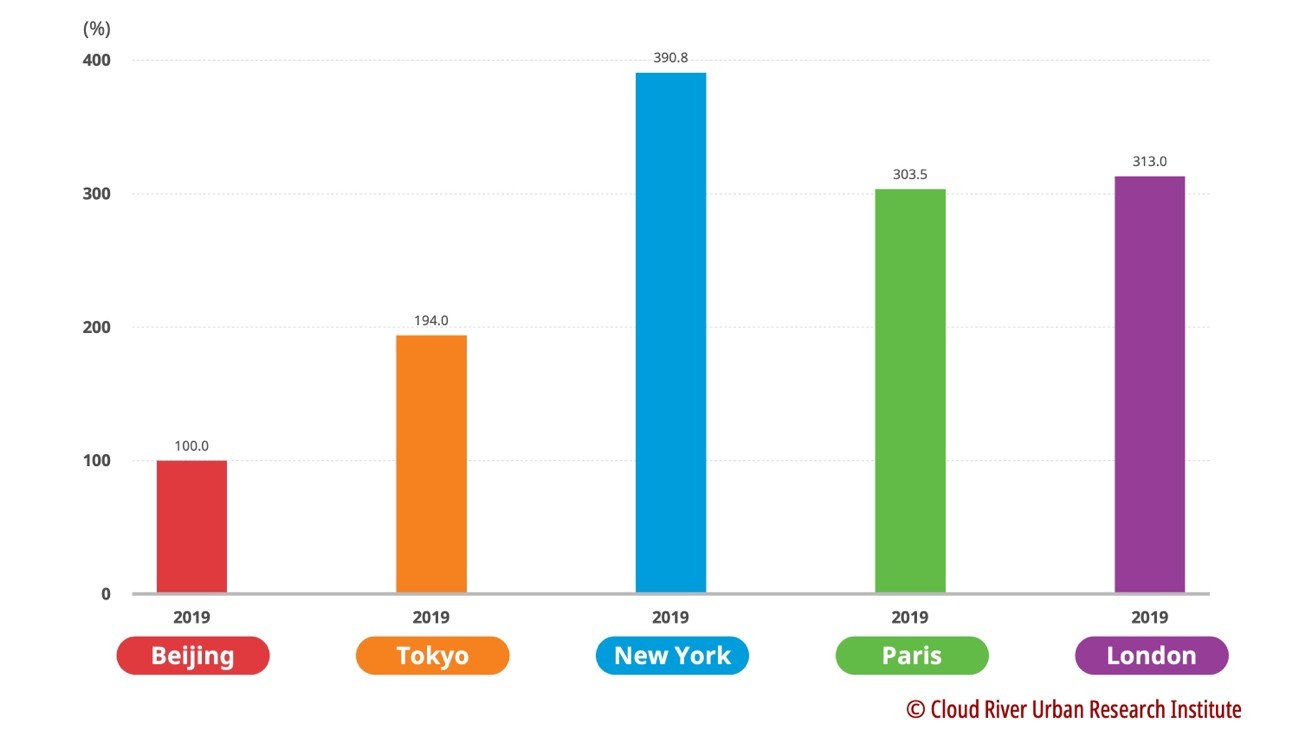
New York has the largest per capita GDP among the four metropolises, or about 3.9 times that of Beijing. The per capita GDP of London and Paris is 3.1 times and 3 times that of Beijing, respectively. Though slightly lower than the other three metropolises, Tokyo’s per capita GDP is 1.9 times that of Beijing’s.

Figure 9. A comparison of Beijing with the four metropolises in terms of per capita GDP (2019)

(2) The city with the fastest growing per capita GDP

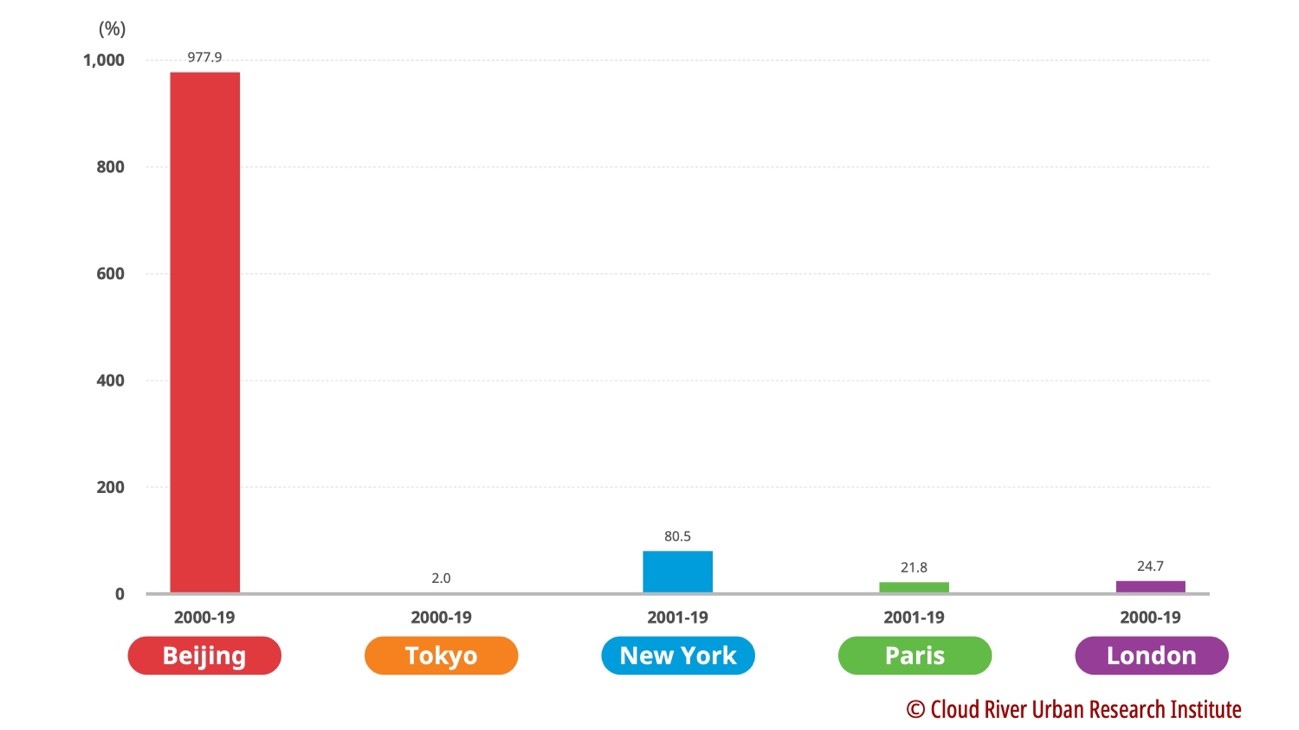
In the past 20 years, Beijing’s per capita GDP has grown by 9.8-fold. Thus, the economic wonder that Beijing created is not only reflected on its high-speed growth but on the rise of the per capita GDP.

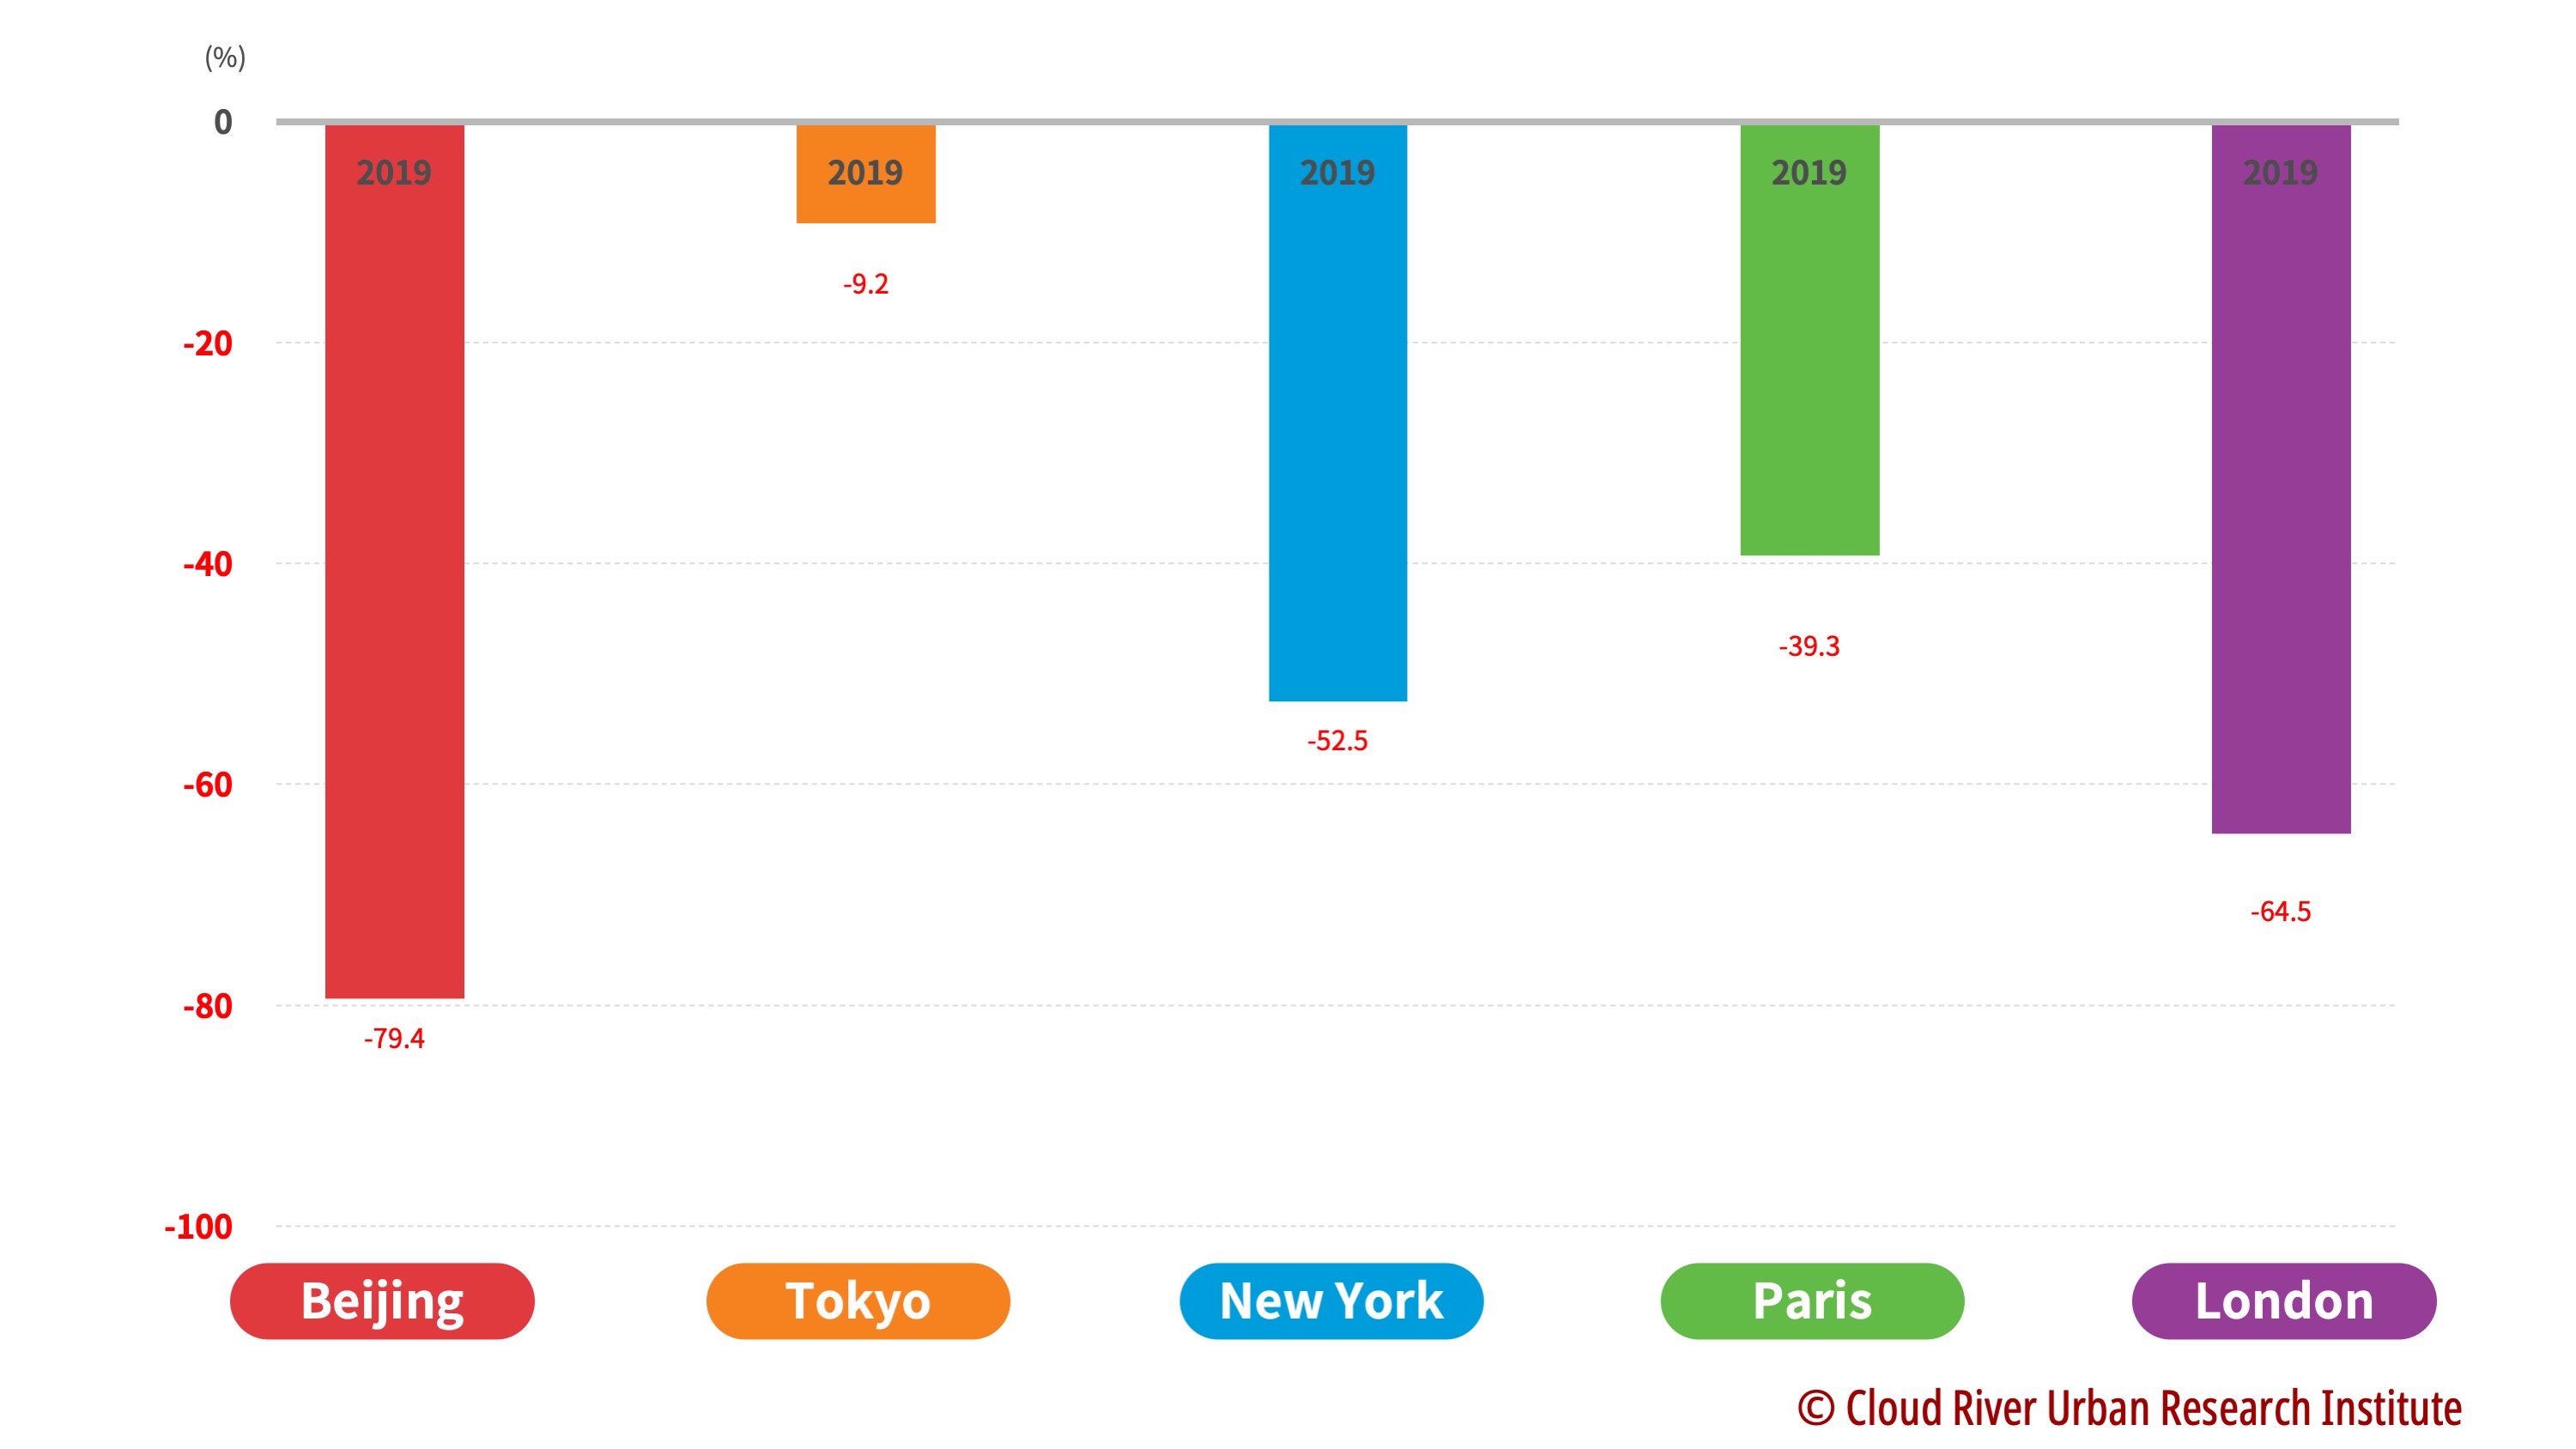
Among the four major metropolises, New York witnessed the largest growth of 80% in its per capita GDP over the past 20 years. Over the same period, London and Paris recorded 24.7% and 21.8% growth, respectively. The per capita GDP of Tokyo only increased by 2%, which vividly mirrored the economic stagnation that Japan went through after its economic bubble burst.

Figure 10. A comparison of Beijing with the four major metropolises in terms of per capita GDP (2000-2019)

(3) The development gap between metropolises and the rest of the country

Among the four major metropolises, the per capita GDP of London and Paris is 1.8 times and 1.7 times that of each of their national average. The New York city’s per capita GDP is 1.4 times that of the U.S. average. The international exchange hub function of the world metropolis, on the one hand, contributes to the vitality and efficiency of its economic development, and on the other, it is also the reason for population gathering.

Tokyo’s per capita GDP is only 1.2 times that of the national average, which is the answer to its long-term pursuit of balanced development.

Beijing’s per capita GDP is 2.4 times the national average, higher than that of the four major metropolises. On the one hand, this figure reflects the trend of megacities leading China’s economic development, and on the other, it also reflects the unbalanced development of China’s economy.

Figure 11. A comparison of Beijing with the four major metropolises in terms of their per capita GDP against the national average (2019)

4. Conclusion


From the above analysis, we can conclude that the global population continues to concentrate in megacities. With continued population growth, the development of theses megacities determines the demographic structure of the country.

(1) The population continues to concentrate in megacities

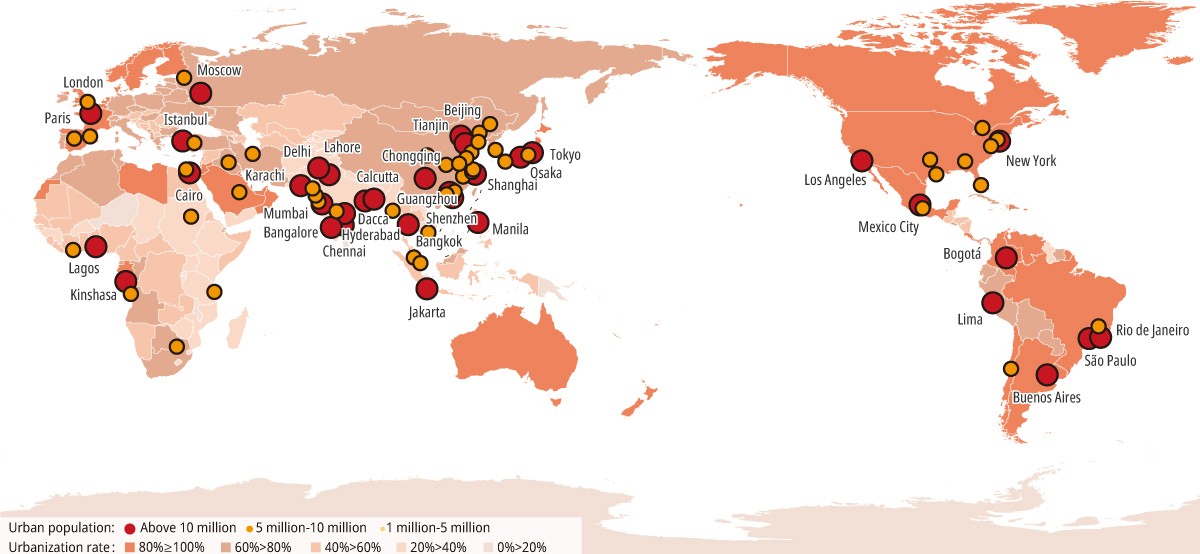
If cities with a population of more than 10 million are defined as megacities, the trend of economic and population concentration in megacities is becoming more and more intense globally. 

In 1950, there were only two megalopolises in the world, Tokyo and New York, with a population of more than 10 million. Twenty years later, in 1970, the Osaka megalopolis had been added to the list. However, as urbanization speeds up after 1980, the number of megacities worldwide rose to 34 in 2020, which are home to a total of 560 million citizens, accounting for 16.3% of the global population.

The reason behind was the sudden acceleration of the IT revolution and the globalization process after the 1980s. 

Because of this, these megacities have evolved or are evolving into world metropolises with their economies taking off based on international exchanges.

Figure 12. A map of megacities around the world

(2) Economic development of global megacities continues

From the above analysis, world metropolises like New York, London, Tokyo and Paris have continued economic development and population growth in the past 20 years. The reason why these cities can sustain economic growth in developed countries with slow or stagnated economic growth are attributed to the following reasons:

First, these world metropolises are not only international hubs for finance, information and people-to-people exchanges, but also evolve into the center for the digital economy. Economic development based on international exchanges has paved the way for urban economic development under the context of the evolving international landscape.

Second, these world metropolises have successfully resolved or mitigated the problems caused by the concentration of population and increased the city’s capacity and density. For example, the Tokyo megalopolis has serious urban diseases when its population hit 10 million but those problems are mitigated today as the population approaches 40 million.

(3) Megacities contribution to the national economy in different countries

In post-war Japan, the high concentration of economy and population in the Tokyo megalopolis has always been regarded as a problem that needs to be overcome by the concerted efforts of the whole country. There are two reasons why Japan needs to devote so much policy efforts to solve the polarization problem:

First, the huge concentration of population in Tokyo has caused serious “urban diseases” in the environment, transportation, housing, living, education, etc.

Second, the continuous inflow of population in Tokyo has made other parts of the country less dynamic.

After decades of efforts, most of the “urban diseases” in the Tokyo megalopolis has been mitigated or resolved, but the population outflow from other areas of Japan remains a major concern for economic inertia in the regional economy. The U.K. and France have similar demographic problems.

On the contrary, China and the U.S., because of their vast territory and large populations, have many megacities around the country. The multi-polarization of population and the economy help rebalance their demographic structures. Therefore, it is essential for China to implement an urbanization policy combining large urban agglomerations with megalopolises in order to form a healthy demographic structure in the country.


(Researchers at Cloud River Urban Research Institute Kurimoto Kenichi, Zhen Xuehua, and Zhao Jian contributed to data compilation and graphic production in the article.)


The article was first published on China SCIO, China.org.cn on Aug. 15, 2022 and reprinted by other news websites.

A look at strength of Chinese cities in auto industry

Cloud River Urban Research Institute


Editor’s note:

Which country is the biggest auto manufacturer? Which country has the biggest auto market? Which Chinese city has the strongest auto industry? Cloud River Urban Research Institute draws on the “radiating strength” of the auto industry in its China Integrated City Index to answer these questions.


The world’s largest auto manufacturer


The auto industry has been hit hard during the pandemic. The global auto production in 2020 slumped to 77.62 million units, down by 15.8% from the 2019 level. In 2021, the global auto production rallied to 80.15 million units, but the figure was only 82.4% of the peak level in 2017.

The auto industry represents a country’s comprehensive strength in manufacturing. China has been the world’s largest auto manufacturer. Figure 1 shows that China tops the ranking with a production of 26.08 million units. The figure accounts for 32.5% of the global total, more than tripling that of the U.S., which ranks second. China’s auto output outnumbers that of other top five countries combined – the U.S., Japan, India, and the Republic of Korea. 

Figure 1 Top auto manufacturers by country/region in 2021

WTO admission boosts China’s auto industry


The trajectory of auto production from 2000 to 2021 in Figure 2 shows that, China’s auto industry took off in 2001 when the country joined the WTO. Its auto industry leapfrogged the U.S. to become the world’s second largest auto manufacturer in 2008, then replaced Japan as the world’s top auto manufacturer amid the financial crisis in 2009, and has since roared ahead.

Japan replaced the U.S. to become the world’s largest auto manufacturer in 2006, but was dethroned by China in 2009, and then slipped into third place after being surpassed by the U.S. in 2011. Japan has since then been put in the shade with China and the U.S. keeping their widening lead. 

Figure 2 Top auto production by major countries from 2000 to 2021

China’s auto exports gain momentum despite the pandemic


The pandemic dealt a heavy blow to the global supply chain and the auto export alike. Figure 3 shows that the world’s top 30 auto exporters, excluding China and Slovakia, saw decreases in auto exports in 2020, some even registering a double-digit decline. In 2020, China bucked the trend to achieve a 3.4% growth rate, while the global exports slipped by 14.7%. 

China, however, came in fifth in the ranking of auto exports despite the sheer size of its auto manufacturing. Professor Zhou Muzhi, head of Cloud River Urban Research Institute projected that while automobiles produced in China are largely consumed by the domestic market with low export rates, the world’s largest auto manufacturer is set to become the world’s largest auto exporter buoyed by a large market. 

Figure 3 Top auto exports by country/region in 2020

Two juggernauts of the world’s auto industry


The ranking of car ownership worldwide in Figure 4 provides basis for Zhou’s projection. The top two countries in the ranking – the U.S. and China – leave Japan in third place way behind, with a combined 35% of the world’s car ownership. The figure is even higher than the combined car ownership of countries in places from third to 12th. It is fair to say that China and the U.S. are two juggernauts of the world’s auto industry.

Figure 4 Top car ownerships by country/region in 2019

Which country has the most open and diversified auto market?


In Figure 5, the U.S., reigning in the ranking, accounted for 20% of the world’s total auto exports in 2020, more than doubling the figure of Germany, which takes second place in the ranking.

Despite ranking second in terms of auto production, the U.S. has to import a large number of automobiles from Germany and Japan. Germany is the world’s largest auto exporter and the world’s second largest auto importer. Different from the U.S. and Germany, Japan’s auto imports only rank 15th in the world. Due to its reluctance to import yet strong exports, the auto industry remains Japan’s largest export sector. 

Despite ranking third in terms of auto imports, China has exported more vehicles than imported vehicles, emerging as a net exporter.

Figure 5 Top auto imports by country/region in 2020

Auto industry becomes pillar of Chinese economy


The auto industry is a pillar that props up China’s economic growth. Figure 6 shows China tops the ranking of the value added of the auto industry. China occupies 28.1% of the global value added of the auto industry in 2019, twice that of the U.S. in second place. 

The high added value present in the market will pit automakers worldwide against each other. The auto industry has rapidly grown into a pillar of China’s economy.

Figure 6 Ranking of the value added of the auto industry by country/region in 2019

Which city has the strongest auto industry?


China Integrated City Index observes 297 Chinese cities at prefecture level and above based on their “radiating strength” in the auto industry. Radiating strength is an index used to assess the influence of a certain industry of a city. Auto radiating strength is an index based on the auto industry’s payrolls, enterprise concentration, and enterprise capital. “The radiating strength of the auto industry of Chinese cities” also looks to data from the Fourth National Economic Census issued by Chinese cities between 2019 and 2020. 

The top 10 cities in the ranking of “the radiating strength of the auto industry of Chinese cities” in 2020 are Shanghai, Changchun, Chongqing, Guangzhou, Wuhan, Suzhou, Beijing, Shiyan, Tianjin, and Xiangyang. Among them, the top three cities gain a dominant lead over other cities. 

Shenyang, Liuzhou, Wuxi, Chengdu, Nanjing, Wuhu, Ningbo, Nanchang, Changzhou, Hangzhou, Changsha, Shenzhen, Jinan, Wenzhou, Xi’an, Qingdao, Foshan, Hefei, and Zhengjiang take places from 11th and 30th. Zhou concluded that headquarters and flagship factories of vehicles and auto parts mostly cluster in the top 30 cities. 

Figure 7 Top Chinese cities in terms of radiating strength in the auto industry in 2020

China’s auto industry took off in 1953 when its first auto factory was established in northeastern China’s Changchun by dint of technologies provided by the Soviet Union. Since reform and opening up in 1978, many foreign auto makers have set up manufacturing bases in China. Chinese automakers have grown rapidly due to their cooperation and competition with their foreign counterparts, turning China into the world’s largest auto manufacturer. 

As shown in Figure 8, the top 30 cities in the ranking spread across the country, with Shanghai in the east, Chongqing and Chengdu in the west, Changchun in the north, and Shenzhen in the south. Zhou said, such a distribution is a result of China’s auto industry policies since the founding of the PRC, as these cities home to auto makers cover industrial bases in China’s northeastern, southwestern, northwestern and coastal areas. 

Figure 8 Map of top 30 Chinese cities in terms of strength in the auto industry in 2020

Industrial concentration 


As shown in Figure 9, the top five cities in the ranking – Shanghai, Changchun, Chongqing, Guangzhou, and Wuhan – account for almost one fourth of the payrolls in the auto industry in the country. The proportion is 39.5% and a whopping 70.6%, when the top 10 cities and the top 30 cities are put in the perspective, respectively. That shows the auto industry clusters in these cities. 

Figure 9 Concentration of payrolls in the Chinese auto industry in 2020

In terms of sales, Figure 10 shows that the top cities in the ranking account for 36.3% of the national auto sales. The proportion is a staggering 51.3% and 81.1%, when the top 10 cities and the top 30 cities are put in the perspective, respectively.

Zhou said these proportions reflect that China’s auto industry highly concentrates in these cities that can deliver more profits in the auto industry than other cities. 

Figure 10 Concentration of sales in the Chinese auto industry in 2020

Revolution of EVs


Electronic vehicles (EVs) have reshaped the global market and came as a boon to China’s auto industry.

In 2021, the global EV sales reached 6.5 million units, up 108% year on year. China took the first spot with 2.94 million units, accounting for 45% of the global sales.

Tesla was the world’s largest EV manufacturer in 2021, followed by BYD and SAIC Motor. The top 20 auto makers contributed a combined 47.63 million units in sales, accounting for 73.3% of the global sales. Eight Chinese EV manufacturers made the top 20 list. As Tesla has a gigafactory in Shanghai, about 40% of the world’s EVs were produced in China. Japan only had one automaker among the top 20, despite the fact that Japan is a large auto manufacturer. In 2021, China exported 500,000 EVs, tripling its 2020 level. The strong showing catapulted China into the top of the echelon as the world’s largest EV exporter, followed by Germany and the U.S. 

Data from U.S. consultancy Companys Market Cap revealed that driven by its strength in EV production, BYD overtook Volkswagen to become the world’s third most valuable automaker in June 2022, behind Tesla and Toyota.

Zhou predicted that Chinese-made EVs will dominate the global market in the near future.


The article was first published on China SCIO, China.org.cn on Aug. 15, 2022 and reprinted by other news websites.

Which city has the world’s largest container port? A look at Chinese container ports by convenience

Cloud River Urban Research Institute


Editor’s note:

Where is the world’s most active container ports? Which city has the world’s largest container throughput? Which city in China has the most convenient container port? Why the global container transport is highly concentrated in China’s Yangtze River Delta region and the Pearl River Delta region? Cloud River Urban Research Institute, using the “container port convenience” in its China Integrated City Index (CICI), gives answer to these questions using both graphic and textual interpretations.


China has the world’s busiest container ports


The COVID-19 pandemic has brought a long-lasting turmoil to the global supply chain and maritime transport. In 2020, the global container throughput dropped by 1.2% year-on-year. Thanks to the dynamic zero-COVID policy, China bucked the trend and quickly resumed socioeconomic activities with its container throughput increasing by 1.2% year-on-year in 2020.

As Figure 1 suggests, China’s mainland ranks first with an overwhelming advantage compared with other countries and regions in terms of its overall container throughput in 2020. The second to the 10th in the ranking are the United States, Singapore, the Republic of Korea (ROK), Malaysia, Japan, the United Arab Emirates (UAE), Turkey, Germany, and Hong Kong.

Figure 1 Top 30 countries and regions
in terms of container throughput in 2020

As Figure 2 shows, the top 10 countries and regions in terms of container throughput in 2020 took 59.8% of the world’s total, while the top 30 took up to 86.5% of the overall share. That is to say, these 30 countries and regions, which have the most active supply chains, accounted for nearly 90% of the global container throughput in the year 2020.

It is worth mentioning that China’s mainland took an overwhelming 30.1% of the global container throughput in 2020. If we combine the amount of the Chinese mainland with that of Hong Kong, the overall figure even exceeds the other 10 among the top 12 have combined. According to Professor Zhou Muzhi, president of Cloud River Urban Research Institute, “container transport is the logistical foundation of the global supply chain and the container throughput measures the activeness of the global supply chain. China’s overwhelming advantage in the ranking of global container throughput truly reflects its core status in the global supply chain.”

Figure 2 The concentration of global container throughput in 2020

Which city has the largest container throughput?


As Figure 3 shows, the world’s top 10 cities in terms of container throughput are Shanghai, Singapore, Ningbo-Zhoushan, Shenzhen, Guangzhou, Qingdao, Busan, Tianjin, Hong Kong and Rotterdam. The fact that China took seven of the top 10 demonstrates the country’s overwhelming position in container transportation.

Among the top 30 cities in the ranking, China took 12 (including Hong Kong and Kaohsiung) and Asia took 21. Professor Zhou said, “The ranking signals a new era for Asia has arrived.”

Besides Beijing, only U.S. had more than one city in the top 30 – Los Angeles took the 17th spot, Long Island 19th, and New York-Jersey 20th. Japan, the world’s third largest economy, had only one spot in the ranking, with the Keihin region coming in at 21st. 

Figure 3 Top 30: The businesses container ports in the world in 2020

Which is the Chinese city with most convenient port?


Amid accelerated globalization, port is key to the operation of supply chains and vital to a country and a city. The Index uses “container port convenience” to analyze and evaluate 297 cities at prefecture-level and above across China.

Container port convenience is an index based on data such as the straight-line distance from the city center to the port and the port container throughput. As shown in Figure 4, Shanghai, Shenzhen, Ningbo, Qingdao, Tianjin, Guangzhou, Xiamen, Rizhao, Suzhou and Dalian were the top 10 Chinese cities in terms of urban container port convenience in 2020. Among them, Shanghai made the strongest showing.

Among the top 30 cities, Dalian is the only city whose container throughput declined in 2020. Despite the fallout of COVID-19, most port cities in China managed to achieve container throughput growth, which shows the strong export prowess of the manufacturing industry.

Figure 4 Top 30 cities in terms of container port convenience 

Container shipping concentrates in certain port cities


As Figure 5 indicates, in 2020, the top five cities in terms of container port convenience accounted for 52.1% of the country’s total container output at ports, the top 10 accounted for 71.4%, and the top 30 accounted for a staggering 89%. These portions demonstrate China’s container shipping mostly concentrates in some certain port cities.

Figure 5 Concentration rate of Chinese cities’ port container throughput  

Figure 6 is a GIS-based map of port container convenience, visualizing the top 10 Chines cities. The color, length, and width indicate degrees of their port container convenience.

Professor Zhou pointed out that the visualized map shows how China’s port container shipping or the global port container shipping is concentrated in the Yangtze River Delta and the Pearl River Delta, which can be explained by the fact that the regions are home to the largest industrial clusters for global supply chains.

Figure 6 Visualizing top 10 Chinese cities
by port container conveniences in 2020 


The article was first published on China SCIO, China.org.cn on Jul. 22, 2022 and reprinted by other news websites.

Zhou Muzhi: Identify Beijing’s path to carbon peak and neutrality by benchmarking against four major metropolises

Zhou Muzhi, head of Cloud River Urban Research Institute


Editor’s note:
At a time when carbon peak and neutrality has become one of the most important national strategies, all cities are looking for their own paths to it. Professor Zhou Muzhi, head of Cloud River Urban Research Institute, made a comparative study of carbon dioxide emissions of Beijing and four major metropolises worldwide — New York, London, Tokyo, and Paris — based on the latest results of satellite data parsing and geographic information system (GIS) analysis to nail down gaps in between scientifically, providing Beijing and other Chinese cities an exhaustive “physical examination report” on carbon peak and neutrality strategy.


New York, London, Tokyo, and Paris are recognized as four major metropolises worldwide. They are hubs of economic and cultural exchange in the world and benchmarks of the development of global cities. Beijing, as the capital of China, leads in China’s political, cultural, scientific and technological, and economic development, and ranks first in China Integrated City Index over the years. Therefore, it is an important research approach to identifying Beijing’s path to carbon peak and neutrality by comparing it with the four major metropolises in carbon dioxide emissions.

However, the four major metropolises have all spread out beyond the boundaries of cities in actual form into megalopolises. For example, Tokyo megalopolis comprises the Tokyo Metropolis and the prefectures of Kanagawa, Chiba, and Saitama. Therefore, megalopolis represents the actual state of the four major metropolises. Despite so, this form of city, which spreads out across administrative divisions, makes it harder for studying the real states of the four major metropolises.

Through years of efforts facilitated by satellite data parsing and GIS analysis, Cloud River Urban Research Institute accurately determined the scope of these megalopolises, and precisely analyzed their population size, distribution, and density. For example, by defining areas with more than 5,000 people per square kilometer as a Dense Population District (DID), it made an accurate and effective analysis of their population density and megalopolis scope.

Therefore, as shown in Figure 1, all the numerical values of the four major metropolises in this article were calculated based on megalopolis scope.

Figure 1. Scope and DID analysis of New York, London, Tokyo, and Paris megalopolises

Note: Please refer to Table 1 for detailed definitions on the megalopolis scope of the four major metropolises.

Besides, as shown in Figure 2, the megalopolis scope of Beijing determined by DID analysis is located within its administrative division, so all the numerical values of Beijing as a megalopolis are the same as those of it as a municipality.

Figure 2. DID analysis of Beijing megalopolis

Cloud River Urban Research Institute also soundly measured the development quality of the megalopolises through a multimodal index analysis based on data resources in different fields, including statistical data, big data, and satellite remote sensing data. It elevates the research on metropolises worldwide to a new level, and provides a scientific basis for the accurate comparative analysis of Beijing and the four major metropolises.

Furthermore, Cloud River Urban Research Institute managed to accurately calculate carbon dioxide emissions of cities through satellite data parsing and GIS analysis, enabling an accurate and in-depth analysis of carbon dioxide emissions of global cities.

On that basis, this article made a comparative analysis of carbon dioxide emissions of Beijing and the four major metropolises to find out gaps in between scientifically, in a bid to provide an important reference for Beijing and other Chinese cities on carbon peak and neutrality strategy.

Table 1. Area and population of Beijing, New York, London, Tokyo, and Paris megalopolises

1. Beijing’s carbon dioxide emissions increase 250% in two decades

Beijing’s carbon emissions grew rapidly over 20 years to a huge amount. Compared with the four major metropolises, Beijing stood out in both the growth rate and the amount of carbon emissions.

(1) Beijing’s amount of carbon dioxide emissions far exceeds those of the four major metropolises

Among the five megalopolises, Beijing was the largest carbon dioxide emitter.

The emissions of Tokyo and New York megalopolises were only 77% and 41% of those of Beijing, respectively, while those of Paris and London megalopolises were even smaller — only 13.7% and 5.8% of those of Beijing, respectively. Compared with the four major metropolises, Beijing stood out in terms of emission amount.

Figure 3. Comparison between Beijing and the 4 major metropolises in terms of the amount of carbon dioxide emissions (2019)

 (2) Beijing’s carbon dioxide emissions grow rapidly over two decades

Beijing’s carbon dioxide emissions grew rapidly by 250% over the two decades from 2000 to 2019.

During the same time, among the four major metropolises, London, Paris, and New York megalopolises all saw their carbon dioxide emissions decrease, and merely Tokyo saw a slight increase.

Tokyo megalopolis saw its carbon dioxide emissions increase by 1.8% during that period. It was mainly because the nuclear power accident in March 11, 2011 resulted in a shutdown of all nuclear power plants (accounting for 40% of Japan’s total power generation), and thus a significant increase in the proportion of thermal power generation. Even under those circumstances, Tokyo managed to limit its carbon dioxide emissions to a slight increase. That was not easy, especially when its population grew 9.9% during that period.

During the same period, the population of New York megalopolis grew by nearly 10%, and its economy doubled in size, while its carbon dioxide emissions fell by 5.8%. Paris megalopolis also brought down its carbon dioxide emissions by 18.5%, while its population and economy grew by 10.4% and 34.4%, respectively. London megalopolis saw a 24.8% increase in population and a 55.7% economic growth, but cut its carbon dioxide emissions by 44.7%.

The above analysis shows that efforts of the four major metropolises to reduce carbon dioxide emissions in the 21st century turned out to be effective.

Figure 4. Comparison between Beijing and the 4 major metropolises in terms of the amount change of carbon dioxide emissions (2000-2019)

 (3) Beijing’s carbon dioxide emissions account for 2.6% of China’s total

Among the five megalopolises, Tokyo megalopolis ranked first in terms of the proportion of local carbon dioxide emissions in the national total with a percentage of 17.7%, Paris megalopolis ran behind with 11.8%, and that of London megalopolis was 4%.

Japan, France, and the U.K. highly concentrated its economy in the capital economic circle, with Tokyo, Paris, and London megalopolises contributing 33.1%, 32.4%, and 23.6%, respectively, to their national economy. In comparison, carbon dioxide emission shares they contributed to the national total were much lower, an obvious advantage in energy conservation and emission reduction.

Compared with Japan, France, and the U.K., the U.S. and China have a vast territory, a large population, and relatively scattered economic hubs. As a result, New York and Beijing megalopolises contributed merely 8.8% and 3.6%, respectively, to their national economy, and took up only 2.1% and 2.6%, respectively, in national carbon dioxide emissions.

Figure 5 Comparison between Beijing and the 4 major metropolises in terms of the share of carbon dioxide emissions in the national total (2019)

2. Huge gaps exist between Beijing and the four major metropolises in terms of carbon dioxide emissions per unit of GDP

Carbon dioxide emissions per unit of GDP, also known as “carbon intensity,” measures the correlation between a country’s or a city’s economy and carbon emissions.

(1) London’s carbon dioxide emissions per unit of GDP are less than 5% of those of Beijing

Among the five megalopolises, Beijing has the highest carbon dioxide emissions per unit of GDP.

Carbon dioxide emissions per unit of GDP of Tokyo, New York, Paris, and London are 23.3%, 11.2%, 7.9%, and 4.5% of those of Beijing, with London emitting the least carbon dioxide per unit of GDP.

Even the carbon dioxide emissions per unit of GDP of Tokyo megalopolis, the highest among the four major metropolises, are less than a quarter of those of Beijing, and those of London megalopolis are less than 5% of those of Beijing. The aforementioned data shows that there are huge gaps between Beijing and the four major metropolises in terms of economic structure and quality.

Figure 6. Comparison between Beijing and the 4 major metropolises in terms of carbon dioxide emissions per unit of GDP (2019)

(2) Beijing’s carbon dioxide emissions per unit of GDP plummet by 79.4% over two decades

Beijing saw its carbon dioxide emissions per unit of GDP plummeted by 79.4% from 2000 to 2019, the biggest drop among the five megalopolises.

The four major metropolises also made significant achievements in reducing carbon intensity during the period. New York, Paris, and London megalopolises saw their carbon dioxide emissions per unit of GDP plunge by 52.5%, 39.3%, and 64.5%, respectively. Even Tokyo megalopolis, which had to massively increase thermal power generation, saw its carbon dioxide emissions per unit of GDP fall by 9.2%.

Figure 7. Comparison between Beijing and the 4 major metropolises in terms of the change of carbon dioxide emissions per unit of GDP (2000-2019)

(3) Beijing’s carbon intensity is 73.4% of the national average level

Beijing’s carbon dioxide emissions per unit of GDP are only 73.4% of the national average level, taking the lead in the country. 

The four major metropolises have a much lower carbon dioxide intensity. Carbon emissions per unit of GDP in Tokyo, Paris, New York and London are only 53.5%, 36.4%, 24.1% and 16.8% of their national average levels, respectively. 

This set of data reveals that these four cities have an industrial structure better than their national levels, and the agglomeration effect of megacities also shows great advantages in energy conservation and emission reduction.

Figure 8. Comparison between Beijing and the 4 major metropolises in terms of carbon intensity (share of their national average levels in 2019)

3. Per capita carbon dioxide emissions in Beijing haven’t yet reached the peak

As the economy grows, industrial activities expand, and lifestyles in food, housing and transportation develop, per capita energy consumption will increase, resulting in an increase in per capita carbon dioxide emissions. Generally speaking, when the social and economic development reaches a certain level, carbon dioxide emissions per unit of GDP will be on a downward trajectory, while per capita carbon dioxide emissions will peak later. Therefore, only a continuous decline in per capita carbon dioxide emissions can usher in a turning point. Hence, per capita carbon dioxide emissions are just a key indicator to measure carbon emissions of an economy, and per capita carbon dioxide emissions are a barometer of the real peak of carbon emissions.

(1) London’s per capita carbon dioxide emissions are only 14% of Beijing’s

Beijing’s per capita carbon dioxide emissions are higher than these four cities. By contrast, per capita carbon dioxide emissions of Tokyo and New York are 45.1% and 43.9% of that of Beijing, respectively. Per capita carbon dioxide emissions of Paris and London are much lower, only 24.1 and 14% of that of Beijing, respectively.

Figure 9. Comparison between Beijing and the 4 major metropolises in terms of per capita carbon emissions (Share of Beijing’s level in 2019)

(2)  Beijing’s per capita carbon dioxide emissions increase by 120%

From 2000 to 2019, Beijing’s per capita carbon dioxide emissions increased by 120%, the only city among the five cities that registered positive growth. 

Among the four major metropolises, London reported the largest drop in per capita carbon dioxide emission, with a sharp decrease of 55.7%. Paris, New York, and Tokyo decreased by 26.1%, 14.3% and 7.4%, respectively.

Figure 10. Change of per capita carbon dioxide emissions in Beijing and the 4 major metropolises (2000-2019)

(3) Which city has lowest share of the national average level in terms of carbon dioxide emissions

Beijing’s per capita carbon dioxide emissions are 1.8 times the national level, and it is the only city in the five cities whose per capita carbon dioxide emissions outnumber its national average level.

Per capita carbon emissions of Paris and Tokyo are 62.7% and 61.2% of their national average levels, respectively. Per capita carbon dioxide emissions of New York and London are 34.5% and 29.8% of their national average levels, respectively.

Figure 11. Comparison between Beijing and the 4 major metropolises in terms of per capital carbon emissions (share of their national average levels in 2019)

The above analysis reveals that per capita carbon dioxide emissions of the four major metropolises areas are not only lower than their national average levels, but also are significantly declining. This not only reflects their advantages in social and economic development, but also underpins their endeavor to promote carbon neutrality.

Beijing, the Chinese capital, has not yet reached the turning point of per capita carbon emissions. Going forward, Beijing needs to play catch-up to enter the world’s top echelon in terms of the industrial structure, urban design, and lifestyle.

(Researchers at the Cloud River Urban Research Institute Kurimoto Kenichi, Zhen Xuehua, and Zhao Jian contributed to data compilation and graphic production in the article.)


The article was first published on China SCIO, China.org.cn on Jul. 22, 2022 and reprinted by other news websites.

China Core Cities & Metropolitan Area Development Index 2020 released

Compiled by Cloud River Urban Research Institute, an international think tank, the China Core Cities & Metropolitan Area Development Index 2020 was recently released. In the comprehensive ranking, Beijing, Shanghai, Shenzhen, and Guangzhou have occupied the top four positions for three consecutive years. Chengdu has fared well, up three places to fifth in the ranking from the first release of the index in 2017. Tianjin has fallen to sixth place from fifth in 2019, while Hangzhou (7th), Chongqing (8th), and Nanjing (9th) have all maintained their 2019 rankings.

Xi’an ranks 11th, up two places from 2019. Conversely, Wuhan drops to 13th from 11th in 2019. Ningbo has maintained its 12th place.

Among the 36 core cities, Zhengzhou, Changsha, Jinan, Hefei, Fuzhou, Harbin, Nanchang, Nanning, Haikou, Hohhot, and Lhasa have climbed the ranking, in which Hefei has seen the largest increase from 23rd in 2019 to 19th in 2020. Qingdao, Kunming, and Changchun have maintained their 2019 positions.

Xiamen, Shenyang, Dalian, Guiyang, Shijiazhuang, Taiyuan, Urumqi, Lanzhou, Xining, and Yinchuan have moved down in the ranking. Among them, Dalian has seen a bigger drop from 18th in 2019 to 23rd in 2020. In general, core cities in the north have declined significantly in the comprehensive ranking.

The China Core Cities & Metropolitan Area Development Index is supported by a selection of 442 data sets closely related with its theme, including statistical data, satellite remote sensing data, and internet data, from the 882 data sets which support the China Integrated City Index. Therefore, the China Core Cities & Metropolitan Area Development Index is a cutting-edge multimodal index that uses the “five senses” to analyze and measure a city’s development through statistical resources of different fields.

For example, through satellite remote sensing data, we can accurately know the scale, distribution, and density of population in densely inhabited districts (DIDs), and analyze their relationship with other factors like economic development, infrastructures, social development, and ecological and environmental protection, elevating the research of metropolitan areas to a higher level.

It is worth noting that CO2 emissions data is included in the index. Through years of efforts, Cloud River Urban Research Institute has finally been able to calculate CO2 emissions of each city through satellite data analysis and geographic information system (GIS) analysis, which has increased the accuracy and depth of its analysis and evaluation on the cities’ performance in pursuing high-quality development.

Another key feature of the index is that it is an analysis of 36 core cities, including four municipalities, 22 provincial capitals, five capitals of autonomous regions, and five cities with independent planning status, against the evaluation of 297 cities at the prefecture level or above across the country. Notably, four non-core cities — Suzhou (10th), Dongguan (20th), Wuxi (25th), and Foshan (27th) — are among the top 30 in the 2020 comprehensive ranking.

In 2020, the 36 core cities accounted for 39.2% of China’s total GDP, 50.9% of its export volume, 50.1% of the total number of authorized patents, 26.6% of the permanent resident population, 42% of the population in DIDs, 67.3% of the total number of listed companies on the main board, 94.8% of the prestigious universities under the Project 985 and Project 211, 57.5% of the five-star hotels, and 47.5% of the top hospitals, according to the index. It is notable that the core cities have lead China’s social and economic development.

The index mainly measures 10 major items, namely the city status, metropolitan area power, radiation ability, wide-area hub, opening and communications, business environment, innovation and entrepreneurship, ecological resources and environment, life quality and safety, as well as culture and education. It is also supported by 30 sub-items and 116 sets of index data to comprehensively evaluate the high-quality development of core cities in a science-based, systematic, and detailed manner.

What is most noteworthy about the 2020 index is that it focuses on assessing the performance of China’s core cities in COVID-19 response and economic recovery. Here is an overview from the perspectives of three major items — life quality and safety, metropolitan area power, and ecological resources and environment.

Life quality and safety: Zero-COVID-19 policy contains virus after it hit Wuhan hard

In 2020, COVID-19 put cities to test in terms of ensuring life quality and safety. Over theyear, 62.8% of the new COVID-19 cases (excluding imported cases and asymptomatic cases) were in Wuhan, but the rapid lockdown and the zero-COVID-19 policy quickly brought the virus under control. As a result, no extensive spread occurred in other cities outside Hubei province despite sporadic outbreaks, and life and production in Chinese cities quickly resumed.

The major item of life quality and safety is divided into three sub-items, namely safety and livability, living consumption, and medical welfare. The sub-items are made up of 16 data sets, including the number of people infected with the coronavirus, licensed (assistant) doctors, and top hospitals, as well as average life expectancy.

In the ranking of life quality and safety, Wuhan, hit hard by COVID-19, has fallen to the bottom of the list from eighth place in 2019. Beijing, Shanghai, and Chongqing are the top three, followed by Chengdu, Hangzhou, Guangzhou, Nanjing, Zhengzhou, and Tianjin. In the top 10 cities, Chongqing, Chengdu, and Zhengzhou have climbed higher in the ranking compared with 2019, with Chongqing entering the top three for the first time. The rankings of Beijing and Shanghai have remained unchanged, while Shenzhen and Wuhan have dropped out of the top 10.

Among the 36 core cities, Xi’an, Jinan, Shenyang, Hefei, Qingdao, Ningbo, Dalian, Harbin, Changchun, Kunming, and Hohhot have moved up in the ranking compared with 2019.

Beijing, Shanghai and Shenzhen top ranking of metropolitan area power

Metropolitan area power is one of the most basic indicators to gauge the core city. This major item focuses on not only its economy and population, but also its population concentration and structure, as well as its ability as an economic center.

In 2020, core cities across the country registered positive growth except Wuhan, which was hard hit by COVID-19, as their GDP growth rate increasing by 3 percent points on average. The strong resilience of the core cities has driven China’s economy to achieve a growth rate of 2.3% despite economic contraction in other major countries.

The major indicator of metropolitan area power encompasses three sub-indicators: economic scale, metropolitan area quality, and enterprise agglomeration, including 14 sets of indicator data such as GDP scale, resident population, DID population and listed enterprises on the main board.

Beijing, Shanghai and Shenzhen have retained the top three spots in the ranking of metropolitan area power, with a remarkable deviation value. The other cities in the top 10 include Guangzhou, Chongqing, Hangzhou, Chengdu, Tianjin and Wuhan. Compared with the ranking in 2019, most of the top 10 cities remained unchanged, while Chengdu rose one place and Tianjin dropped three places.

Compared with 2019, Xi’an, Qingdao, Jinan, Kunming, Guiyang, Changchun, Taiyuan, Haikou, Xining, Yinchuan, Hohhot, Lhasa and other cities have climbed up the ranking.

Shanghai, Beijing and Tianjin: Biggest CO2 emitters

Eco-environmental quality and resource efficiency have become more and more important for the development of a city. While paying attention to environmental quality and resource efficiency, the major item of ecological resources and environment also takes into account the evaluation of environmental efforts. One highlight of this major item is the introduction of the evaluation of carbon dioxide emissions. At present, 36 core cities account for 29% of the country’s carbon dioxide emissions.

In terms of carbon dioxide emissions, the top 10 core cities are Shanghai, Beijing, Tianjin, Guangzhou, Harbin, Ningbo, Qingdao, Chongqing, Jinan, and Zhengzhou.

In terms of per capita carbon dioxide emissions, the top 10 core cities are Hohhot, Taiyuan, Lanzhou, Yinchuan, Tianjin, Urumqi, Ningbo, Qingdao, Beijing, and Shanghai.

The major item of ecological resources and environment contain three sub-indicators: the quality of resource environment, environmental effort and resource efficiency, including 15 sets of indicator data, such as air quality index (AQI), CO2 emission per unit of GDP, per capita CO2 emission, and climate comfort.

Shenzhen, Shanghai and Beijing are the top three cities in the ranking of ecological resources and environment, with Shenzhen toppling Shanghai from the pole position. Other core cities in the top 10 are Guangzhou, Chongqing, Xiamen, Wuhan, and Chengdu. Compared with 2019, Shenzhen, Xiamen, Wuhan, Tianjin, Changsha, Ningbo, Hefei, Shenyang, Xi’an, Qingdao, Jinan, Lhasa, and Shijiazhuang among the 36 core cities have risen up the ranking of this major item.


The article was first published on China SCIO, China.org.cn on Jan. 28, 2022 and reprinted by other news websites.

City development amid COVID-19 from the perspective of China Integrated City Index 2020

Ming Xiaodong

Former first-level inspector of the Department of Development Planning of the National Development and Reform Commission and former minister-counsellor of the Chinese Embassy in Japan.

Editor’s note:
Looking back on the year of 2020, despite hard blows by the coronavirus sweeping the world and the deep recession of global economy, the united Chinese people and resilient Chinese cities made major achievements in epidemic prevention and control across the country and in economic and social development.


The China Integrated City Index 2020, compiled by Cloud River Urban Research Institute, was released on Dec. 28, 2021. Looking back on the year of 2020, despite hard blows by the coronavirus sweeping the world and the deep recession of global economy, the united Chinese people and resilient Chinese cities made major achievements in epidemic prevention and control across the country and in economic and social development. In this context, the China Integrated City Index 2020 makes an objective evaluation of the COVID-19 response and the economic recovery of 297 Chinese cities at and above the prefecture level based on multi-dimensional data. The findings from the comparison of indexes before and after the outbreak are as follows.

The cities maintain stable momentum of development. The comprehensive ranking of the China Integrated City Index 2020 analyzes and evaluates the development of the cities from three dimensions of environment, economy, and society. The top 30 cities in the ranking are basically unchanged from 2019, except that Wuhan drops from the top 10 to 11th and Suzhou makes the top 10. The combined GDP of these 30 cities accounted for 43% of the national total, a main force driving China’s economic growth. Although China’s economy once hit the “pause button” due to the severe impact of COVID-19, none of these 30 cities located in China’s fast-developing areas mark drastic ups and downs. Instead, they maintained sound momentum of development and played an important role as the locomotive of China’s development.

The cities make continuous improvements in the environment. Rankings in the environment dimension reflect the changes in the cities’ natural ecology, environmental quality, and spatial structure. Compared with 2019, the top 30 cities in the 2020 environment ranking have not changed much — Naqu rose from 33rd to 22nd, Quanzhou from 35th to 28th, and Zhongshan from 36th to 29th, while Suzhou, Baoshan, and Sanming fell out of the top 30. With the view of peaking carbon emissions and achieving carbon neutrality, all the cities have been adjusting industrial structure, optimizing spatial layout, and promoting green development while overcoming the impact of COVID-19, and as a result, the top cities could be overtaken in the ranking at any time. Thanks to their effective efforts to improve the environment, the eco-environment of the country improved in general.

The cities make steady steps forward in governance. Rankings in the society dimension demonstrate the cities’ influence, governance level, and life quality. Although major epidemic outbreaks tend to pose severe challenges to urban governance, the top 30 cities in the 2020 society ranking have not changed much compared with 2019 — Zhuhai drops from 23rd to 31st, and Nanchang climbs from 33rd to 25th, ranking among the top 30. In fact, local governments actively took measures against COVID-19 amid the outbreak, and quickly brought the life of urban residents back to normal after it was temporarily affected. Despite unsatisfactory aspects in governance amid the outbreak, the cities withstood the test, with their status, urban culture, and life quality not greatly affected.

The cities sustain stable economic performance. Rankings in the economy dimension show not only their economic aggregate, but also their economic structure and efficiency. Compared with 2019, the top 30 cities in the 2020 economy ranking have barely changed, except that Zhuhai falls from 30th to 32nd and Wenzhou rises from 31st to 28th. It shows that Chinese cities have effectively addressed the impact of COVID-19 and maintained stable economic performance. China has already entered a stage of economic restructuring, transformation, and upgrading, and COVID-19 has accelerated its pace in this regard and in fostering a new development paradigm with domestic circulation as the mainstay and domestic and international circulations reinforcing each other, of which all the cities will be an integrate part.

Additionally, the China Integrated City Index 2020 can provide the following insights. 

The cities show strong resilience. The top 10 cities in terms of COVID-19 cases in 2020 are Wuhan and its neighboring cities that were hard hit by the sudden outbreak of the epidemic. These cities succeeded in curbing the spread of the virus in little more than one month, kept the local daily new cases within single digits in about two months, and won a decisive victory in the fight against the virus in about three months. The top 10 cities in terms of GDP, including Shanghai, Beijing, Shenzhen, Guangzhou, Chengdu, Chongqing, and Hangzhou, are in 11th to 20th places in the ranking. Harbin, Changsha, Nanchang, Hefei, Urumqi, Ningbo, Wenzhou, Bengbu, Nanyang and other provincial capital cities and local economic central cities also make their way into the list. Some cities have been hit by multiple rounds of outbreaks. Among these cities, by measure of medical radiation, Xiaogan, Huanggang, Suizhou, Xinyang and Nanyang are placed after 200, Jingzhou, Ezhou, Xiangyang, Huangshi, Jingmen and Xianning rank 100-200, and Beijing, Chengdu, Shanghai, Guangzhou, Hangzhou and Wuhan are in the top six. Under the unified direction of the central government, cities with strong medical resources supported cities with weak medical resources. All cities implemented category-based and science-based prevention and control measures, and resumed work and production in an orderly way, soon putting the economy on a stable footing and bringing businesses and lives into normal state. China has become the first major economy to return to growth since the outbreak of the virus, leading the world in the fight against COVID-19 and economic recovery, and showing the strong repair capacity and vitality of Chinese cities.

Transportation and logistics develop in a coordinated way. The top 10 cities in terms of passenger throughput are almost the same as the top 10 cities in terms of cargo throughput. As the main hub cities of transportation and logistics in China, these 10 cities account for 45% and 72.8% of the country’s passenger throughput and cargo throughput, respectively. The top 10 cities in 2020 in terms of port container throughput are Shanghai, Ningbo, Shenzhen, Guangzhou, Qingdao, Tianjin, Xiamen, Suzhou, Yingkou, and Dalian, which account for 70.8% of the country’s port container throughput. As the epidemic disrupted the production of enterprises, major cities actively carried out multimodal transport to ensure smooth transportation of emergency supplies. According to the data of the Ministry of Transport, the cargo throughput of ports across the country was14.55 billion tons in 2020, an increase of 4.3% over the previous year. Specifically, container combined rail-water transportation completed 6.87 million TEU, an increase of 29.6%, helping to stabilize foreign trade and industrial chain supply chains.

The digital economy develops rapidly. The top 10 cities in terms of IT radiation in 2020 are Beijing, Shanghai, Shenzhen, Hangzhou, Guangzhou, Chengdu, Nanjing, Fuzhou, Wuhan, and Xiamen. These cities are located in the most prosperous areas in China and are home to a number of IT companies, IT employees, and good IT infrastructures. With offline circulation restricted by the epidemic, new business forms such as online shopping, remote office, video conference and cloud exhibition in these cities have emerged rapidly thanks to new infrastructure and rich IT human resources. Thus their digital economy has made great progress, driving the digital transformation of China’s industrial economy. Online shopping has boosted social retail consumption, and cross-border e-commerce has propped up foreign trade. According to the data of the National Bureau of Statistics, the national online retail sales raked in 11.76 trillion yuan in 2020, an increase of 10.9% over the previous year. Specifically, online retail sales of physical goods reached 9,759 billion yuan, an increase of 14.8%, accounting for 24.9% of the total retail sales of social consumer goods, an increase of 4.2 percentage points over the same period last year. According to the data of the General Administration of Customs, China’s cross-border e-commerce foreign trade expanded by 31.1% in 2020, including exports of 1.12 trillion yuan, an increase of 40.1%, and imports of 0.57 trillion yuan, an increase of 16.5%. Despite uncertainties brought by the pandemic, cross-border e-commerce is becoming an important force to bolster foreign trade.


The article was first published on China.org.cn on Jan. 11, 2022, China SCIO on Jan. 11, 2022 and reprinted by other news websites.

COVID-19 response and economy of Chinese cities from the perspective of China Integrated City Index 2020

The China Integrated City Index 2020, compiled by Cloud River Urban Research Institute, was released on Dec. 28. The Index covers 297 Chinese cities at and above the prefecture level, and analyzes and evaluates their sustainable development from three dimensions of environment, society, and the economy in an all-round way.


Editor’s note:
The China Integrated City Index 2020, compiled by Cloud River Urban Research Institute, was released on Dec. 28. In the comprehensive ranking, the top 10 cities are Beijing, Shanghai, Shenzhen, Guangzhou, Chengdu, Chongqing, Nanjing, Hangzhou, Tianjin, and Suzhou. The Index covers 297 Chinese cities at and above the prefecture level, and analyzes and evaluates their sustainable development from three dimensions of environment, society, and the economy in an all-round way; and it is a scientific, authoritative, and practical index system measuring comprehensive urban development. Zhao Qizheng, Yang Weimin, Zhou Qiren, Qiu Xiaohua, and Zhou Nan shared their insights on it.


I. Rankings of China Integrated City Index 2020

The China Integrated City Index covers 297 Chinese cities at and above the prefecture level, and comprehensively evaluates their development from three dimensions of environment, society, and economy. Each of the three dimensions comprises three major items, and each major item comprises three sub-items, altogether forming a 3×3×3 structure. Each sub-item is supported by multiple indexes, and these indexes are composed of 882 sets of data, of which statistical data account for 31%, satellite remote sensing data for 35%, and internet big data for 34%. In this sense, the China Integrated City Index is an advanced multimodal index system that can use data resources in different fields to gauge and judge cities in a sound way.

The China Integrated City Index 2020 released by Cloud River Urban Research Institute evaluates the COVID-19 response and economic recovery of Chinese cities.

1. Comprehensive ranking

Beijing has topped the comprehensive ranking for five consecutive years, followed by Shanghai in second place and Shenzhen in third.

The top 10 Chinese cities in the comprehensive ranking in 2020 are Beijing, Shanghai, Shenzhen, Guangzhou, Chengdu, Chongqing, Nanjing, Hangzhou, Tianjin, and Suzhou. Chengdu and Nanjing rose to fifth and seventh place, respectively, while Suzhou entered the top 10 and Wuhan dropped out. The 10 cities are located in four city clusters, with four cities in the Yangtze River Delta, two in the Pearl River Delta, two in the Beijing-Tianjin-Hebei region, and two in the Chengdu-Chongqing economic circle.

The 11th to 30th are Wuhan, Xiamen, Xi’an, Ningbo, Changsha, Zhengzhou, Qingdao, Dongguan, Fuzhou, Kunming, Hefei, Foshan, Wuxi, Jinan, Zhuhai, Shenyang, Guiyang, Dalian, Nanchang, and Quanzhou.

2. Ranking in environment dimension

Shenzhen has ranked first in the environment dimension for five consecutive years, followed by Guangzhou in second place and Shanghai in third.

The top 10 Chinese cities in this dimension in 2020 are Shenzhen, Guangzhou, Shanghai, Xiamen, Sanya, Nyingchi, Shigatse, Chamdo, Beijing, and Haikou. Xiamen, Sanya, and Xigaze rose to fourth, fifth, and seventh place, respectively.

The 11th to 30th are Zhuhai, Dongguan, Chengdu, Zhoushan, Shantou, Shannan, Nanjing, Chongqing, Fuzhou, Danzhou, Foshan, Naqu, Puer,Bazhong, Hangzhou, Kunming, Wuhan, Quanzhou, Zhongshan, and Changsha.

3. Ranking in society dimension

Beijing and Shanghai have ranked first and second, respectively, in the society dimension for five consecutive years, and Guangzhou has remained third for four consecutive years.

The top 10 Chinese cities in this dimension in 2020 are Beijing, Shanghai, Guangzhou, Shenzhen, Nanjing, Chengdu, Chongqing, Hangzhou, Tianjin, and Xi’an. Nanjing, Chengdu, and Tianjin rose to fifth, sixth, and ninth place, respectively, while Xi’an entered the top 10 and Wuhan dropped out.

The 11th to 30th are Suzhou, Changsha, Xiamen, Zhengzhou, Jinan, Wuhan, Ningbo, Shenyang, Qingdao, Hefei, Kunming, Fuzhou, Harbin, Wuxi, Nanchang, Guiyang, Nanning, Dalian, Taiyuan, and Changchun.

4. Ranking in economy dimension

Shanghai has topped the ranking in the economy dimension for five consecutive years, and Beijing and Shenzhen have remained second and third, respectively, for five consecutive years.

The top 10 Chinese cities in this dimension in 2020 are Shanghai, Beijing, Shenzhen, Guangzhou, Chengdu, Suzhou, Chongqing, Tianjin, Hangzhou, and Nanjing. Chengdu jumped to fifth place, while Tianjin and Hangzhou fell in the ranking.

The 11th to 30th are Wuhan, Ningbo, Dongguan, Qingdao, Xi’an, Zhengzhou, Changsha, Xiamen, Wuxi, Foshan, Jinan, Fuzhou, Hefei, Dalian, Kunming, Shenyang, Quanzhou, Wenzhou, Changchun, and Harbin.


II. Strength and resilience of Chinese cities amid COVID-19 pandemic

Given that the principal theme of 2020 worldwide was COVID-19 prevention and control, the China Integrated City Index 2020 has evaluated the COVID-19 response and economic recovery of Chinese cities over the year from the dimensions of society, economy, and environment.

In terms of the COVID-19 situation, 80.8% of the newly confirmed COVID-19 cases in 2020 (excluding imported cases and asymptomatic cases) were in top 10 cities, all of which are within Hubei province. Rapidly adopted lockdown measures and the zero-COVID-19 policy quickly brought the outbreak under control, preventing other Chinese cities from explosive spread of the virus.

Thanks to the rapid control of the outbreak under the zero-COVID-19 policy, people in Chinese cities quickly resumed their life. Take entertainment in everyday life as an example. Though the movie market was one of the sectors hit hard by COVID-19, and China’s box office saw a slump of 68.2% in 2020, this decrease was relatively smaller than that of other major box offices worldwide such as the North America one, and a strong rebound made China the world’s largest movie market of the year. “The Eight Hundred,” a domestic production in China, topped the global box office for 2020, and another three Chinese movies ranked among the top 10 global box office hits of the year, namely “My Country, My Homeland” (4th), “Legend of Deification” (8th), and “A Little Red Flower” (9th). In addition, “The Sacrifice” ranked 14th. The strong rebound in the Chinese movie market pushed a number of Chinese movies to the top of the global box office.

Air transportation was also hit hard by COVID-19. Especially in the case of long-term restrictions on international travel, the passenger throughput of airports in cities declined drastically, altogether resulting in a 36.6% decrease in the passenger throughput of airports nationwide. Fortunately, air transportation in the country resumed thanks to its rapid control of the outbreak, and the decline in passenger throughput of its airports was relatively smaller compared with European countries, the U.S., and Japan.

The top 10 Chinese cities in terms of passenger throughput of airports in 2020 are Shanghai, Beijing, Guangzhou, Chengdu, Shenzhen, Chongqing, Kunming, Xi’an, Hangzhou, and Zhengzhou. Their aggregate accounted for 44.9% of the whole country, and the proportion of the top 30 cities was as high as 75.5%, demonstrating that China’s air transportation concentrated in hub cities.

Compared with the passenger throughput, the cargo throughput of airports across the country merely decreased by 6%. The top 10 Chinese cities in this term in 2020 are Shanghai, Guangzhou, Shenzhen, Beijing, Hangzhou, Zhengzhou, Chengdu, Chongqing, Nanjing, and Xi’an. Four of them — Shenzhen, Hangzhou, Zhengzhou, and Nanjing — even saw an increase in cargo throughput, showing the vitality of logistics and the rapid recovery of manufacturing supply chains amid the pandemic. The aggregate of the top 10 cities accounted for 72.8% of the whole country, and the proportion of the top 30 cities was as high as 92.5%, demonstrating an even higher concentration level of air cargo transportation in hub cities than passenger transportation.

Despite the disruption in global supply chains and global shipping amid the pandemic, which even continues to this day, most Chinese port cities saw an increase in container throughput in 2020, and the national port throughput registered a 1.2% increase, showing the strong resilience of China’s manufacturing sector in export. The top 10 Chinese cities in terms of port container throughput in 2020 are Shanghai, Ningbo, Shenzhen, Guangzhou, Qingdao, Tianjin, Xiamen, Suzhou, Yingkou, and Dalian, among which only Dalian registered a negative growth. Their aggregate occupied 70.8% of the whole country, and the proportion of the top 30 cities was as high as 92.6%, demonstrating that China’s port transportation concentrated in certain cities.

China’s export industries were hit hard by the pandemic in the first half of 2020, but saw a strong rebound in the second half. The top 10 Chinese cities in terms of the radiation ability of manufacturing in 2020 are Shenzhen, Suzhou, Dongguan, Shanghai, Ningbo, Foshan, Chengdu, Guangzhou, Wuxi, and Hangzhou. All but three of them — Suzhou, Dongguan, and Wuxi — achieved export growth. It was the strength of these cities in manufacturing that enabled China’s export volume to grow by 4% in 2020. Their aggregate export volume took up 44.2% of the national total, and the proportion of the top 30 cities was as high as 71.7%, showing that China’s export industries concentrated in these cities with large manufacturing scale and great manufacturing strength.

The year 2020 marked strides ahead of the IT industry. Digital COVID-19 response, telecommuting, online teaching, telemedicine, video conferencing, and online shopping became the norm as the pandemic dramatically pushed for the digital transformation of all sectors and people’s life. The top 10 Chinese cities in terms of the radiation ability of the IT industry in 2020 are Beijing, Shanghai, Shenzhen, Hangzhou, Guangzhou, Chengdu, Nanjing, Chongqing, Fuzhou, Wuhan, and Wuhan. Their aggregate of IT industry employment and listed companies in the industry on the main board, the SME (small and medium-sized enterprises) board, and the GEM (growth enterprise market) board accounted for 58.3%, 77.6%, 62.5%, and 75.3% of the national total, respectively, showing that the IT industry further concentrated in hub cities.

With its effective zero-COVID-19 policy, China achieved a commendable 2.3% economic growth in 2020 when other major economies in the world registered negative growth in general. Except for Wuhan, which was hit hard by COVID-19, all of the top 30 Chinese cities in terms of GDP achieved economic growth in 2020, fully demonstrating the resilience of Chinese cities in the face of difficulties brought by COVID-19. The top 10 Chinese cities in terms of GDP in 2020 are Shanghai, Beijing, Shenzhen, Guangzhou, Chongqing, Suzhou, Chengdu, Hangzhou, Wuhan, and Nanjing. Their aggregate GDP accounted for 23.3% of the national total, and the proportion of the top 30 cities was up to 43%, showing that China’s economic growth concentrated in cities ranking high in this term.


III. Expert comments

Zhao Qizheng, Yang Weimin, Qiu Xiaohua, Zhou Qiren, Zhou Nan, and Zhou Muzhi shared their insightful comments on the performance of Chinese cities in 2020 on the release of the China Integrated City Index 2020.


Zhao Qizheng

Dean of the School of Journalism and Communication of Renmin University of China and former minister of the State Council Information Office

The China Integrated City Index 2020 has been released. In my opinion, the most distinct feature of the Index is that it focuses on the COVID-19 pandemic and analyzes its impact on Chinese cities based on multiple indexes.

Outbreaks causing unprecedented damage to human beings, such as the novel coronavirus one, are not frequently seen. The Index has carefully analyzed the impact of this major disaster on urban development, and these research results are of great value for dealing with similar situations in the future.

The novel coronavirus had borne down menacingly, and although countries around the world moved quickly to develop vaccines and effective cure, these efforts take time. China implemented comprehensive lockdown measures and the zero-COVID-19 policy in a timely manner, managing to make up for the time lag.

Countries around the world hold different views on its approach. Fortunately, due to Chinese cultural traditions, its people did not resist much to lockdown, quarantine, and face masks. Professor Zhou Muzhi and Cloud River Urban Research Institute have conducted studies on the effectiveness of China’s anti-COVID-19 policies since the outbreak, which have played a good role in the international understanding and reference of China’s anti-COVID-19 measures.

In the fight against the novel coronavirus, Chinese cities have given full play to the role of internet technology and made extensive use of artificial intelligence, cloud computing, big data, blockchain, and other technologies to effectively prevent cross infection in the flow of people. The national health code and travel code have been accepted by the public and put into practice in China; however, these practices are not accepted in many other countries due to cultural and governance differences.

In 2020, COVID-19 had a profound impact on the social and economic development of cities in China and around the world. The analysis of the China Integrated City Index 2020 on 297 Chinese cities at and above the prefecture level is of great significance for understanding and evaluating anti-COVID-19 policies and COVID-19 impact on urban development. This is also a feature not presented by previous Indexes, so I hope it can draw the attention of municipal leaders and sociologists. Of course, this Index has its important value for foreign scholars and research institutes studying the pandemic to refer to.


Yang Weimin

A member of the Standing Committee of the Chinese People’s Political Consultative Conference National Committee, and former deputy director of the Office of the Central Leading Group for Financial and Economic Affairs of China

The COVID-19 outbreak disrupted everything, but Cloud River Urban Research Institute released its China Integrated City Index 2020 as scheduled. I said the Index is a health checkup of Chinese cities. A health checkup should be taken on a yearly basis no matter what happens. A health examination is more important during an outbreak.

The China Integrated City Index 2020 looks at the development of Chinese cities amid the outbreak and identifies their resilience and performances.

China has stood out among global major economies since the COVID-19 outbreak. Its economy grew by 2.3% in 2020, and grew by 9.8% in the first three quarters of 2021 and is expected to grow around 8% for the whole year, with per capita GDP reaching $12,000, up by 2,000 from 2020. Its strong showing was the result of the effective measures rolled out by the Chinese government, and also the result of the resilience of the Chinese economy. Its resilience lies in its complete industries, manufacturing capability, supporting industries, exporting capability of manufactured goods, and the cluster of industries. Such a distinctive resilience put the Chinese economy on a stable footing through foreign trade, even when China’s domestic investment and consumption were hit by the epidemic. The U.S. government can impose sanctions against Chinese companies, but cannot curb the strong demand of U.S. consumers for Chinese goods. In 2020, Chinese net export in goods and services contributed 28% to China’s economic growth, and contributed as high as 19.5% in the first three quarters of 2021, beating the highest level of 14.3% in 2006 before the international financial crisis.

The Index shows that the top 10 and the top 30 Chinese cities in terms of manufacturing radiation accounted for 44.2% and 71.7% of China’s export volume, respectively, demonstrating their sound development and resilience.

Entering the new stage, China’s economy will foster a new development paradigm featuring “dual circulations,” with domestic and international circulations reinforcing each other. Some Chinese countries are expected to continue to play a leading role in the new development paradigm.


Zhou Qiren

Professor at the National School of Development of Peking University

The Index will become more relevant over time. The new edition allows audiences to examine the correlation between economic and social variants, which is essentially the complex connection between people and organization behavior in cities.

Here, “comparison” always occupies a basic and central position in empirical research. Any information that renders itself to comparison, therefore, is generally conducive to understanding and applying the law of urban comprehensive development. When it comes to comparison, Deng Xiaoping said during his visit to Singapore in 1978, “If you want to compare, compare with the world.” His statement is worth revisiting. It is very important for domestic cities to compete with each other, and it is also important to learn from international modern cities. I suggest that Professor Zhou consider adding a group of international city data to the future “China Integrated City Index” to enrich comparison.


Qiu Xiaohua

Vice chair of Cloud River Urban Research Institute and former head of the National Bureau of Statistics

My takeaways from the China Integrated City Index 2020 are as follows.

(1) A city’s economic strength is still the determinant of its status. A city’s future, its comprehensive strength and the realization of its goals rest on its economy.

(2) Green elements are more and more important. The city’s green transformation stimulates its development potential. The change in the ranking of comprehensive strength is the result of the emphasis on green development.

(3) The development of social and public utilities becomes more and more important. The outbreak has dented economic and social development and affected people’s livelihood, but it has also tested the emergency management facilities and capacities of cities. Those cities at the top of rankings tend to have comparative strengths in this regard.

(4) China’s development has entered a new stage, setting the construction of a new pattern paradigm in motion. Chinese cities tend to form city clusters, ushering in an era that pays more attention to the leading role of central cities. We expect Chinese cities to foster a healthier development pattern.


Zhou Nan

Deputy director-general of the Department of Development Planning of the National Development and Reform Commission

The sudden outbreak of COVID-19 raged the world in 2020, disrupting people’s lives and businesses. China has struck a balance between prevention and control measure, economic development, and social stability.

The Index revealed that the top 30 Chinese cities by measure of GDP in 2020, except Wuhan, all registered a positive growth between 1% and 5%, making China stand out in the world’s economies.

In terms of regional development, the Yangtze River Delta and the Pearl River Delta retained their advantages in economic, environmental and social fronts. Among the top 100 Chinese cities in comprehensive ranking, 21 cities are from the Yangtze River Delta, and 12 from the Pearl River Delta. Among the top 10 cities, four are from the Yangtze River Delta. With labor division and cooperation strengthening within the region, city clusters and metropolitan areas serve as a pacesetter, and emerging advantages in regional competition become a key carrier in international competition and cooperation.

Some cities performed differently, though the overall ranking is largely static. In 2020, quite a few cities along the middle reaches of the Yangtze River fared well, except some cities in Hubei. For instance, Hefei climbed from 26th to 21st, Zhuzhou from 71st to 68th, Jiujiang from 98th to 89th. In contrast, northern Chinese cities slipped in their rankings. From 2018 to 2020, Shenyang dropped from 19th to 26th, Harbin from 29th to 34th, Changchun from 30th to 36th, Yinchuan from 67th to 81st, and Hohhot from 56th to 82nd. Their ranking rejig resulted from their changes in economic, environmental and social indexes, echoing the Chinese old saying, “A boat sailing against the currents has to forge ahead or risks falling behind.”

Cities also differed in their rankings of industrial radiation. On one hand, industries that do not fit the mega cities began to relocate in 2020, with Shanghai and Guangzhou falling by two spots compared with 2018. On the other hand, cities boasting good scientific and technological and industrial foundations and a large talent pool caught up, with Chengdu, Xi’an, Nanjing, and Wuxi climbing by four to seven spots, and Wuhan and Xiamen making their way into the top 10. This reveals that labor division in cities have become reasonable and central cities have played a bigger role.

Any index system cannot be perfect and impeccable in any case. The Index, however, can easily and clearly measure the comparable strength of cities and their progress. A close examination of the Index gives me insights from different perspectives.


Zhou Muzhi

Head of Cloud River Urban Research Institute and professor at Tokyo Keizai University

Since the outbreak of COVID-19, Cloud River Urban Research Institute has paid close attention to the effectiveness of prevention measures and the performance of Chinese cities in the outbreak. On April 17, 2020, the institute released the report “COVID-19: Why is medical system in metropolises so vulnerable?” analyzed why international metropolises were crippled by the collapse of medical systems amid COVID-19 pandemic and assessed the measures adopted by Wuhan in the outbreak and recommended its measures to other countries. The article “Global COVID-19 responses: ‘Zero COVID-19 Case Policy’ vs. ‘Coexisting with COVID-19 Policy’,” published on Nov. 11, 2020, compared Chinese prevention and control measures to their Western and Japanese counterparts, and assessed the effectiveness of “Zero COVID-19 Case Policy.” Those reports and articles, all available in English and Japanese versions, helped the international community to understand the effectiveness of Chinese prevention and control measures.

At the same time, the institute gathered experts to research and discuss the impact of the pandemic on globalization, international metropolises, global supply chains, and IT, entertainment, aviation, and maritime industries in the form of theses, reports, dialogues, and seminars.

Based on the previous four editions of “China Integrated City Index” and the above research, the China Integrated City Index 2020 focuses on Chinese cities’ success in beating back the virus as well as the impact of the epidemic on related industries, and delivers the “health checkup” of Chinese cities amid the epidemic.

The China Integrated City Index 2020 shows that China’s economic prowess lies in its strong resilience of leading cities and effective anti-epidemic measures provide a solid foundation for China’s urban development.


The article was first published on China.org.cn on Jan. 5, 2022 and reprinted by other news websites.

Tokyo and Beijing can pave way for global trust

Shinji Fukukawa

Shinji Fukukawa


Published in CHINA DAILY, 3 Dec 2021

Japan and China are to celebrate the 50th anniversary of their normalization of diplomatic relationship in September 2022.

During the past 50 years, China has realized outstanding economic growth, and attained dominant position in the world through their political and economic activities. Japan and China must sublimate their cooperative relationships to a new dimension beyond the previous phase of focusing on China’s reform and opening-up policy.

In December 1979, when then Japanese prime minister Masayoshi Ohira visited China, I had an opportunity to accompany him as his secretary.

In his speech delivered in Beijing, Ohira reflected on his thoughts at the time on the negotiation to normalize diplomatic relationships, saying: “Our hearts were full of great anticipation and equally great anxieties. Our anxieties were relieved, however, by the broadmindedness of China’s leaders and its people, which was well-expressed by the words of premier Zhou Enlai on ‘seeking big common ground while shelving small differences’. That culminated in the successful conclusion of the great deed to normalize diplomatic relationships between China and Japan.”

“Japanability: The Power to Survive in the World” by Shinji Fukukawa, based on the “My Resume” section of the Nihon Keizai Shimbun

He concluded his speech by stressing that one of the most important factors for international relationships is to maintain the mutual trust between people of the countries beyond the economic interest.

Ohira, who served as foreign minister in Prime Minister Kakuei Tanaka’s cabinet, participated in the negotiations, and exerted extensive effort in preparatory works to help realize the diplomatic normalization. He had great interests in China’s progress after normalization. During his visit in 1979 as Japanese prime minister, he found the robust responses of Chinese people to the reform and opening-up policy and proclaimed Japan’s support for China’s industrial development.

China steadily pursued its structural reform, learning from the economic reform experiences of other nations, including Japan.

Ohira committed during his official visit to China to offer the so-called yen credit to support the construction of industrial and social infrastructure necessary for economic development. China realized the process of high economic growth since the 1990s and joined the World Trade Organization in 2001.

Its economic scale surpassed that of Japan in 2010 to become the second largest economy in the world and grew even further to become about three times as large as Japan’s today.

During this period of high economic growth, China advanced its economic reform and technological development to become the largest trade partner of Japan, and even attained sufficient capabilities to compete with the US in advanced technological fields.

From the history of the world, we learned how political and economic structures would change all the time in the world. China would likely expand its economic power further to reach the level equivalent to the US, and then it would be asked to take appropriate responsibilities and roles in international politics. China would undoubtedly provide intellectual contribution to the world in high-tech fields, such as information technologies.

In July, President Xi Jinping spoke at the informal summit meeting of Asia-Pacific Economic Cooperation about the building of “a new and open economic regime of advanced level, by creating new framework for development”. Japan, meanwhile, has overcome the stagnancy of Heisei Era (1989-2019), and is now pursuing the reform of the Reiwa Era.

Reiwa period began on May 1, 2019, following the abdication of Emperor Akihito and the elevation of his son Naruhito to the Chrysanthemum Throne.
Japan and China need to undertake efforts to achieve “economy of high-quality” that pivots around revolutionary information and communication technologies, led by artificial intelligence.

While the world economy suffers from the finiteness of resource availability and exacerbation of the global environment, the only path we can choose is to realize, with higher creativity and added values, “economy of high-quality”, which has less resource dependency and lower burden on the global environment, so that humans can optimize their functions. Fortunately, humans have acquired necessary tools to realize new, high-quality economy through the advancement in IT revolution using AI.

Japanese industries were proud to be among the world’s top-class industrial and technological powers in the 1980s and early 1990s, but its industrial power was flattened to stagnancy by the collapse of economic bubbles. Japan has recently been striving to make a full recovery.

China, on the other hand, achieved outstanding success and reached a level high enough to compete with the US through advancement in industrial technologies.

From the beginning of 2020, the COVID-19 pandemic has rapidly expanded worldwide, threatening the health and lives of humans, while driving global economy and society to a standstill. On the other hand, the pandemic has provided good opportunities for accelerating the development of digital transformation and the creation of a “new economy” system.

We are now moving to the new stage of economic and social advancement through technological innovation. We have to challenge the following matters.
First, we need to deploy innovation vigorously. The 21st century is the age of new development in innovations, with AI and others at the center.

In the beginning of the 20th century, the world saw the arrival of petroleum age. And in 1910, Austrian political economist Joseph Schumpeter defined the innovation as “the critical dimension of economic change”, which might create the novel combinations of production resources, such as materials, labor force, etc.

I would like to propose a new definition of “innovation”, in this age of the latest IT revolution, as the creation of new intellectual values within the economic sphere through the combination, integration and utilization of information elements collected through revolutionary IT technologies.

Today, AI and other information technologies make it possible to improve the efficiency of communication beyond physical limits and the boundaries of complexity to enhance added values. Through the fusion of cyber space and material space, we can ensure accuracy, improve efficiency, and realize the fulfillment of temporal values, so to advance economic activities from the material production-ism to the value-use-ism.

The use of AI will allow us to realize unmanned factories and retail shops with the installment of automation equipment, provide advanced remote medical services, make smart phone payments and cashless payments, and introduce cryptocurrencies. The use of AI can promote accuracy, speed, efficiency, and optimal selection of information communication, while realizing the improvement of added values.

The fields where advancement in innovation is expected will likely involve a wide range of areas centering around information technologies, such as biochemistry, new materials, space, oceans, advanced medical services, new energies, electric cars, power storage equipment, drones and hydrogen uses.
More intense international competitions in innovation will be likely worldwide.
In the case of Japan, its stagnant economy after the collapse of economic bubbles in the 1990s suppressed its innovation capability. Becoming more aware of its failures, however, Japan started to enforce policies for the development of innovation capability.

To accelerate innovations, major economies are focusing on policies to support research and development, to nurture intellectual human resources, and to develop new competitive environment. The key factors for developing favorable market conditions are innovation, fairness, efficiency and competitiveness.

At the “Beijing-Tokyo Forum Dinner” on 19 September 2008

He concluded his speech by stressing that one of the most important factors for international relationships is to maintain the mutual trust between people of the countries beyond the economic interest.

Ohira, who served as foreign minister in Prime Minister Kakuei Tanaka’s cabinet, participated in the negotiations, and exerted extensive effort in preparatory works to help realize the diplomatic normalization. He had great interests in China’s progress after normalization. During his visit in 1979 as Japanese prime minister, he found the robust responses of Chinese people to the reform and opening-up policy and proclaimed Japan’s support for China’s industrial development.

China steadily pursued its structural reform, learning from the economic reform experiences of other nations, including Japan.

Ohira committed during his official visit to China to offer the so-called yen credit to support the construction of industrial and social infrastructure necessary for economic development. China realized the process of high economic growth since the 1990s and joined the World Trade Organization in 2001.

Its economic scale surpassed that of Japan in 2010 to become the second largest economy in the world and grew even further to become about three times as large as Japan’s today.

During this period of high economic growth, China advanced its economic reform and technological development to become the largest trade partner of Japan, and even attained sufficient capabilities to compete with the US in advanced technological fields.

From the history of the world, we learned how political and economic structures would change all the time in the world. China would likely expand its economic power further to reach the level equivalent to the US, and then it would be asked to take appropriate responsibilities and roles in international politics. China would undoubtedly provide intellectual contribution to the world in high-tech fields, such as information technologies.

In July, President Xi Jinping spoke at the informal summit meeting of Asia-Pacific Economic Cooperation about the building of “a new and open economic regime of advanced level, by creating new framework for development”. Japan, meanwhile, has overcome the stagnancy of Heisei Era (1989-2019), and is now pursuing the reform of the Reiwa Era.

Reiwa period began on May 1, 2019, following the abdication of Emperor Akihito and the elevation of his son Naruhito to the Chrysanthemum Throne.
Japan and China need to undertake efforts to achieve “economy of high-quality” that pivots around revolutionary information and communication technologies, led by artificial intelligence.

While the world economy suffers from the finiteness of resource availability and exacerbation of the global environment, the only path we can choose is to realize, with higher creativity and added values, “economy of high-quality”, which has less resource dependency and lower burden on the global environment, so that humans can optimize their functions. Fortunately, humans have acquired necessary tools to realize new, high-quality economy through the advancement in IT revolution using AI.

Japanese industries were proud to be among the world’s top-class industrial and technological powers in the 1980s and early 1990s, but its industrial power was flattened to stagnancy by the collapse of economic bubbles. Japan has recently been striving to make a full recovery.

China, on the other hand, achieved outstanding success and reached a level high enough to compete with the US through advancement in industrial technologies.

From the beginning of 2020, the COVID-19 pandemic has rapidly expanded worldwide, threatening the health and lives of humans, while driving global economy and society to a standstill. On the other hand, the pandemic has provided good opportunities for accelerating the development of digital transformation and the creation of a “new economy” system.

We are now moving to the new stage of economic and social advancement through technological innovation. We have to challenge the following matters.
First, we need to deploy innovation vigorously. The 21st century is the age of new development in innovations, with AI and others at the center.

In the beginning of the 20th century, the world saw the arrival of petroleum age. And in 1910, Austrian political economist Joseph Schumpeter defined the innovation as “the critical dimension of economic change”, which might create the novel combinations of production resources, such as materials, labor force, etc.

I would like to propose a new definition of “innovation”, in this age of the latest IT revolution, as the creation of new intellectual values within the economic sphere through the combination, integration and utilization of information elements collected through revolutionary IT technologies.

Today, AI and other information technologies make it possible to improve the efficiency of communication beyond physical limits and the boundaries of complexity to enhance added values. Through the fusion of cyber space and material space, we can ensure accuracy, improve efficiency, and realize the fulfillment of temporal values, so to advance economic activities from the material production-ism to the value-use-ism.

The use of AI will allow us to realize unmanned factories and retail shops with the installment of automation equipment, provide advanced remote medical services, make smart phone payments and cashless payments, and introduce cryptocurrencies. The use of AI can promote accuracy, speed, efficiency, and optimal selection of information communication, while realizing the improvement of added values.

The fields where advancement in innovation is expected will likely involve a wide range of areas centering around information technologies, such as biochemistry, new materials, space, oceans, advanced medical services, new energies, electric cars, power storage equipment, drones and hydrogen uses.
More intense international competitions in innovation will be likely worldwide.
In the case of Japan, its stagnant economy after the collapse of economic bubbles in the 1990s suppressed its innovation capability. Becoming more aware of its failures, however, Japan started to enforce policies for the development of innovation capability.

To accelerate innovations, major economies are focusing on policies to support research and development, to nurture intellectual human resources, and to develop new competitive environment. The key factors for developing favorable market conditions are innovation, fairness, efficiency and competitiveness.

Recently, it was found that the aggregations of intellectual functions in cities have contributed greatly to promoting innovation, such as in the cases of the Silicon Valley in the US and Zhongguancun Science Park in Beijing and the Nanshan District of Shenzhen in Guangdong province. Regional and social cooperation is strongly expected to be encouraged.

Second, we have to corporate for the efficient operation of global market, which needs to operate freely and rationally under fair and safe rules. Japan and China need to reach agreement for this purpose in cooperation with the US and the European Union, while taking a leading role in restoring the proper functioning of the World Trade Organization.

Until then, it is necessary to promote and utilize regional free trade agreements, such as the Regional Comprehensive Economic Partnership, the Comprehensive and Progressive Agreement for Trans-Pacific Partnership, and APEC. Japan and China must exert efforts for the early entry into force of RCEP, which accounts for about 30 percent of the world’s population and global trade values. For CPTPP, the UK expressed their intention to join in February, and China submitted its application in September.

Advancement in information and communication technologies has had significant influence over the conditions of world trade competition, such as the monopoly of technologies and the risks of aggregating and concentrating corporate activity locations. Japan and China need to establish appropriate international rules to address these issues.

The two countries need to have mutual exchanges of their experiences in such rule-making and lead the world to realize “economy of high-quality”.

Third, we need to have mutual cooperation in reforming corporate management methods. The efficiencies of corporate management have been improved significantly through the advancement of information and communication technologies, with work style reform evolving through digital transformation of offices.

The COVID-19 pandemic has provided good opportunity for companies to promote digital transformation of corporate management. Moreover, such transformation would also provide powers for fundamental revolution in corporate management. For example, digital transformation would make it possible for companies to transform their profit structure from those based on the profits of scales to those bringing the profits of information, consolidation and times, thereby enabling the achievement of overall optimum. Corporate value, which may include profit value, customers’ value, workers’ value and social value, is increasingly expected to grow further through AI and other advanced management tools.

In the future, corporate management will likely face new and additional constraint factors, such as human security, while necessitating the improved management of markets, such as protecting intellectual properties and removing harmful effects of information monopoly. Such frameworks of markets should be rational and wholly optimized. Japan and China need to mobilize their knowledge and wisdom in developing the optimal conditions.

Japan and China need to jointly lead the world toward the development and fulfilment of human security regime. Such regime will likely have an important function in the urban development index.

The UN Development Program announced its human security policy in 1994 and recommended health, medicines, education, anti-terrorism and response toward natural disasters as its factors. The UN General Assembly further developed this policy and adopted the Sustainable Developments Goals in September 2015, which included 17 goals such as no poverty, zero hunger, decent work and economic growth, and climate actions, as well as 169 action programs. SDGs are the goals every corporation in the world needs to implement seriously and effectively. Corporations in Japan and China are no exceptions. They must cooperate in deploying such SDGs.

How to respond to COVID-19 pandemic is a key factor in establishing human security. Japan and China should lead the world in creating an effective system to fight against COVID-19 by intensifying coordination with other major countries. Major countries are struggling to find the best options to fight against the pandemic, balancing lockdowns and economic recovery measures.
This year, many countries such as the UK, Israel, the US and China have had extensive dissemination of vaccines as measures to fight the COVID-19 pandemic. How to confirm the effects of vaccines and how to distribute them in the world must not be the subject of political diplomacy, but the issue of enforcement through international cooperation from the humanitarian perspectives.

Japan and China are expected to disseminate such awareness and consciousness and contribute to preparatory measures for future epidemics by eliminating various epidemic-causing factors, such as preventing destruction of the nature and developing healthier human-animal relations.

Today, global warming is the biggest threat to humans. This year alone, harsh heat waves and severe rainstorms hit areas such as the US, China and Europe, causing many casualties. The urgent and crucial challenges of humans are to reduce carbon dioxide emission, which is the major cause of global warming, and to shift toward more circular economy.

In Japan, the administration of Yoshihide Suga announced the commitment to realize carbon neutrality by 2050, and China has set the target of achieving carbon neutrality by 2060. Global warming issues are incorporated into the Chinese urban development index. When developed fully in details, this will be sure to become a useful tool to resolve such issues.

The Joe Biden administration of the US has declared their return to the Paris Agreement, and the world is now developing a regime for “great reset”. For this, the key is to shift toward circular economy led by technological development, as well as addressing urgent challenges, which include the development of new energies such as solar and wind and their supply networks, the development and dissemination of electric cars, revolutionary development of power storage facilities, the fixation and sequestration of carbon dioxides, and the realization of smart cities.

Fourth, Japan and China have to expand their mutual cooperation in various fields, including more efficient energy consumption and transfer of pollution prevention technologies, with the Japan-China Economic Association holding energy and environment forum in cooperation with Japan’s Ministry of Economy, Trade and Industry and China’s Ministry of Commerce. In the future, Japan and China need to deploy wide-ranging collaboration, including in technological development, and, more importantly, continue working for the deployment and dissemination of their technological achievements to developing countries.

Fifth, we have to address demographic changes in society, with fewer children and an aging population. Japan is now facing grave issues arising from its aging society, such as how to secure financial resources to fulfill social security needs in providing health, nursing and medical services to the elderly. Similar issues will likely hit China in the near future. Both countries need to mutually exchange their experiences and cooperate with each other in developing social welfare policies and measures.

Finally, Japan and China can strengthen their bonds with the international community through cultural exchanges.

Reflecting on the history of human development, the advancement of human civilization has been dramatic and drastic, with their culture advancing steadily.

The cultural development of Greek and Roman empires was amazing, leading to further blooming of culture in medieval Europe. China, India, and Islam pursued their own cultural developments. Japan introduced the Chinese culture through its envoys to Sui Dynasty and Tang Dynasty (in the 7th to 8th century) and integrated such culture into Japan’s own. Japan has continued to introduce culture and technologies from other countries, including Europe and the US, to build its foundation of social development.

Japan has traditionally shown great tolerance to other culture, and actively integrated different culture throughout its history. China has been providing superb culture in great scale, including literatures, calligraphy, China wares and porcelains and Buddha statues. Chinese cuisines are widespread throughout the world.

In addition to traditional culture of both countries, new culture have emerged recently, centering around amass of information and communication technologies. American journalist Douglas McGray recently pointed out that “Japan’s gross national product is stagnant, but its gross national cool has mastery engine”. New culture can be found in anime, manga, cuisines, fashions and devices relevant to cultural information.

Information-related technologies have opened a new horizon for the development and fusion of industries and culture, as well as technologies and arts. Recently, China is focusing more on the promotion of cultural activities, development of cultural markets, and nurturing of artists, while integrating information technologies not only into its traditional culture but also into newly developed culture.

“Culture” is the summation of artistic and technological values, and the symbol of international reconciliation.

Especially, rapid advancement in information-related technologies including AI will likely improve the cultural quality of commercial products and services, develop the methods and tools of artistic expressions, enhance more sophisticated methods to communicate cultural information, and make it possible to realize both cultural values and efficiencies at the same time.
Expanding cultural markets through intensified cultural exchanges, the two countries can develop methods to evaluate cultural values in markets, collect relevant data, and study the conformity of technologies and cultures.

It is my belief that if Japan and China can cooperate in integrating industries and culture, and technologies and arts, this will enhance mutual understanding of their culture by improving the human sense of values, thereby significantly contributing to global stability and the harmonization of human society.

On Oct 4, Fumio Kishida became the 100th prime minister of Japan. He is the chairman of Kouchikai, a policymaking group which Masayoshi Ohira once led. Kishida’s political style is to listen to the opinions of as many people as possible before making any political choices and decisions.

During the Shinzo Abe administration, Kishida was foreign minister for 1,682 days, further enriching his experience in diplomacy and international relations.
In terms of economic policy, he said that he would make overcoming COVID-19 epidemics as top priority, then establish “new capitalism” supported by virtuous cycle of growth and fair distribution to revive Japanese economy, which has been stagnant for some time. Moreover, he would aim for building and consolidating robust platform for economic growth, by focusing on policies to reinforce innovation capabilities, prevent global warming, and establish economic security.

At the same time, he would undoubtedly stress the importance of establishing economic cooperative relationships with major countries, such as China.
Japan-China cooperation will significantly contribute to global stability and the development and evolution of humans.

For the past 2,000 years or longer, excepting the brief period of animosity, people of Japan and China have continued their close mutual relationship in the fields of economy, technologies, culture and education. They would continue and tighten their solid bond of trust for the next 100, 200 and 1,000 years, and further deepen mutual exchange activities.

Moreover, through such a close relationship, they could deepen the knowledge and wisdom of humans and heighten their virtues. Through these mutual exchanges, Japan and China could provide greater contribution to realizing the “economy of high quality” and “global society filled with mutual trust”.

At the “Party to Commemorate the Publication of ‘China City Ranking – China Integrated City Index ‘” on July 19, 2018, front row, from right to left: Kazuyuki Sugimoto (Chairman of Japan Fair Trade Commission and former Vice Minister of Finance), Takashi Anzai (Chairman of Toyo University), Shinji Fukukawa, Minoru Furukawa (Chairman of Hitachi Zosen Corporation), Kazuhiko Abe (Director of Japan Development Institute), Masaoki Takeuchi (President of International Development Center), Rinji Takeoka (Senior Managing Director of Nikkei Inc.)

The author is former Japanese administrative vice minister of International Trade and Industry and now is chancellor of Incorporated Educational Institution of Toyo University in Tokyo, Japan. The views do not necessarily reflect those of China Daily.


The article was published on CHINA DAILY on Dec 22, 2021, and was republished by foreign media, including China Net, as well as today’s headlines and other platforms.

Asian path of winning and securing Olympic gold medals

Zhou Muzhi 

Editor’s note:

What was the secret of Japan’s leap to the third place in the gold medal count at the Tokyo Olympics that just concluded? Why was the number of gold medals set for table tennis and badminton – sports that China excels in – only one third of that of judo? How can Chinese martial arts enter the Olympics through sports beyond judo, taekwondo, and karate? In this piece, Zhou Muzhi, professor at Tokyo Keizai University and head of Cloud River Research Institute explained the Asian path of winning and securing Olympic gold medals from a brand new perspective.


The Tokyo Olympics held under the state of emergency already ended successfully, with all its events going reasonably well despite the absence of cheerful spectators in most of them. China finished second with 38 gold medals, behind the U.S. with 39 and followed by Japan with 27. It was the first time along the 125-year Olympic history that two Asian countries had taken the top three spots.

1. New highlight of the Olympics: how to increase the gold medal tally?

Japan won 27 golds, 14 silvers and 17 bronzes at the Tokyo Olympics, 58 in total and setting its new record. Judo alone secured nine gold medals, the largest number of gold medals that the country won through a single sport, and a third of its total gold medals.

Japanese TV channels thus broadcast judo events live almost all day long during the Olympics, turning the diverse Olympics into an international judo competition.

Why is Japan so adept at judo? Why are there so many gold medals in it?

In fact, Japan promoted it to an Olympic sport at the 1964 Tokyo Olympics, with merely four gold medals. Through the efforts over more than half a century ever since, the sport has developed into a “big gold ore” with 15 gold medals.

In terms of the number of gold medals in the 33 sports of the Tokyo Olympics, judo ranks seventh, only behind track and field (47), swimming (34), gymnastics (18), wrestling (18), cycling (18), and kayak (16), and the same as weightlifting (15) and shooting (15). It is already a “big gold ore.”

The Japanese martial arts judo has been the hero of Japan’s Olympic gold medal tally. Especially at the 1992 Barcelona Olympics, the 1996 Atlanta Olympics, the 2000 Sydney Olympics, and the 2004 Athens Olympics, judo won two thirds, all, four fifths, and half of Japan’s gold medals, respectively, a matchless merit to its gold medal haul.

At the 13 Olympics with judo (no judo events at the 1968 Mexico City Olympics), Japan won 134 gold medals in total, of which judo took up 48 and ranked first. In other words, over a third of Japan’s gold medals at these Olympics came from judo events. In addition, Japan won up to 32% of the 152 Olympic gold medals in judo.

This Tokyo Olympics added five new sports – skateboarding, sport climbing, surfing, baseball and softball, and karate – with 18 gold medals, which also contributed significantly to Japan’s gold medal number. They added six gold, four silver, and four bronze medals to Japan’s medal table, which took up 22% of its golds, 29% of its silvers, and 24% of its bronzes. So to speak, the new sports gave an immediate boost to the medal tally.

Taking judo and volleyball added at the 1964 Tokyo Olympics into account, the seven sports added at two Tokyo Olympics contributed a total of 15 gold medals for Japan at the just-concluded Olympics, 55% of the country’s gold medal count.

Japan’s strategy of winning and securing gold medals – introducing and developing its “gold ore” sports – has yielded fruitful outcomes at this Tokyo Olympics.

2. Asian host countries vie for new events 

The first Olympic Games held in Athens in 1896 had only nine sports: track and field, swimming, weightlifting, shooting, cycling, classical wrestling, gymnastics, fencing, and tennis. At the Tokyo 2020, there were 33 sports and 339 medal events. Over 他he past 125 years from the first Olympics to Tokyo 2020, many host counties have tried to strategically added events that they excel in. 

There is a high bar set for adding new Olympic events, with many regulations and complicated review procedures entailed. The host country, however, has the authority to propose new events, although this authority varies in different periods. 

The first opportunity for Asian countries came at the Tokyo 1964 Olympics. As the host country, Japan successfully introduced judo and volleyball to the Olympic arena as medal sports.

At the Tokyo 1964, Japan took three out of four golds in Judo, as well as one silver. In the competition for two gold medals in volleyball, the Japanese women’s volleyball team, dubbed the “Oriental Witch,” won the championship, and the men’s volleyball team won the bronze medal. At the Games, Japan harvested 16 gold medals, with judo and volleyball contributing a quarter.

The second chance was the Seoul 1988 Olympics. At this year’s Games, table tennis was added as a new sport. At the same time, badminton and Taekwondo made their Olympic debut as exhibition events. South Korea took two gold medals in table tennis that year. Badminton and Taekwondo also became big contributors to South Korea’s gold medal haul after they became formal medal events in the Barcelona Olympics in 1992 and the Sydney Olympics in 2000, respectively. Table tennis, badminton and Taekwondo have brought a combined 21 golds, 13 silvers, and 26 bronzes to South Korea.

Unfortunately, the Beijing 2008 Olympics failed to introduce new events, missing out an opportunity to add events in China’s favor.

Thanks to the experience gained at the Tokyo 1964 and after more than half a century of preparation, this year’s Tokyo Olympics added five new major events at a time, paving its road to gold medals.

3. China’s ‘gold ore’: Strong but not big enough

The 10 major events newly added to the Tokyo and Seoul Olympics (including those events that were added as exhibition events before becoming official medal events) — judo, volleyball, table tennis, badminton, taekwondo, skateboarding, rock climbing, surfing, baseball, and softball and karate, are mostly suitable for Asian athletes. These events have been big contributors to China’s gold medal tally. At the Tokyo 2020, China won six golds, eight silvers, and two bronzes at these events.

Especially in table tennis and badminton, China bagged four gold medals and two gold medals, respectively, accounting for four fifths and two fifths of the total in these two major events.

In previous Olympic Games, China won 32 gold medals in table tennis, accounting for 86% of the total in this major event. In badminton, China won 20 gold medals, accounting for 51% of the total. With its dominance in these two sports, China has already turned table tennis and badminton into its “gold ores.”

However, these two sports are not big enough in terms of gold medal numbers. The number of gold medals in table tennis had stayed at four since the Seoul Olympics, and was increased to only five at the Tokyo 2020. 

Badminton has become an official event since the 1992 Barcelona Olympics, awarding four gold medals. The 1996 Atlanta Olympics increased the number to five, and yet the number remained unchanged ever since.

Table tennis and badminton failed to expand their gold medals as judo, which increased the originally four gold medals to 15.

Even so, among China’s gold medal haul in previous Games, table tennis ranks fourth after swimming (including diving), weightlifting and gymnastics, and badminton ranks sixth.

How to transform dominance to more medals should become an important link in the Olympic gold medal strategy.

4. Efforts to bring Wushu into the Olympics

Bringing the Chinese martial arts, or Wushu, into the Olympics has long been a shared dream of the Chinese people. The desire has grown stronger since other Asia-originated sports like Judo, Taekwondo, and Karate secured their places as major medal sports in the Olympics.

Why does Wushu always fail to make its way into the Olympics?

It missed out the opportunity to be included in the Games during the Beijing 2008 and only made its debut in the Olympics as a demonstration sport event even as China hosted the Games, with its attempt to become a medal sport failed in the following Olympics.

Is the preparation not long enough? It took 13 years for Judo to be included into the Olympics in 1964 since the founding of the International Judo Federation in 1951; it took Taekwondo 27 years to be an Olympic sport in 2000 since the founding of the International Taekwon-Do Federation; and it took 50 years for Karate to be a medal sport in Tokyo 2020 since the International Karate Federation founded in 1970. In contrast, it was already 18 years at the Beijing 2008 and 30 years for Tokyo 2020 since the International Wushu Federation founded in 1990. In this sense, Wushu’s failed attempt to the Olympics can not be attributed entirely to the lack of time in preparation.

The problem might be in the strategy of its application.

The International Wushu Federation submitted an application for inclusion to the International Olympic Committee (IOC) in 2001 featuring the men’s events for Changquan, Nanquan, Daoshu and Gunshu, and women’s events for Changquan, Taijiquan, Jianshu and Qiangshu. This kind of settings with complicated categories and inconsistent rules can hardly be approved in the deliberation process.

In contrast, Judo’s Olympic inclusion followed a path of “start small, aim big.” Since 1882, Kano Jigoro has toned down the dangerous elements of Jujutsu and created a set of systematic techniques to transform the traditional martial arts into the modern Judo. After World War Ⅱ, Japan actively promoted Judo worldwide and improved the combat rules, making it a well-accepted competitive sport globally.

In 1964, Judo joined the Olympic family with only a 4-gold medal setup and then expanded the medal count by adding different weight categories and female representation. Nowadays, Judo not only helps Japan climb higher on the medal tally but also gives the country a soft power boost, demonstrating its profound history and culture.

Learning from the experience of Judo’s path into the Olympics, the International Wushu Federation might as well abandon its all-inclusive practice and introduce a few most popular events to start with in its IOC application, before expanding more categories as an Olympic sport.

Taijiquan, with hundreds of millions of global followers, enjoys the highest popularity worldwide and should be the first choice in the IOC application. To introduce Taijiquan into the Olympics, we suggest the following three steps:

First, unify different schools of traditional Taijiquan into an internationally accepted sport with competition and performance features, and promote it worldwide. Second, establish the International Taijiquan Federation and push for its recognition by the Global Association of International Sports Federations and the IOC. Third, submit applications to the IOC to include Taijiquan an Olympic sport and add more categories into the sport afterwards.

To sump up, it needs the right strategy and long-standing efforts to promote China’s traditional culture into the Olympics and expand it into a major medal sport.

Dr. Zhen Xuehua, a senior researcher at Cloud River Urban Research Institute, has contributed to this article.


The article was published on China net on Sep 7, 2021, and was republished by foreign media.

A look at Asia’s people-to-people exchanges from Tokyo 2020

Zhou Muzhi 

Editor’s note:

After the Tokyo Olympics wrapped up last month, the Paralympic Games concluded on Sept. 5. In this article, Zhou Muzhi, professor at Tokyo Keizai University and head of Cloud River Urban Research Institute gives a rare glimpse of the Games from the unique perspectives of geographical features and people-to-people exchanges.


In most previous Olympics, I found myself hard to sit down and enjoy the Games due to my busy schedules. This year, with the continued spread of COVID-19 and Tokyo under strict “state of emergency,” I had a rare chance of watching the Games amid the lockdowns. Here are some of my interesting takeaways from this year’s event.

1. Hercules in the south

First, to my great surprise, Shen Lijun, from my ancestral home Yiyang, China’s southern Hunan province, has been crowned the Olympic champion in the weightlifting men’s 67kg event, bucking my stereotype that Chinese Hercules were normally born in the northeastern or northwestern part of the country. After searching the information of 18 Chinese male Olympic weightlifting champions, I found out that only two were born in China’s north, with the rest all come from the south. So it is no wonder that Xiang Yu, “Hegemon-King of Western Chu” during the Chu–Han Contention period (206–202 BC) of China, was also a native southerner and was said to have the strength that can lift mountains. I feel quite proud that I also come from the south like so many Chinese Hercules.

2. Ping Pong: North dominating the sport

Another thing that surprises me is that many top Japanese Ping Pong players can speak very good Mandarin with northern accent. That’s because they were trained by Chinese coaches since they were young.

Since the Seoul Games in 1988 when Ping Pong officially became an Olympic sport, China has won 32 out of the 37 gold medals, accounting for 86% of the total, representing an overwhelming dominance in the game. Geographically, the 28 gold medal winners were mostly born in the north, including 10 from the northeastern part of the country.

Retired Chinese Ping Pong players have been spotted worldwide as coaches of the foreign teams and promoters of the sport. Those Chinese coaches, either train their players in Japan or bring them back to China for intensified training, would naturally leave a northern mandarin accent on their disciples.

For example, Ai Fukuhara, a four-time Japanese Olympian in women’s table tennis, had a personal coach from northeastern China and a sparring partner from the same region to practice with her. She even joined a table tennis club in northeastern Liaoning province and picked up a heavy local accent.

China’s north has been holding Ping Pong’s supremacy domestically, and also influenced its immediate neighbors like South Korea and Japan to be world’s leaders in the sport. Olympians in Northeast Asia have dominated the event for years, with China, South Korea and Japan snatching 32, 3 and 1 gold medals respectively, accounting for 97% of the total. The dominance was only broken once by a Sweden Olympian at the 1992 Barcelona Olympics.

The reason why the three countries in Northeast Asia could almost bag all the Olympic gold medals in Ping Pong can be attributed to their close people-to-people exchanges. Though Japan was not traditionally strong in Ping Pong, the sport is quite popular because its domestic audiences expect much from the game as it represents a platform for exchange and competition with the Chinese players. According to a recent survey in Japan, Ping Pong, instead of Judo in which the Japanese team clinched a staggering 9 gold medals, was ranked as the most thrilling event during the Tokyo 2020.

Due to various historical reasons, countries in Northeast Asia have long been locked in mistrust and opposition. However, due to a long history of exchanges, people in those countries are invariably bonded together despite historical conflicts.

3. Badminton: South holds supremacy

In contrast to Ping Pong, the sport of badminton is displaying a total different picture where the dominance is long held by China’s south.

Badminton was an exhibition sport at the 1988 Summer Olympics in Seoul before debuted as an official medal sport at the 1992 Barcelona Olympics. In the past nearly three decades, China has bagged 20 out of the 39 gold medals in the Olympic badminton events, accounting for 51.2% of the total.

During previous Games, a total of 22 Chinese players were crowned as badminton champions, with seven come from central China, six from eastern China, four from southern China, and one from southwestern China. 

In the rest of Asia, Indonesia took eight, South Korea six, and Japan and Chinese Taipei each took one during previous Games. Therefore, Asian countries and regions have bagged up to 92% of all the gold medals in this sport, which reflected another thread in people-to-people exchanges in Asia.

Badminton’s development in China cannot be possible without the contributions of several legendary Indonesian Chinese players. In 1954, four Indonesian Chinese including Wang Wenjiao returned to China and helped promote the sport in the country. In 1960, more  Indonesian young players like Tang Xianhu, Hou Jiachang, Fang Kaixiang and Chen Yuniang followed suit. As professional players and later coaches, they contributed hugely to China’s current standing as one of badminton’s powerhouses. The southern part of China, due to its close proximity to Indonesia, has naturally become a fertile ground for the sport to take off in the country.

Throughout history, China’s development has also benefited from its exchanges and interactions with neighboring countries and regions. People-to-people exchanges contributed greatly to the relations between China’s north and the rest of the Northeast Asia and between China’s south and the rest of the Southeast Asia, which are also mirrored in the friendly interactions among the Olympians at Tokyo 2020.

China’s relations with its neighbors, sometimes being regarded as historical burdens, should be more rationally defined as a rich historical legacy, which during the times of great global changes, may help create a solid foundation for peace and prosperity in the Asia Pacific region.

(Zhao Jian, a senior researcher at Cloud River Urban Research Institute, has contributed to the article.)


The article was published on China net on Sep 6, 2021, and was republished by foreign media, including China Daily as today’s headlines and other platforms.