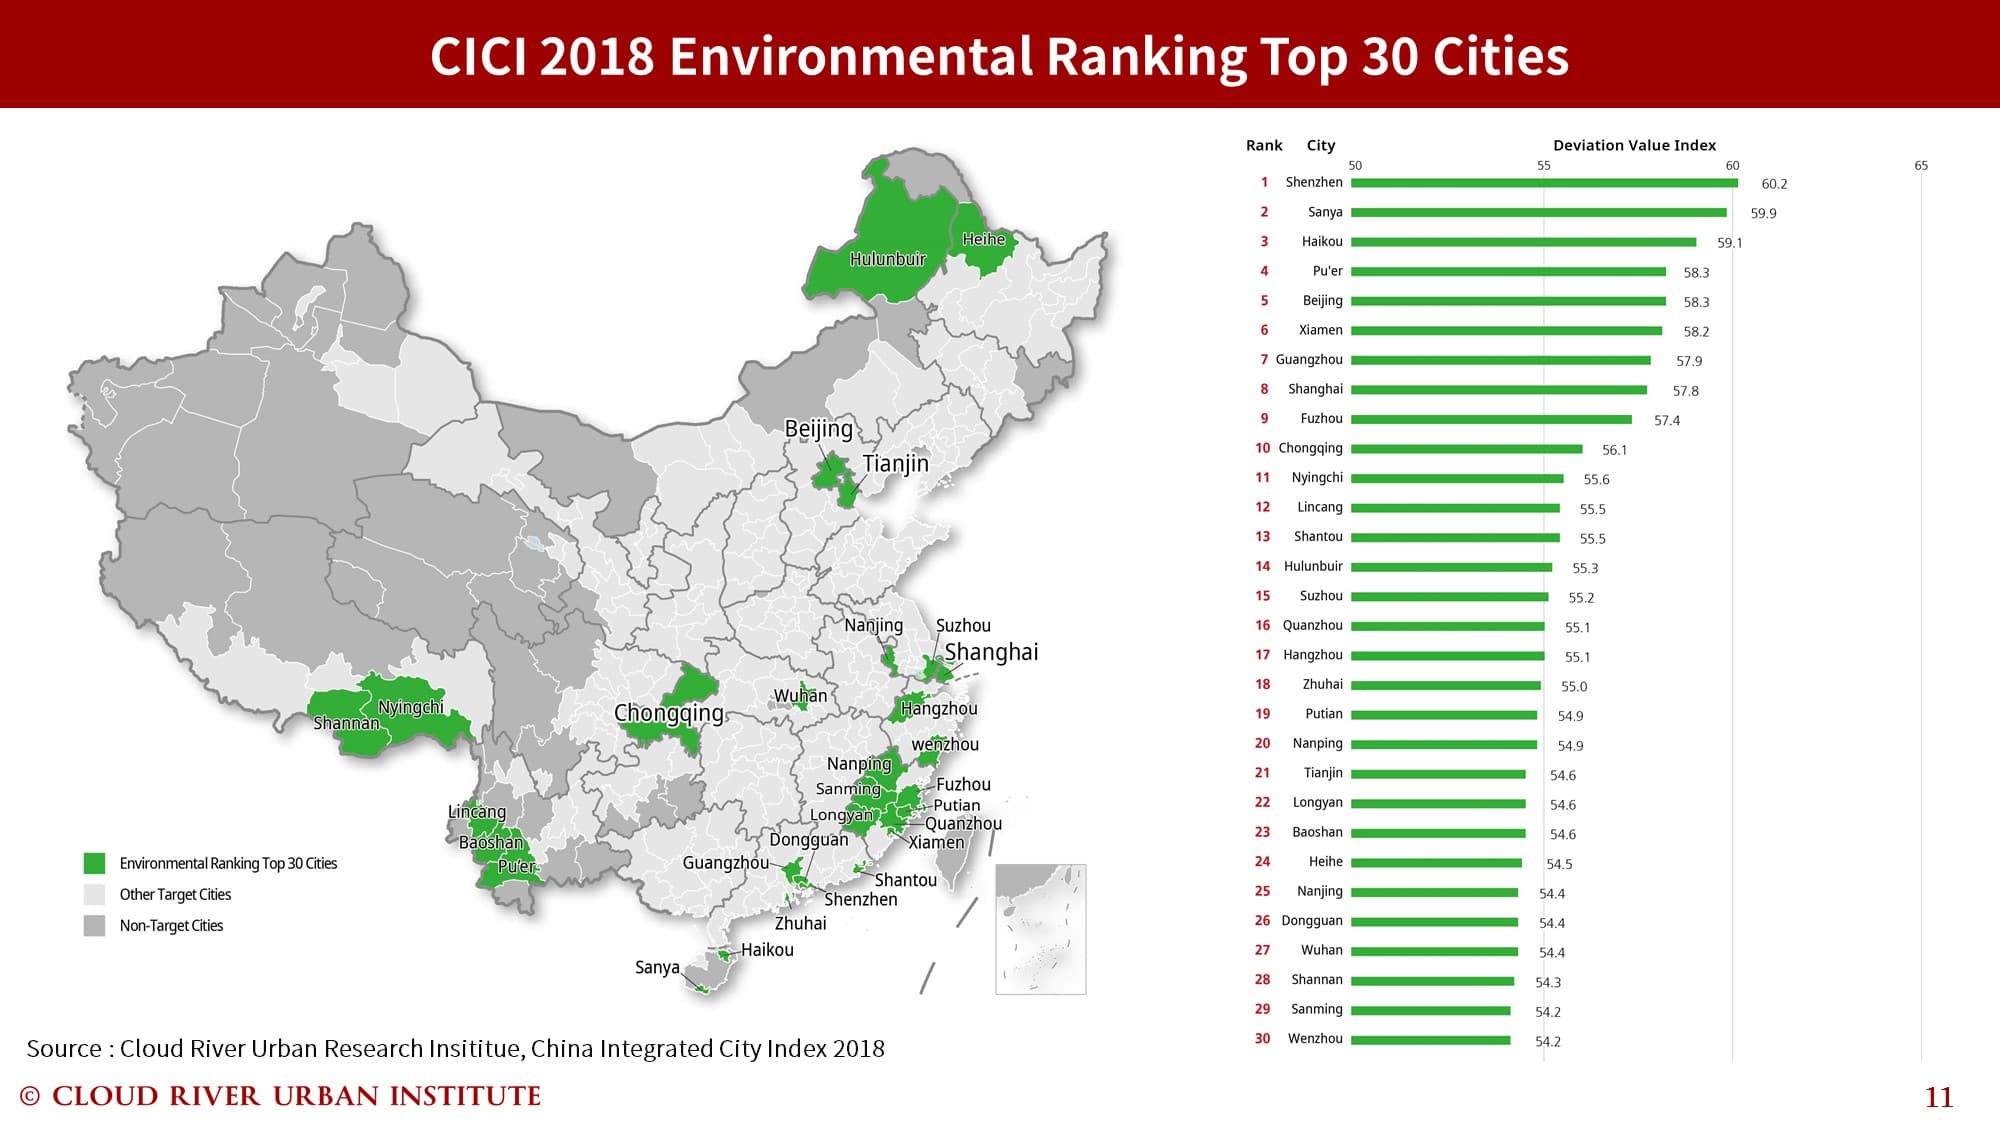
Beijing, Shanghai, and Shenzhen are ranked first, second, and third in the “China Integrated City Index 2018” released Thursday at a symposium in Beijing.
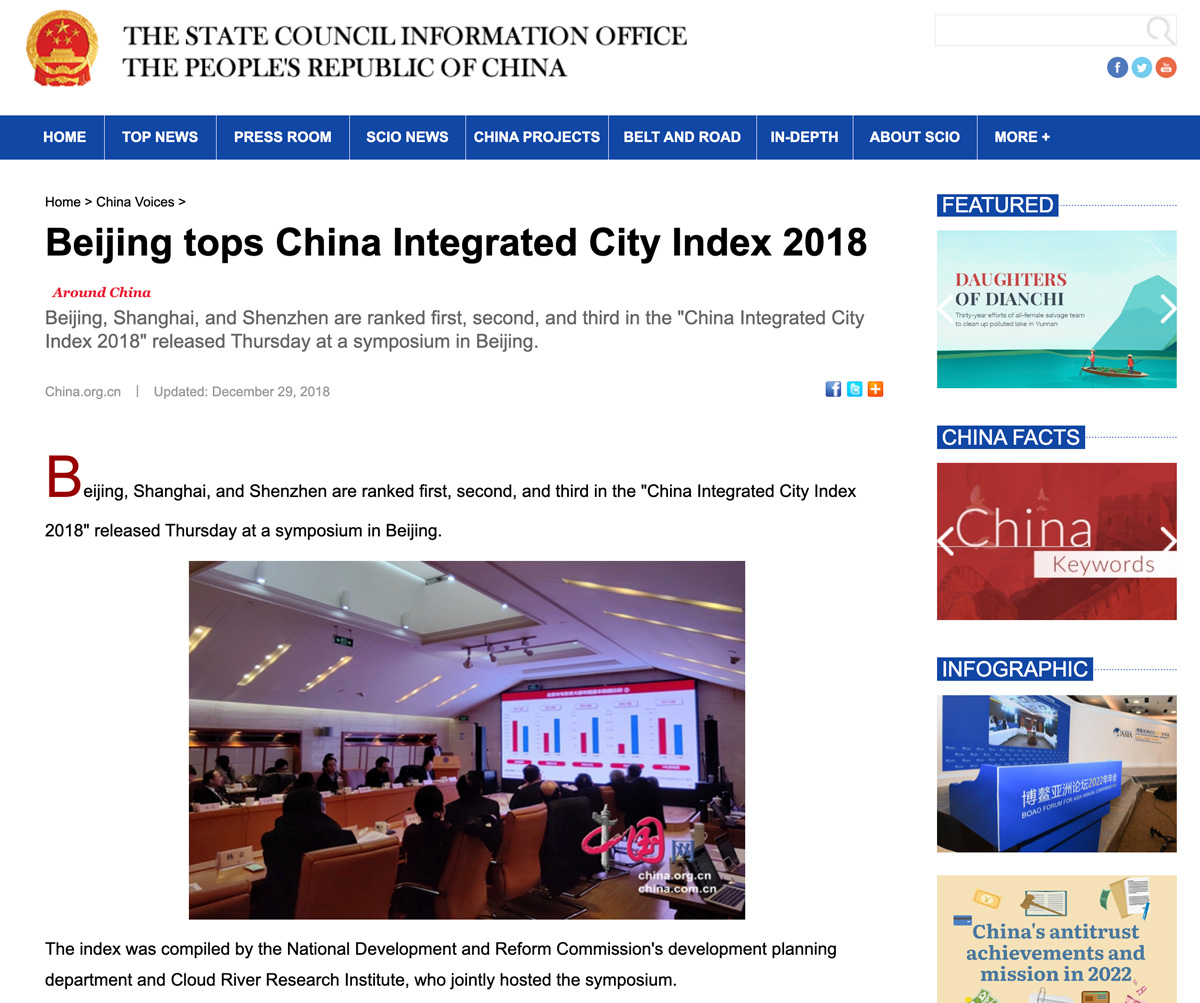
The index was compiled by the National Development and Reform Commission’s development planning department and Cloud River Research Institute, who jointly hosted the symposium.
The index evaluates 298 Chinese cities in terms of their society, economy, and environment, while establishing a set of quantitative standards and references for the urbanization and development of Chinese cities.
This year’s report focuses on the theme of “metropolitan area and development strategies.”
On rankings, Beijing, Shanghai, and Shenzhen are followed by Guangzhou, Tianjin, Hangzhou, Chongqing, Chengdu, Nanjing, and Wuhan to round up the top 10.
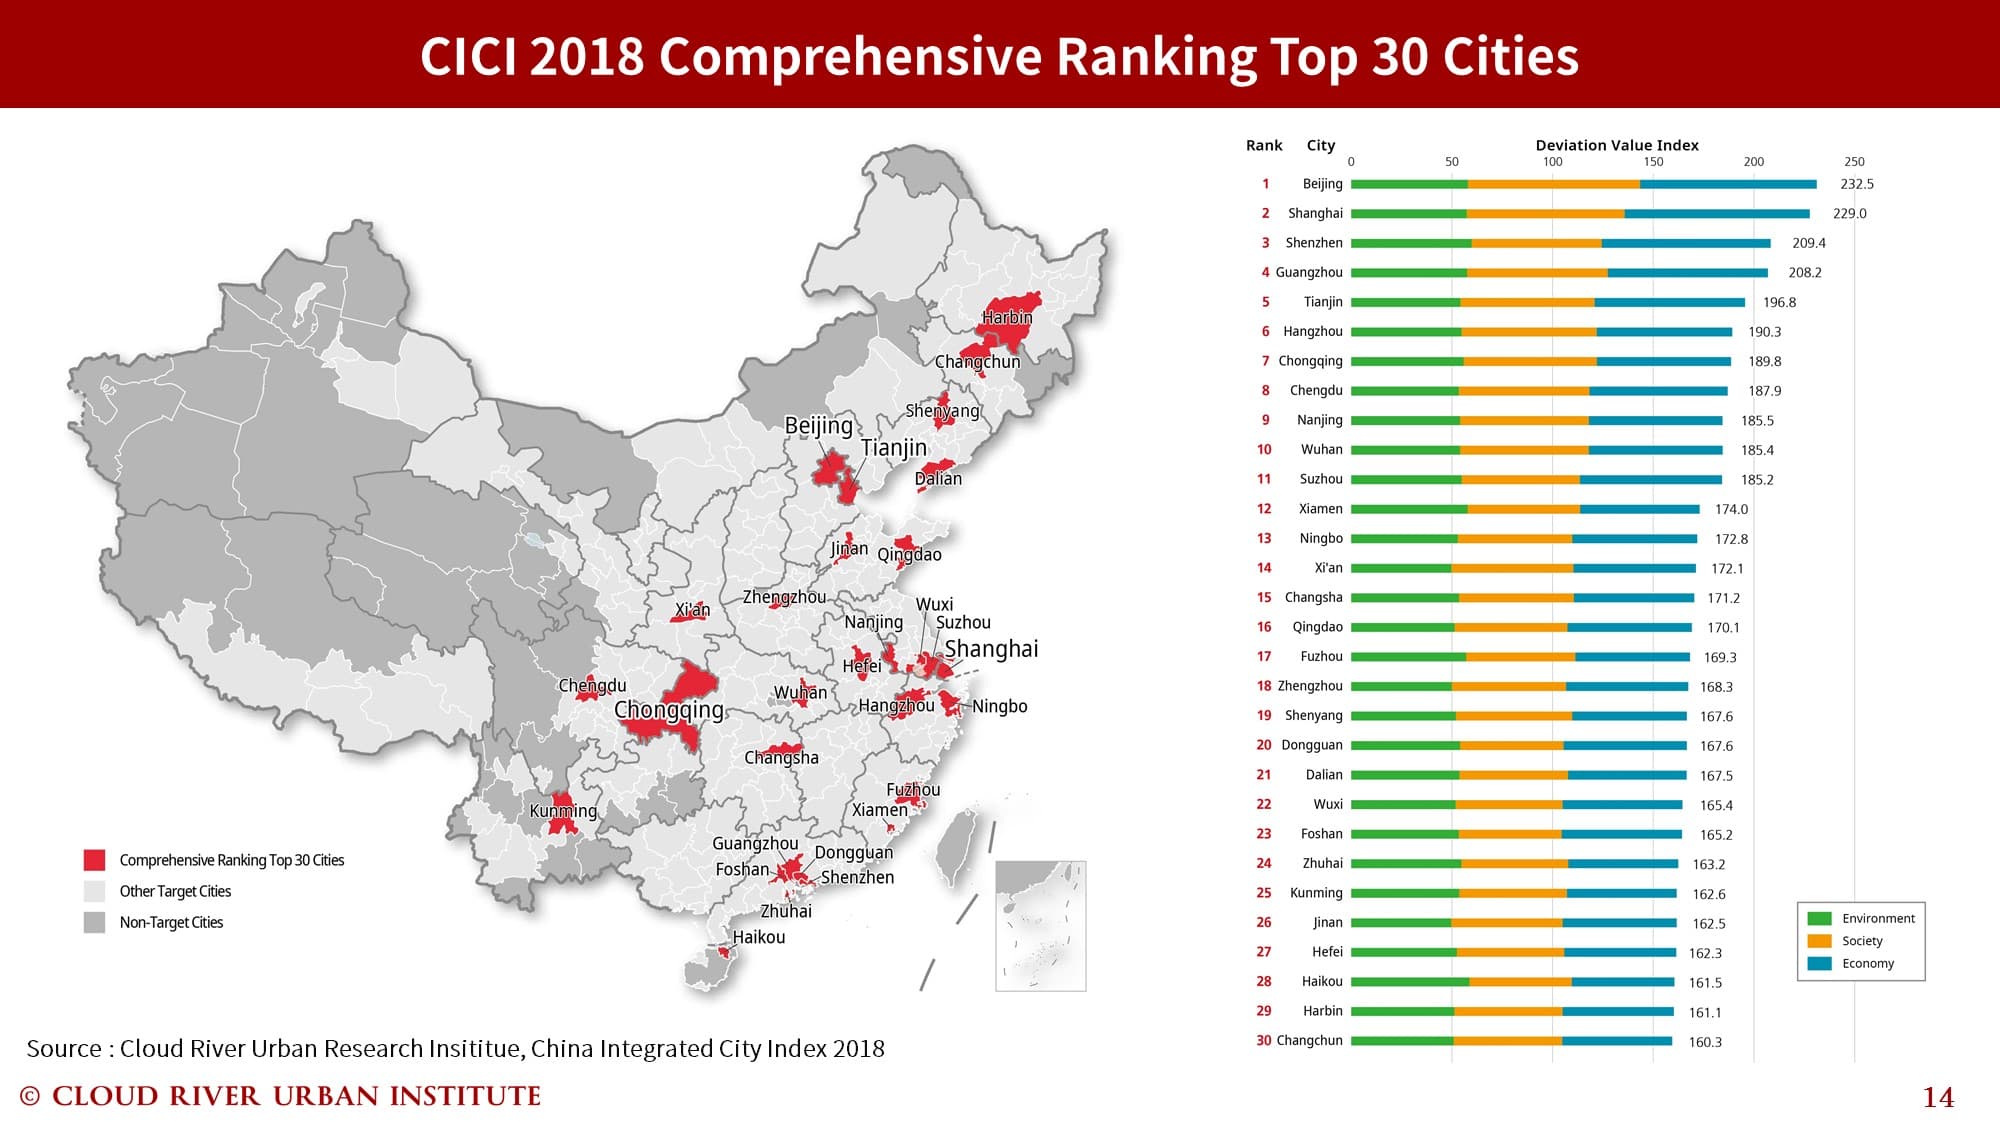
In the environment category, Shenzhen, Sanya and Haikou take the first three positions, followed by Pu’er, Beijing, Xiamen, Guangzhou, Shanghai, Fuzhou and Chongqing.
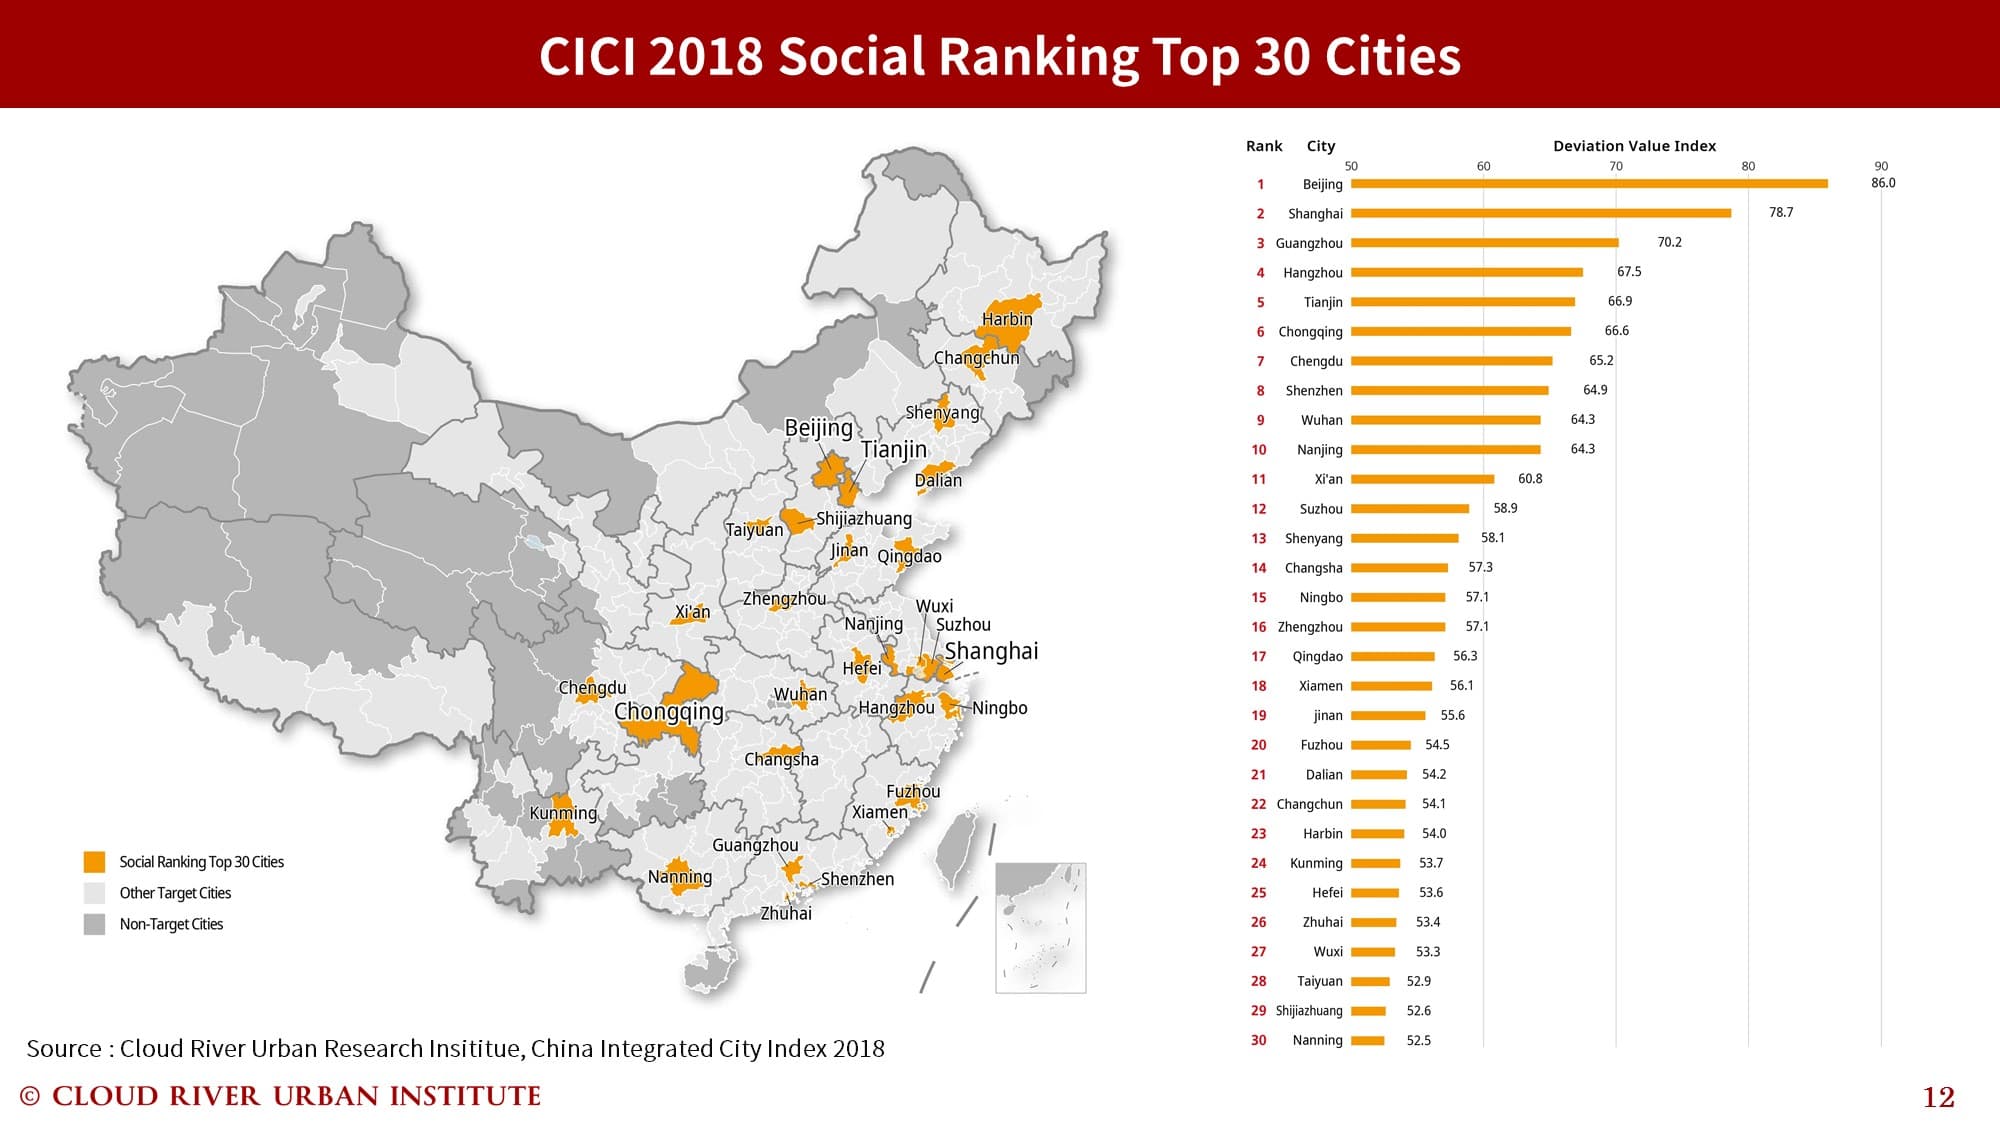
In the society category, Beijing, Shanghai, and Guangzhou are the top three followed by Hangzhou, Tianjin, Chongqing, Chengdu, Shenzhen, Wuhan and Nanjing.
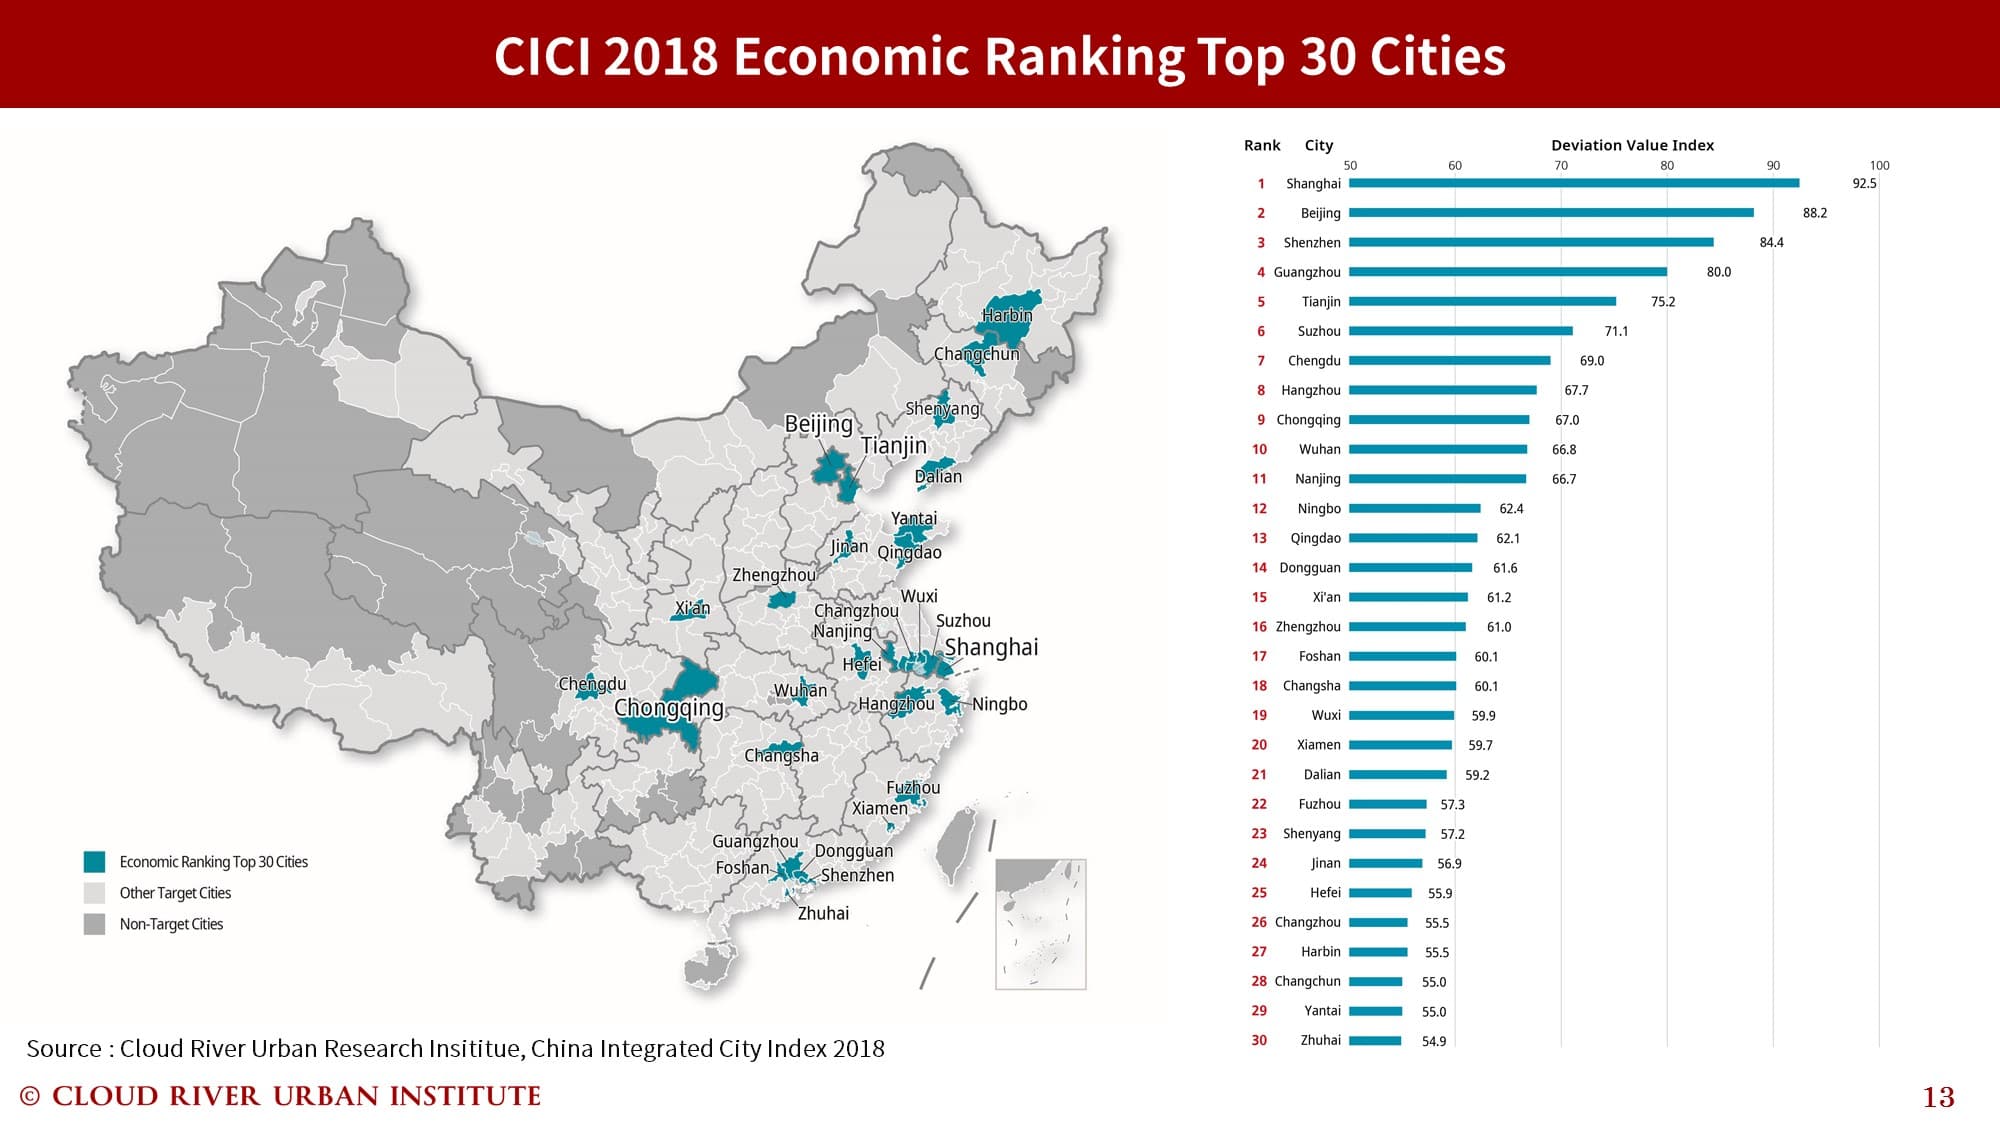
In terms of the economy index, Shanghai, Beijing and Shenzhen are the top three cities, followed by Guangzhou, Tianjin, Suzhou, Chengdu, Hangzhou, Chongqing and Wuhan.
“Based on indexes of all categories, we can observe a clear evidence of the concentration of functions in big cities as well as the polarization between cities,” said Zhou Muzhi, head of Cloud River Research Institute and the index expert group.
For instance, the top 30 cities account for 42.5 percent of the nation’s total GDP, 74.9 percent of the manufacturing export, 92.8 percent of universities listed in Project 211 and Project 985, and 50.2 percent of Tier 3A hospitals.
As to the number of listed companies on the main board, enterprises from the top 30 cities account for 69.7 percent, among which 39.6 percent are located in the top three cities.
Meanwhile, airports in the top 30 cities have received a large number of visitors, making up 81.3 percent of the total, while container ports in the top 30 have contributed to up to 97.8 percent of the nation’s total throughput.
A major feature of the report is the introduction of the concept of densely inhabited district (DID). The report defines a district with a population density of 5,000 or more per square kilometer as a DID, and it analyzes the relationship between the DID population and key indicators. It found that the DID population is highly correlated with the vitality and quality of urban development.
Zhou said China has overemphasized the pressure on the urban environment and infrastructure brought by population size and density without realizing that high-density population is an important foundation of urban development.
He said China must discard such a misconception, promote intelligent urban governance and enhance the vitality and quality of the development through improving DID quality and scale.
“The real economic development of China has only started since the beginning of the 21st century,” Zhou said. “There are two main driving forces for China’s economic development. One is international trade after it joined the WTO and the other is urbanization.”
The report analyzes key indicators of urbanization in China from 2000 to 2016, showing that during this period, China’s GDP increased by 330 percent and the urban area expanded 180 percent, whereas the population in DID only increased 20 percent.
“It is more of the urbanization in land than urbanization in population,” Zhou said.
During this period, the energy consumption per unit of GDP fell by 40 percent, and the carbon dioxide emissions per unit of GDP fell by 30 percent. However, the energy consumption per capita rose sharply. For example, the electricity consumption per capita increased 330 percent, leading to an increase of 210 percent in the total amount of carbon dioxide emissions and making China the world’s largest carbon dioxide emitter.
Zhou said he believes China has an urgent need to improve the quality of economic development and urban construction.
The report also compares two major metropolitan areas of East Asia — the Beijing metropolitan area (Beijing and its suburbs) and the Tokyo metropolitan area (Tokyo, Kanagawa, Saitama, and Chiba) in terms of population, GDP, carbon dioxide emissions, and PM2.5 levels.
According to the report, while the Beijing metropolitan area is 1.2 times the size of the Tokyo metropolitan area, its permanent population and DID population are only about 60 percent of the Tokyo metropolitan area.
Beijing’s GDP is only 30 percent of the Tokyo metropolitan area, and its GDP per capita is only half that of the Tokyo metropolitan area. However, Beijing’s energy consumption per unit of GDP is 7.4 times that of the Tokyo metropolitan area, and Beijing’s carbon dioxide emissions per unit of GDP are 4.7 times that of Tokyo’s.
As a result, despite a much smaller population and GDP, Beijing’s carbon dioxide emissions are 1.2 times that of the Tokyo metropolitan area.
“Beijing needs to implement the metropolitan area development strategies, optimize the urban DID spatial structure as well as the economic structure, improve the lifestyle, and enhance the resource utilization efficiency,” Zhou said.
Zhao Qizheng, former director of the State Council Information Office and the first director of the Pudong New Area Management Committee, spoke highly of the index and said he believes the index provides new ideas, discourses, and frameworks for understanding and governing a city.
Yang Weimin, chief expert of the index expert group, said he believes the three-dimensional view of cities reflects a well-balanced conception and provides guidance for a more comprehensive, coordinated and sustainable development of cities.
“The report is not only an evaluation, but also a direction for progress,” Yang said.
The article was first published on China SCIO, China.org.cn on Dec 29, 2019 and reprinted by other news websites.
