
Zhou Muzhi, professor of Tokyo Keizai University
Editor’s note: The soaring carbon dioxide (CO2) emissions have led to frequent occurrences of climate anomalies and extreme climate disasters all over the world, and global climate change has become a common challenge for mankind. No one can insulate itself from climate crises. In this context, most of the heads of 40 countries and regions set clear targets to reduce CO2 emissions by 2030 at the Leaders Summit on Climate on April 22, 2021.Following the commitment to striving to peak CO2 emissions by 2030 and achieve carbon neutrality by 2060 at the United Nations General Assembly on Sept. 22, 2020, China said at this summit that the targets of carbon peak and carbon neutrality have been added to its overall plan for ecological conservation.
How are global carbon emissions like today? What are the factors that affect carbon emissions? What challenges are countries in the world facing? You will find in this article by Professor Zhou Muzhi all the answers in detail based on the data analysis of the top 30 CO2 emitting countries and regions in the world.
The 21st century has seen the most rapid growth of carbon dioxide (CO2) emissions in human history. If we put global CO2 emissions in the timeline, three time periods would stand out: first, the world’s total volume of CO2 emissions up until 1979 accounted for only 54% of cumulative emissions; second, the CO2 emissions during 1980-1999 accounted for 15.3% of cumulative emissions; third, the CO2 emissions during 2000-2019 accounted for up to 30.7%. In other words, global CO2 emissions nearly doubled since 1980. Even more notably, CO2 emissions during 2000-2019 doubled that during 1980-1999, and global CO2 emissions have skyrocketed since the 21st century.
1. Global CO2 emissions
Today, 79 countries and regions able to accurately track their CO2 emissions are responsible for 96.7% of global emissions.
During 2000-2019, 28 countries (the US, the U.K., Germany, Ukraine, Japan, Italy, France, Greece, Venezuela, Spain, the Czech Republic, the Netherlands, Denmark, Uzbekistan, Romania, Finland, Belgium, Sweden, Portugal, Hungary, Slovakia, Ireland, Switzerland, Bulgaria, Slovenia, Croatia, North Macedonia, and Norway) out of the 79 saw declines in their CO2 emissions. Those countries are generally composed of two types: developed countries (almost all the developed countries in the West included) and those with a sluggish economy.
On the contrary, the CO2 emissions of the remaining 51 countries and regions, mostly developing ones, increased incrementally, with those of newly industrialized countries led by China, rising significantly. In particular, the increase contributed by them was much greater than the reduction contributed by the aforementioned 28 countries. In fact, the reduction offset only 15.7% of the increase. It was the 51 countries and regions that drove up the rapid growth of global CO2 emissions during the period.
Today’s global CO2 emissions have three main characteristics. First, the countries and regions who have reduced emissions co-exist with those still on the path of continuous emission increase.
Second, top emitters contribute to the vast majority of global emissions. In 2019, the top five emitters, including China, the US, India, Russia, and Japan, were responsible for 58.3% of global emissions. In other words, nearly 60% of global emissions came from the leading five countries. We can see from a further look at the list that the top 10 countries and regions accounted for up to 67.7% of global emissions, and the top 30 countries and regions 87%. The US and Japan pledged to cut emissions by 50-52% (compared with 2005) and 46% (compared with 2013) by 2030, respectively. These two challenging goals are undoubtedly a powerful boost for the upgrading of their energy structure and industrial structure.
Third, China ranks first with a striking volume and a contribution of 28.8%. Its emissions in 2019 were already approximately equivalent to the combined emissions of the four countries running behind — the US, India, Russia, and Japan. That is precisely why China’s commitment to striving for carbon neutrality by 2060 is both significant and challenging.
2. Six main factors affecting CO2 emissions
Six main factors must be taken into consideration when discussing CO2 emissions.
First, CO2 emissions per unit of energy consumption, also known as carbon intensity of energy. It is related to the quality and efficiency of energy. For example, China’s energy structure, with coal as the primary energy source, gives off relatively higher CO2 emissions per unit of energy consumption. However, as its primary energy sources switch from coal to natural gas in thermal power generation, accompanied by enlarged shares of renewable energy such as wind power, solar power, and hydropower as well as the development of nuclear power, its CO2 emissions per unit of energy consumption will decrease gradually.
Second, energy consumption per unit of gross domestic product (GDP), also known as energy intensity. It goes up in the early stages of industrialization, but then turns to go down as the level of industrialization increases and the industrial structure changes, the backward productivity being phased out, and the equipment and working procedures being optimized. Therefore, in the long term, the curve of a country’s energy consumption per unit of GDP will rise sharply in the early stages of industrialization, but a turning point to a downward trend will ensue after a certain period of time if the industrialization develops smoothly.
Third, CO2 emissions per unit of GDP, also known as carbon intensity. It measures the correlation between a country’s economy and its CO2 emissions. The interplay between CO2 emissions per unit of energy consumption and energy consumption per unit of GDP determines the level of carbon intensity.
Fourth, per capita GDP. It measures the level of economic development. As economy develops, industrial activities expand, and people’s lifestyles modernize, per capita energy consumption will increase, leading to higher CO2 emissions.
Fifth, total population and demographic structure. The larger the population of an economy, the higher its CO2 emissions will be. The impact of demographic structure on energy consumption must also be taken into consideration.
Sixth, CO2 emissions per capita. It embodies the interplays of all the previous five factors, and it is a key of measuring the CO2 emissions of an economy. Its turning point marks the peak of CO2 emissions in a real sense.
Generally speaking, when the socio-economic development reaches a certain level, CO2 emissions per unit of energy consumption and energy consumption per unit of GDP are the first to turn downward, and CO2 emissions per capita will respond later. However, only when CO2 emissions per capita start for a continuous decline does it signify a real turning point.

3. China’s achievements and missions
Since China’s accession to the World Trade Organization, its economy has entered a chapter of tremendous development fueled by export and urbanization. During 2000-2019, its exports increased by nine times, and the urban area (the area of urban land that meets certain standards for construction and infrastructure) by 1.9 times and GDP by 4.2 times, both in real terms.
The soaring economy greatly increased China’s real GDP per capita by 3.6 times, from US$2,151 in 2000 to US$9,986 in 2019. Large-scale industrial development, accelerated urbanization, and increasingly modernized lifestyles of a large population resulted in a significant expansion in energy consumption, which is the fundamental cause of the increase of CO2 emissions in China.
On the plus side, China’s CO2 emissions per unit of energy consumption, energy consumption per unit of GDP, and CO2 emission per unit of GDP have all reached their turning points and showed obvious downward trends. China’s CO2 emissions per unit of energy in 2019 decreased by 10% compared with 2000, and its energy consumption per unit of GDP and carbon intensity both dropped by 40% during the period, a result of China’s relentless efforts in energy conservation, emission reduction, and clean energy development in recent years. China has achieved remarkable results in promoting green, sustainable, and low-carbon development.
However, during the same period, China’s CO2 emissions per capita increased by 1.6 times. Despite the downward trends of the previous three factors, China is yet to reach its peak in CO2 emissions per capita. How to reach the turning point quickly and drive down CO2 emissions per capita steadily will be the determining factor for China to fulfill its commitment to striving to peak CO2 emissions by 2030 and achieve carbon neutrality by 2060.
4. Data analysis of top 30 emitting countries and regions
The top 30 emitting countries and regions make up nearly 90% of global CO2 emissions, and they are also home to 69% of the world’s population, producing 84% of the world’s GDP. Moreover, during 2000-2019, they contributed as much as 92.7% of global emission growth, a reality worthy of a thorough analysis.
(1) Changes of CO2 emissions
During 2000-2019, global CO2 emissions increased by 40%. However, among the top 30 emitters, seven major countries — the US, Japan, Germany, the U.K., Italy, France, and Spain — achieved CO2 emission reductions. Specifically, the U.K. reduced its emissions by 30%, Germany, Italy, and France by 20%, and the US, Japan, and Spain by 10%.
In the meantime, 23 countries with increased emissions, led by China and India, more than cancelled out the emission cuts made by the seven above. In fact, the reduction made by the aforementioned seven countries only offset 13.2% of the increase contributed by the 23, resulting in a steep rise in global emissions.
During the period, the emissions of China and India grew by 1.9 times and 1.6 times, respectively. China overtook the US in 2005 to become the economy with the largest CO2 emissions worldwide. India rose to third place, surpassing Japan and Russia. Vietnam, currently ranking 22nd in CO2 emissions, became the country with the most rapid increase in emissions at a growth rate of 510%.
(2) Changes of primary energy consumption
During 2000-2019, global primary energy consumption increased by 48%. Specifically, China became the economy with the fastest growth of energy consumption at a rate of 230%, and exceeded the United States in 2009 to be the world’s biggest consumer of primary energy. India, with a growth rate of 160%, became the third biggest consumer of primary energy. Vietnam became the fastest-growing country in primary energy consumption during the period with a rate of 450%, ranking 22nd in primary energy consumption.
However, 22 countries reduced their primary energy consumption during the same period. Six countries out of the 22 are from the top 30 emitters, which are Japan, the U.K., France, Germany, Italy, and the US in the order of the magnitude of reduction. All the six countries are developed ones, among which the US even achieved a 45.4% real GDP growth during the period. In other words, the developed countries achieved fruitful outcomes in energy conservation and emission reduction.
(3) CO2 emissions per unit of energy consumption
During 2000-2019, CO2 emissions per unit of energy consumption were reduced across the top 30 emitters except India, Japan, Indonesia, South Africa, Vietnam, and Kazakhstan. The U.K. and Thailand decreased their CO2 emissions per unit of energy consumption by 20%, and China, the US, Russia, Germany, Iran, Saudi Arabia, Canada, Brazil, Australia, Turkey, Italy, Poland, France, the United Arab Emirates, China’s Taiwan, Spain, and Singapore by 10%.
The US has begun to develop new energy and CO2 emission reduction policies since President Clinton. In spite of policy changes under different presidents, the country has been continuously optimizing its energy structure. By 2017, renewable energy power generation had already accounted for 42% of the total power generation in the 11 Western states, as coal-fired power generation was phased down. Notably, the policy to push for small-scale natural gas power generation originated during the presidency of President Carter, and small-scale power generation fueled by natural gas became the country’s largest power source in 2002.
Japan stood out as a unique case in the developed world. The country resorted to thermal power generation on a very large scale after the nuclear power failure in 2011. One third of its power came from coal-fired power generation, resulting in the increase in its CO2 emissions per unit of energy consumption.
Coal-fired power generation occupies a larger proportion in the power sources of developing countries. For example, it accounts for as much as 46% in the power structure of Southeast Asia.
How to find an efficient way to terminate coal-fired power generation has become the most important step for the globe to achieve carbon neutrality. On April 21, 2021, in an article published on Nikkei, the United Nations Secretary-General Antonio Guterres said that developed economies must commit to phasing out coal by 2030; other countries must do this by 2040.
China relies heavily on coal-fired power generation. Despite the decrease in its CO2 emissions per unit of energy consumption, coal still takes up as much as 57.7% of its primary energy consumption structure. Its energy structure needs to be optimized urgently.
At the Leaders Summit on Climate on April 22, the Chinese leader said that China will strictly control coal-fired power generation projects, and strictly limit the increase in coal consumption over the 14th Five-Year Plan period and phase it down in the 15th Five-Year Plan period. It indicates that China has truly gotten on a fast track of primary energy transition.
The analysis of the CO2 emissions per unit of energy consumption of the 30 countries and regions shows that with the improvement of technologies, the increase of equipment investment, and the optimization of energy structure, most countries will steadily reduce their CO2 emissions per unit of energy consumption. However, there are also cases whose CO2 emissions per unit of energy consumption increased even further, for example, Japan, due to radical changes in its energy structure caused by nuclear power failure, and India, Indonesia, and Vietnam, due to accelerated industrialization in recent years.
(4) Energy consumption per unit of GDP
During 2000-2019, energy consumption per unit of GDP decreased across the top 30 emitting countries and regions except Iran, Saudi Arabia, Brazil, Thailand, Vietnam, and the United Arab Emirates. Specifically, countries like China, Russia, the U.K., and Poland saw reductions by 40%; the US, Japan, Germany, South Korea, France, China’s Taiwan, and Kazakhstan by 30%; India, Indonesia, Canada, South Africa, Australia, Italy, Spain, and Malaysia by 20%; and Mexico, Turkey, Singapore, Egypt, and Pakistan by 10%.
With the improvement in technologies, the increase of equipment investment, and the optimization of energy structure, most countries have continuously improved their energy efficiency. During 2000-2019, energy consumption per unit of GDP on a global scale dropped significantly by 20%. There are also exceptions. For instance, Iran, whose economy suffered from the sanctions of the US, and Vietnam, due to rapid industrialization, both saw declines in energy efficiency, while their energy consumption per unit of GDP went up by 50% and 60%, respectively.
(5) Changes of CO2 emissions per unit of GDP
During 2000-2019, CO2 emissions per unit of GDP dropped across the top 30 CO2 emitters, except Iran, Saudi Arabia, Vietnam, and the United Arab Emirates. Specifically, the U.K. and Poland halved their CO2 emissions per unit of GDP, the largest reductions in carbon intensity; China cut its CO2 intensity by 40%, which was also a remarkable decrease; the US, Russia, Germany, and France, and China’s Taiwan by 40%; South Korea, Canada, Australia, Italy, Spain and Kazakhstan by 30%; India, Japan, South Africa, Turkey, Malaysia, Singapore, and Egypt by 20%; and Indonesia, Mexico, Thailand, and Pakistan by 10%.
On the contrary, Saudi Arabia, the United Arab Emirates and Vietnam increased their carbon intensity by 10%, 40% and 80%, respectively.
Thanks to the steep decline in carbon intensity among major emitters, global CO2 emissions per unit of GDP decreased by 18.1% in the period.
China has scored huge success in reducing its carbon intensity, as its carbon intensity accounts for only 76.1% of India’s, 64.9% of Russia and 60.3% of Vietnam. However, China is still lagging behind developed countries, since China’s carbon intensity is 180%, 260%, 450% and 500% higher than the US, Japan, Germany, the U.K. and France, respectively. Therefore, the 14th Five-Year Plan (2021-2015) set out a scheme in which controlling carbon intensity acts as the main task supplemented with controlling carbon emissions. How to quickly reduce carbon intensity and shift to a low-carbon development pattern remains a daunting challenge.

5. Analysis of carbon emission peaks of top 30 emitting countries and regions
To scientifically analyze peaks of carbon emissions and avoid the disorder caused by the abnormal value in a single year, this article introduces the concept of “moving average” to analyze the peaks of carbon emissions. The analysis of “moving average line” is a method of averaging the data in a certain period, and looking at the trend by moving average lines of average values in different periods. It is widely used in the trend analysis in financial and business areas, and has recently been applied to the analysis of COVID-19 spreading or receding.
This article calculates the average value on a five-year basis, and analyzes CO2 emissions per capita and CO2 emissions of each country from 1980 to 2019 through the method of moving average lines, so as to evaluate the performance of each country in carbon emissions, energy conservation and emission reduction through judgment of the turning point and trend in a more accurate way.
(1) Analysis of peaks of CO2 emissions per capita
Seen from the “moving average line” analysis of CO2 emissions per capita, 17 of the top 30 emitting countries and regions saw their CO2 emissions per capita continued to decline after reaching a peak — the US, Russia, Japan, Germany, Saudi Arabia, Canada, South Africa, Mexico, Brazil, Australia, the U.K., Italy, Poland, France, Spain, Malaysia and Egypt.
On the contrary, 13 of the top 30 emitters — China, India, Iran, South Korea, Indonesia, Turkey, Thailand, Vietnam, the United Arab Emirates, Kazakhstan, Singapore, and Pakistan saw their CO2 emissions per capita rise in the period.
Global CO2 emissions per capita continued to drop after reaching a peak in 2011, largely thanks to the efforts of developed countries in cutting emissions.
During 2000-2019, the U.K. cut CO2 emissions per capita by 40%, the US, Italy, France and the United Arab Emirates by 30%, Germany and Spain by 20%, Japan, Canada and Australia by 10%. Those major Western countries are key contributors to energy conservation and emission reduction.
However, CO2 emissions rose due to an increase in energy consumption in newly industrialized nations that experienced industrialization, urbanization and improved life styles. In the period, CO2 emissions per capita in China and India rose by 160% and 100%, respectively, and Vietnam surged by a staggering 400%. CO2 emissions per capita in Kazakhstan went up by 90%, Indonesia by 80%, Iran by 70%, Thailand by 60%, Turkey, Malaysia and Singapore by 40%, South Korea, Saudi Arab, Egypt and Pakistan by 30%, Brazil by 20%, and Russia and China’s Taiwan by 10%. Overall, CO2 emissions per capita rose in newly industrialized nations and regions.
Quite notably, China’s current CO2 emissions per capita have surpassed the U.K. and France. Policy makers should put the goal of peaking CO2 emissions per capita as soon as possible high on the agenda.
(2) Analysis of CO2 emission peaks
Seen from the “moving average line” analysis, CO2 emissions in 12 countries of the top 30 emitters — the US, Russia, Japan, Germany, South Africa, Mexico, Brazil, the U.K., Italy, Poland, France, and Spain, assumed a trend of declining after reaching a peak. Saudi Arabia, Canada, Australia, Malaysia and Egypt haven’t peaked their CO2 emissions, although their per capita CO2 emissions have peaked. That’s because their populations increased remarkably from 2000 to 2019. Specifically, Saudi Arabia’s population increased by 70%, Canada by 20%, Australia by 30%, Malaysia by 40%, and Egypt by 50%. Population growth has delayed the peaking of carbon emissions.
The US encountered a similar situation. From 2000 to 2019, US population grew by 47.35 million, delaying the peaking of carbon emissions. Although the US peaked its CO2 emissions per capita in 2000, it didn’t peak CO2 emissions until 2007.
China’s CO2 emissions currently grows at a slower pace, but haven’t reached a peak. With the target of peaking carbon emissions by 2030, all sectors across China are formulating plans for carbon drive, in the hopes of reaching the goal as scheduled or even ahead of schedule.

6. China and US: biggest players and beneficiaries of globalization
The world entered a new stage of globalization in the 21st century, with a sharp increase in global trade, investment, technology transactions, and personnel exchanges. If we put global exports in the timeline, we will find the global export volume in 1979 accounted for only 10.8% of the current volume. The net growth during 1980-1999 doubled that of 1979, and made up 23.2% of today’s global export volume. Exports were given a boom during 2000-2019, with growth in the period accounting for 66% of the current volume. In other words, 70% of today’s global exports were created in the 21st century, meaning that wealth model was swiftly shifted from the national economy to the global economy.
It was the globalization that made the explosive growth of global wealth happen. Global GDP in real terms during 2000-2019 grew by 74.5%. In the period, China’s GDP in real terms grew by 420%, becoming the biggest contributor to the world economic growth. Despite a modest growth rate of 45.4% in the period, which was below the world’s average, the US had a colossal growth of wealth due to its large economy.
In the period, 49.6% of the world’s GDP in real terms was created by China and the US Specifically, China accounted for 32.2% of the world’s increment, the US 17.4%, ranking first and second respectively in the world. The remaining countries in the top 10 were India, the U.K., South Korea, Germany, Russia, Indonesia, Japan and Brazil. Compared with China and the US, those countries had a much smaller share of the global GDP increment.
It is fair to say that it was the division of labor and cooperation between China and the US that propelled globalization and created an age marked by the explosive growth of wealth in human history. The two countries are the biggest players and beneficiaries of the globalization age.
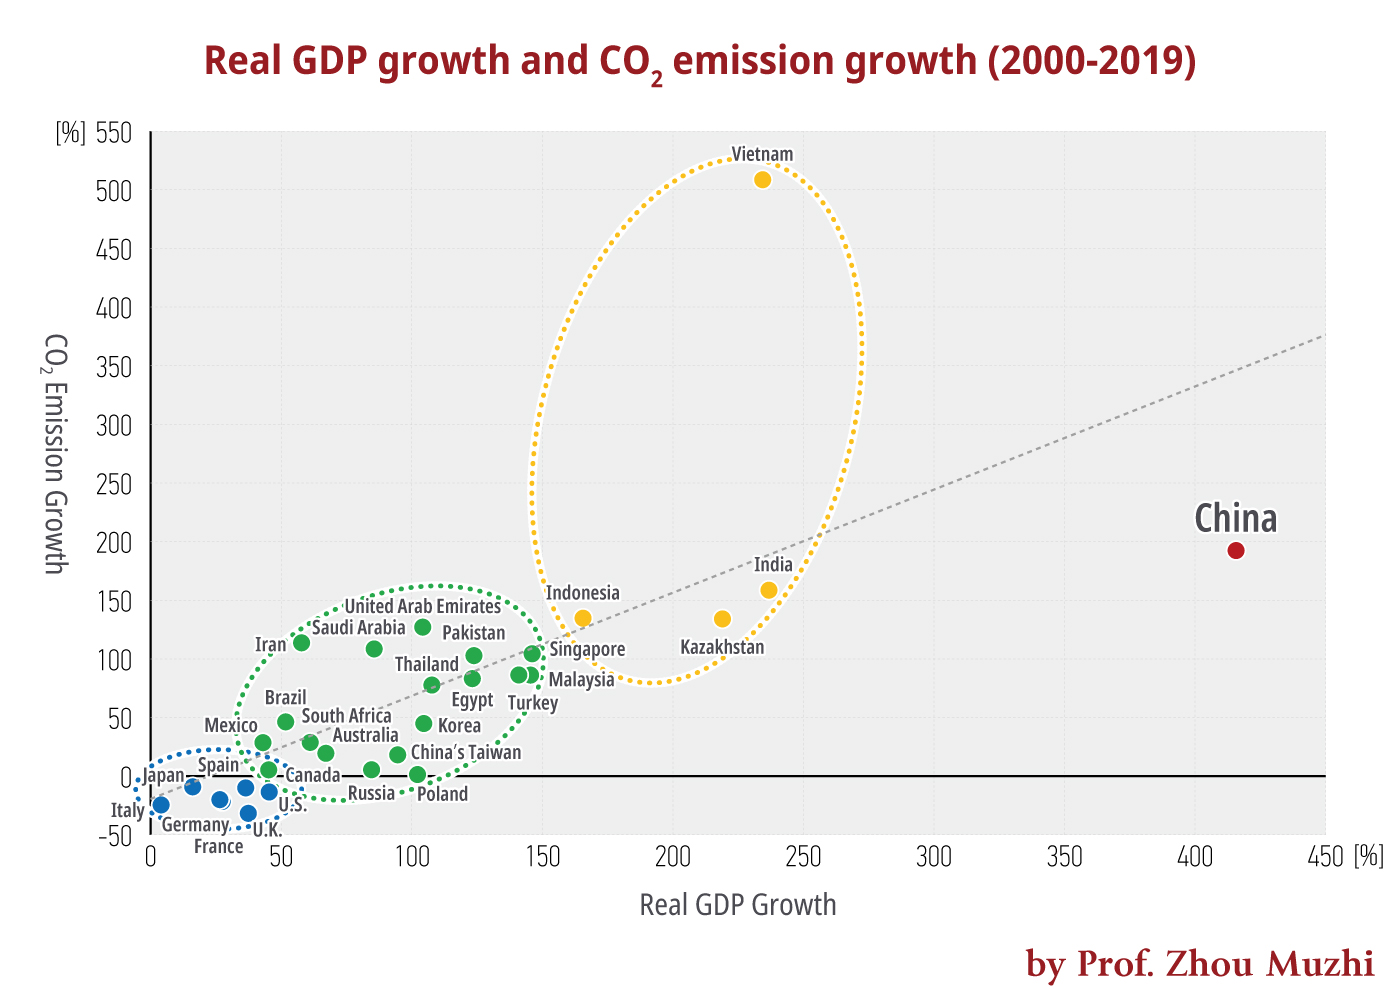
How is the relationship between economic growth and CO2 emissions in this period? Measured by GDP growth rates in real terms and CO2 emission growth rates, the top 30 emitters can be divided into three groups.
The first group includes those countries experiencing a low growth of real GDP and a negative growth of carbon emissions, such as the US, Japan, Germany, the U.K., Italy, France, and Spain, all among major developed countries.
The second group includes 18 countries and regions experiencing a medium-to-low economic growth and a low growth of carbon emissions — Russia, Iran, South Korea, Saudi Arabia, Canada, South Africa, Mexico, Brazil, Australia, Turkey, Poland, Thailand, the United Arab Emirates, China’s Taiwan, Malaysia, Singapore, Egypt, and Pakistan.
The third group includes those countries and regions experiencing a medium-to-high economic growth and a rapid growth of carbon emissions, such as India, Indonesia, Vietnam and Kazakhstan. Among them, Vietnam stands out with a remarkable growth of carbon emissions.
The fourth group includes China that enjoys a fast-growing economy. Its growth rate of carbon emissions is roughly the same with that of the third group.
Graphic: Real GDP growth and CO2 emission growth (2000-2019)
From the analysis above, the first 20 years of the 21st century was marked by the global division and cooperation of labor as well as the exponential growth of global wealth fueled by scientific advances and globalization. In the 20 years which was arguably an extremely special period in human history, labor division developed greatly, accompanied by huge amounts of CO2 emissions.
In the next 20 years, human needs to rely on cooperation to promote energy conservation and emission reduction, realize the growth of a green circular economy and combat climate change through improving the quality of development to retain hard-won prosperity.
Xie Zhenhua, China’s special envoy for climate change affairs, met with his US counterpart John Kerry to talk about the climate crisis in Shanghai from April 15-16. In a joint statement issued after the talks, the two parties stressed that the two countries will work together with other countries to cope with the climate crisis and stay committed to implementing the Paris agreement alongside with other signatories.
The IEA estimates global CO2 emissions will increase 4.8% in 2021 year on year, which indicates that the carbon reduction drive still faces grim challenges. China and the US, the biggest players and beneficiaries of the global division of labor and wealth growth, should take the lead in developing the global green circular economy in the next 20 years.
The author is a professor of Tokyo Keizai University and president of Cloud River Urban Research Institute.
The article was published on China SCIO Online on May 09, 2021, and was republished by foreign media, including China Daily, China net, as well as today’s headlines and other platforms.