Cloud River Urban Research Institute
Editor’s note:
Which country is the biggest exporter globally? Which Chinese city has the strongest manufacturing strength? How does the global supply chain correlate with deepwater ports? Where are China’s exporting industries concentrate? Cloud River Urban Research Institute uses its China Integrated City Index to answer these questions in detail.

China’s export stages a quick rally in the second half of 2020
The year 2020 is a special year marked by the outbreak of COVID-19 and excalating China-U.S. trade frictions. The two had a huge impact on the global trade, as global exports slumped by 7.2% in 2020 from the 2019 level.
The dual pressure dealt a huge blow to China’s exporting indutries, leading to negative growth of China’s exports in the second half of 2020. Forutunately, with the epidemic brought under control in the country, its export rebounded in the second half of the year. Throughtout 2020, China’s export bucked the trend to realized a 3.6% growth rate while other major trading countries suffered a decline.
Figure Top 30 countries/regions in terms of exports in 2020
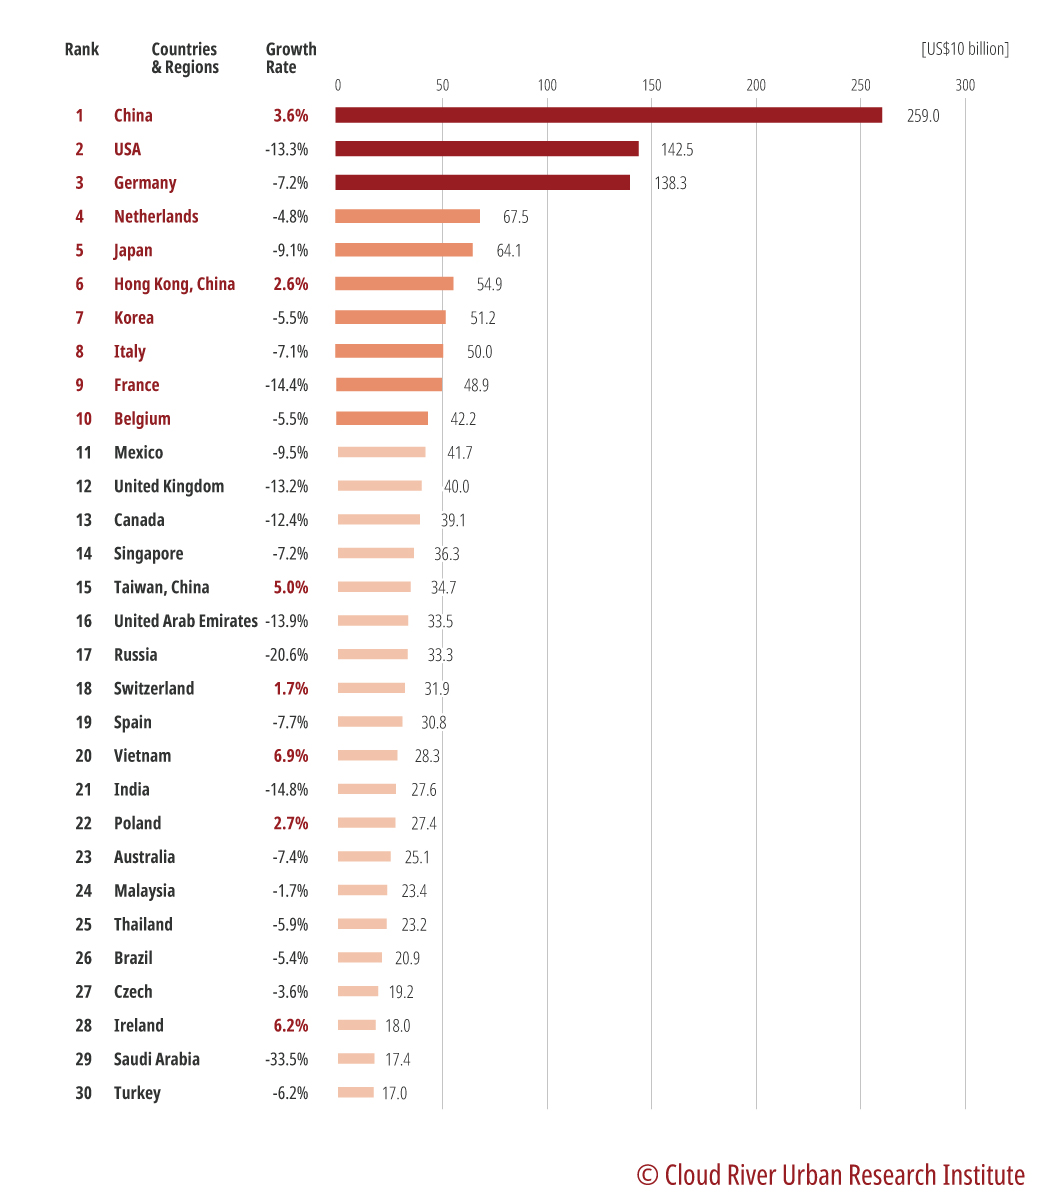
Figure 1 shows that China dominated the list of the global largest exporters in 2020. The top 10 exporters were China’s mainland, the U.S., Germany, the Netherlands, Japan, China’s Hong Kong, the Republic of Korea (ROK), Italy, France, and Belgium. Among them, only China and China’s Hong Kong realized positive growth.
Zhou Muzhi, head of Cloud River Urban Research Institute, commented that their growth signified the success of China’s zero-COVID policty on one hand, and demonstrated the strong resilience of China’s industry clusters serving the global supply chain on the other hand.
The first-place China’s mainland and the sixth-place China’s Hong Kong combined accounted for 17.8% of global exports, 2.2 times that of the U.S.
Which Chinese city has the biggest manufacturing radiating strength?
Based on China’s Integrated City Index, Cloud River Research Institute looks at the “manfuactring radiating strength” of 297 Chinese cities above prefecture-level and above. The “manfuactring radiating strength” is an indicator in a broad sense to measure a city’s exporting prowess and its payroll in the manufacturing sector.
Figure 2 Top 30 Chinese cities in terms of the manufacturing radiating strength in 2020
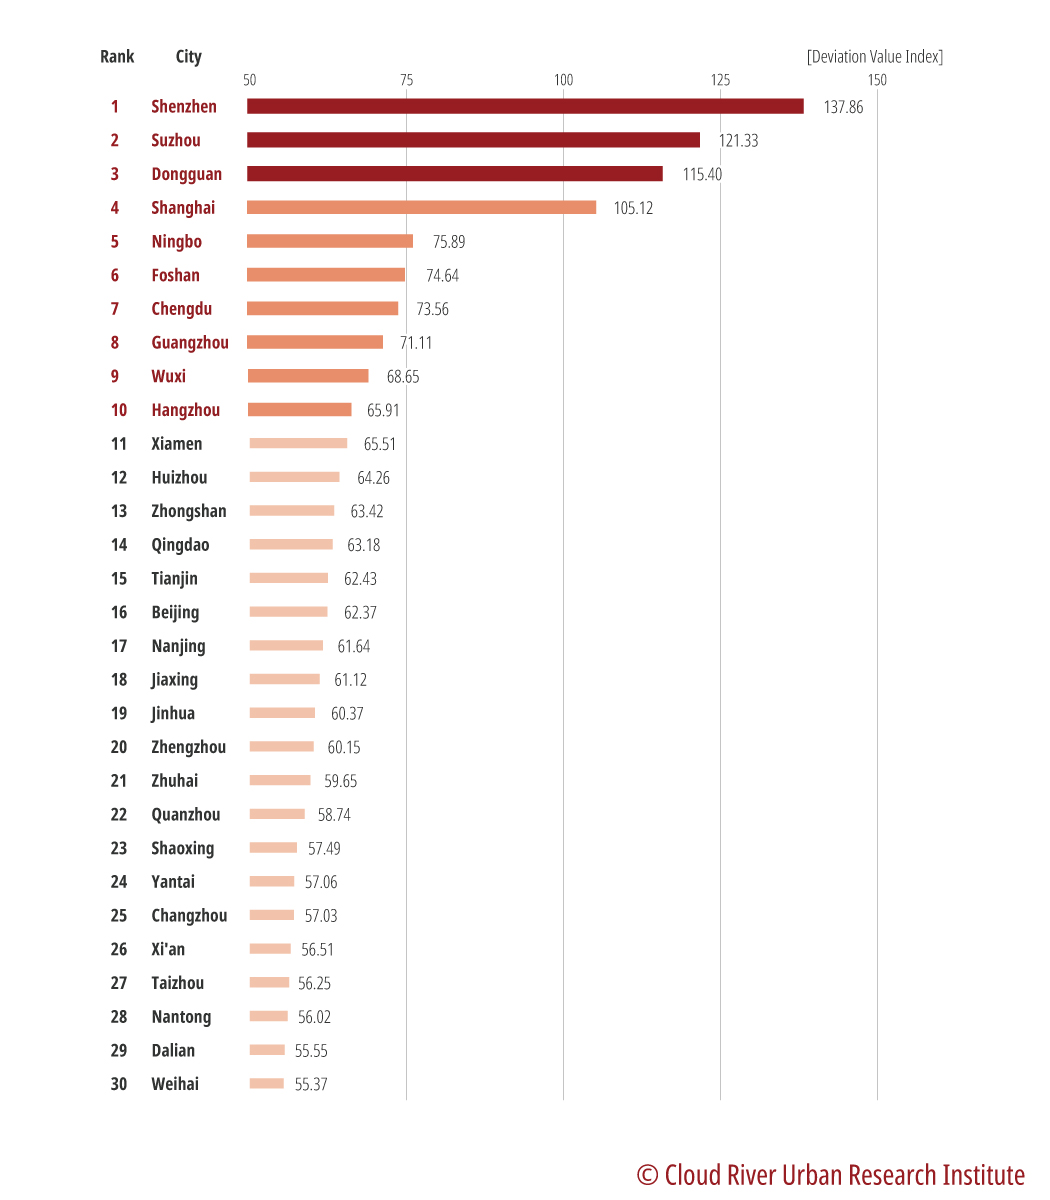
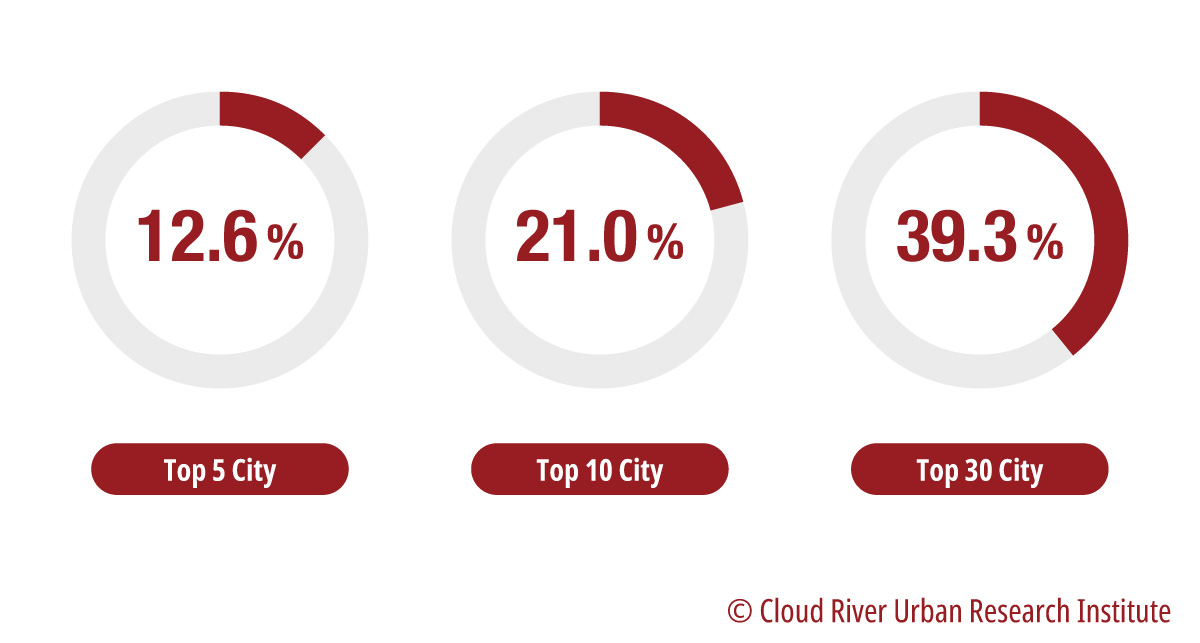
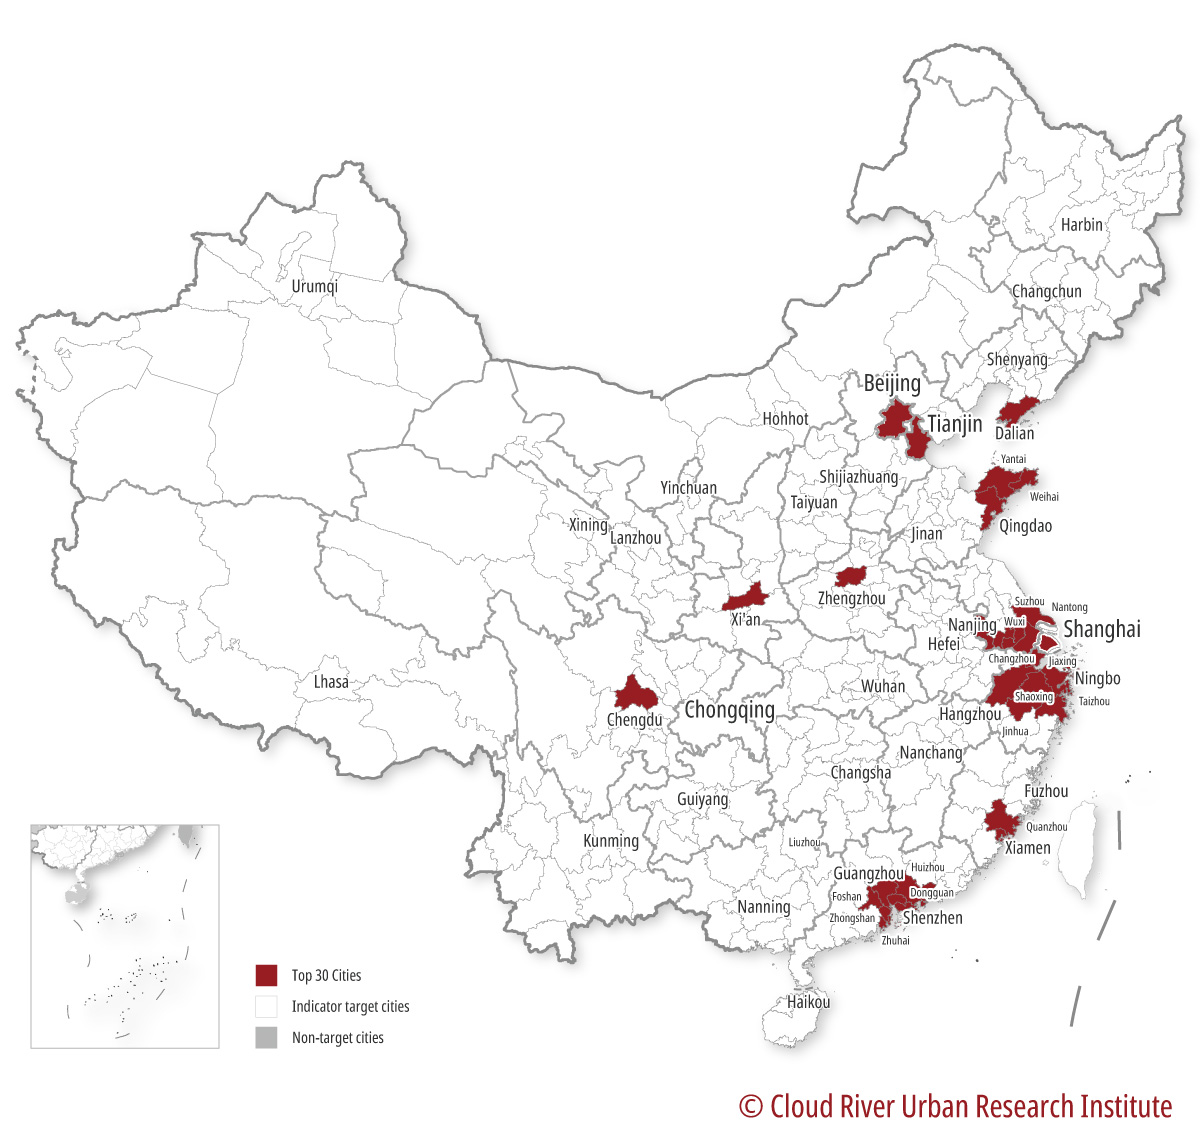
The top 10 cities in the rankings of the manfuactring radiating strength in 2020 were Shenzhen, Suzhou, Dongguan, Shanghai, Ningbo, Foshan, Chengdu, Guangzhou, Wuxi, and Hangzhou. These cities, excluding Suzhou, Dongguan, and Wuxi, registered positive growth in their export at varying rates.
Zhou pointed out that six cities in the top 10, namely Shenzhen, Suzhou, Dongguan, Ningbo, Foshan, and Wuxi, barely had an industrial foundation before China’s reform and opening-up policy was launched, and used to be normal middle and small-sized cities. Shenzhen was once a small fishing village. Their rapid growth into big cities for global trade in merely a few decaded is explained by expanding global supply chains.
China’s exporting industries are mainly concentrated in its manufacturing centers
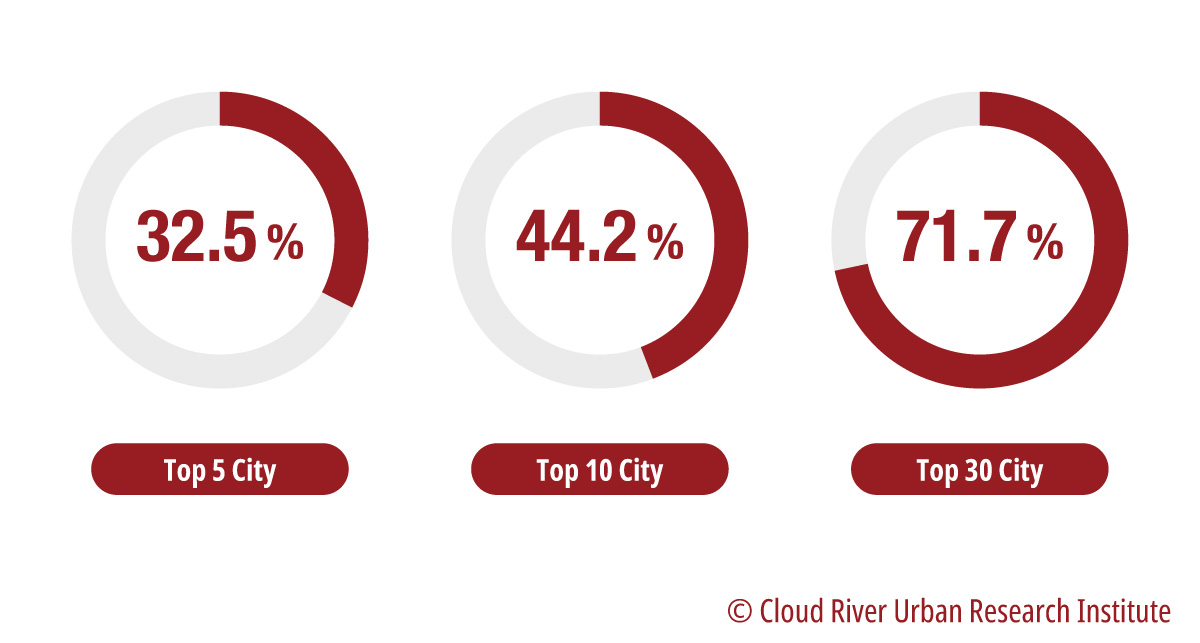
Figure 3 shows that the top five cities in the ranking combined accounted for 32.5% of Chin’s total exports, the top 10 cities combined 44.2%, and the top 30 cities combined 71.7%.
Zhou said, these top-ranking cities are reckoned to be super manufacturing cities even in the world, and China’s exporting industries mainly cluster in these cities.
Figure 3 Concentration of exports in Chinese cities in 2020
The key role of deepwater ports
The top 10 cities in the rankings of the manufacturing radiating strength of Chinese cities, with Chengdu excluded, have large container ports.
Zhou concluded that that container shipping and deepwater ports are cruicial to the global supply chain, and therefore the industries serving the global supply chain mainly cluster in the areas with deepwater ports. Hence, exporting industries and container shipping are closely interconnected.”
In 2020, the container throughput of China’s mainland topped the world, accounting for 30.1% of the global total. In the ranking of global container terminals, China’s mainland at first place and China’s Hong Kong at 10th place combined outnumbered the other 10 countries in the top 12, namely the U.S., Singapore, the ROK, Malaysia, Japan, the UAE, Türkiye, Germany, Spain, and India.
Zhou explained that a container throughput is a gauge of the activity of the global supply chain, and Chian’s dominance in global container throughput underlines its core position in the global supply chain.
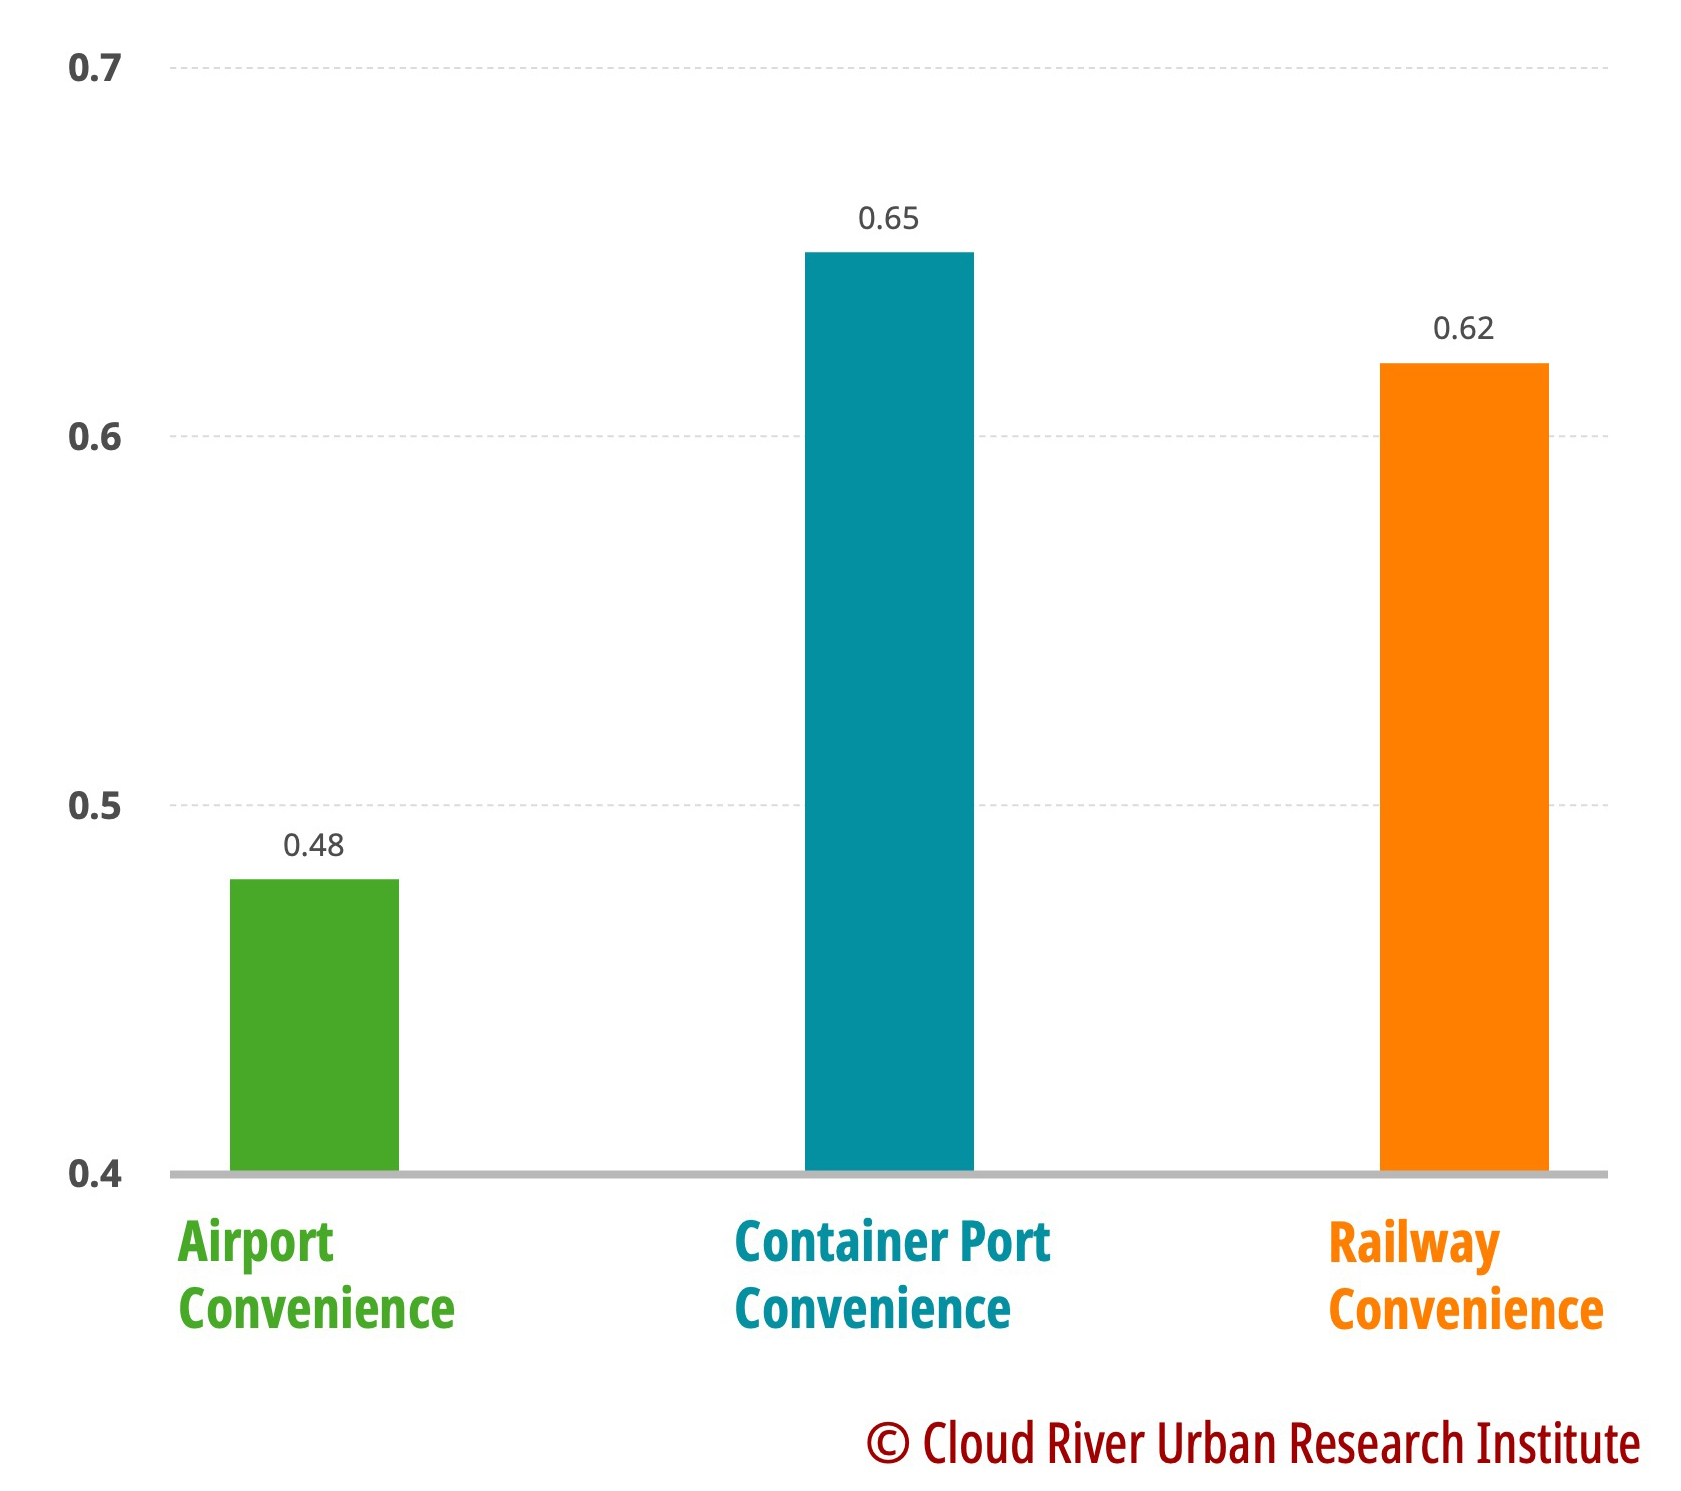
Cloud River Research Institute observed the correlation between the manufacturing radiating strength of 297 cities and their urban transit hub functions. Figure 4 shows that the manufacturing radiating strength most closely correlates with the convenience of container ports with a rate of 0.65. In contrast, the manufacturing radiating strength loosely correlates with railway convenience and airport convenience, with rates of 0.62 and 0.48, respectively. The correlatin study reinforces Zhou’s comments.
Figure 4 Correlation between the manufacturing radiating strength of Chinese cities and their urban transit hub functions
China’s three city clusters lead the development of its exporting industries
In terms of big city clusters, the Beijing-Tianjin-Hebei region, the Yangtze River Delta, and the Pearl River Delta accounted for 5.4%, 36.6%, and 23.1% of the national total exports, respectively. They combined accounted for a staggering 65.1%.
Zhou conclude that three city clusters, expecially the Yangtze River Delta and the Pearl River Delta, are the engines of China’s exporting industries and also the places where the global supply chain is most buoyant.
Figure 5 Map of top 30 cities in terms of the manufacturing radiating strength
The article was first published on China SCIO, China.org.cn on Sep. 6, 2022 and reprinted by other news websites.
